Adress: Visitors Adress: Telephone: Box 1026 Gjuterigatan 5 +46 36-10 10 00 55111 Jönköping 55111 Jönköping
Sweden Sweden Study regarding: Industrial Engineering, Logistics and management Author: John Felix Ahlström Jönsson
Supervisor:Bryce Hylton, Dr Roy Andersson
Examinator:Leif-Magnus Jensen
JÖNKÖPING 2019 June
Implementing tracking and tracing
methods for returnable containers
Adress: Visitors Adress: Telephone: Box 1026 Gjuterigatan 5 +46 36-10 10 00 55111 Jönköping 55111 Jönköping
Sweden Sweden
This bachelor’s thesis has been conducted at the School of Engineering in Jönköping within the area of Industrial Engineering, Logistics & Management. The researcher takes full responsibility for opinions, conclusions and findings presented.
Examinator: Leif-Magnus Jensen
Supervisor: Bryce Hylton, Dr. Roy Andersson Scope: 15 credits
Abstract
Purpose: To investigate possible methods for managing, tracking and tracing returnable
containers within supply chain. To achieve this purpose following research questions were answered:
RQ 1: How can tracking and tracing methods be implemented within supply chain? RQ 2: What resources would be required to implement tracking and tracing methods? RQ 3: Which methods are best suitable within supply chain for returnable containers?
Scope and delimitations: Focus was given toward evaluating best possible methods for
tracking and tracing returnable pallets for case company. Case company is a large multinational company located in South Carolina, USA.
Methodology: A case study is performed on the case company dealing and managing
returnable containers. Data collection was done through literature studies, document studies, observations and interviews while using tools for root problems visualization in order to highlight what core issues are responsible for the company or process to not perform as wanted.
Findings: Three possible container management methods for case company are Auto ID
systems in receiving terminal 2 and in the outbound returnable terminal. Barcode scanning is a possibility due to system compatibilities. Third option is increasing responsibilities of the supplier when managing returnable containers, allowing for more supply chain integration. Literature states that Auto ID systems are expensive but allow for simple receiving administration without increasing lead time and labour cost through the benefits of automation. Expansion of current barcode scanning allows for low implementation costs and compatibility with current systems. And with increased external supply chain integration can case company offer improved booking services for suppliers. Author concluded that the three possible methods of RFID scanning, Barcode scanning and supply chain integration are all viable options for pallet management purposes, but the choice of which is dependent on what resources case company is willing to invest and how much futureproofing is necessary for future projects.
Keywords:
Lean production, Radio Frequency Identification (RFID), Returnable container, inventory management.
TABLE OF CONTENTS
1 Introduction ... 3
1.1 Background ... 3
1.2 Problem formulation ... 4
1.3 Purpose and research questions ... 4
1.4 Scope and delimitations ... 5
1.5 Disposition ... 6
2 Methodology ... 7
2.1 Case study ... 7 2.2 Work process ... 7 2.3 Research approach ... 9 2.4 Ethical considerations ... 122.5 Reliability and validity ... 13
3 Theoretical Framework ... 14
3.1 Connection between theory and Research questions ... 14
3.2 Lean ... 15
3.3 Inventory management ... 16
3.4 Supply chain integration ... 19
3.5 Lead time ... 20
3.6 Automation ... 21
4 Empirical data ... 22
4.1 Business description ... 22
4.2 Description of returnable container types. ... 23
4.3 Interview results. ... 23
4.4 Literature examples of returnable container management and implementation. ... 24
5 Empirical data analysis ... 27
5.1 How can management, tracking and tracing methods be implemented? ... 27
5.2 What resources would be required to implement tracking and tracing methods? ... 28
5.3: Which methods are best suitable within supply chain for returnable containers? ... 31
6 Discussion and conclusions ... 32
6.1 Discussion ... 32 6.2 Methodology critique ... 32 6.3 Conclusions ... 33 6.4 Future studies ... 33
References ... 34
Appendix ... 37
TABLE OF FIGURES
Figure 1: Scope of study ... 5
Figure 2: Work process timeframe ... 8
Figure 3: Connections between research approach and research questions ... 9
Figure 4: Ishikawa diagram ... 12
Figure 5: Theories in connection to research questions ... 14
Figure 6: Fixed order point system ... 17
Figure 7: Fixed order interval model ... 18
Figure 8: Supply chain activities added to total lead time ... 20
Figure 9: Pallet receiving instructions and VMI ... 23
Figure 10: Desirable characteristics of AutoID technology ... 25
Figure 11: Procedure of definitions and laboratory examinations (Kirch, et al., 2017) ... 26
Figure 12: Total cost estimation of passive RFID implementation ... 29
Figure 13: Expected requirements for barcode scanning ... 30
Figure 14: Resource demanding warehouse management processes ... 30
Figure 15: Fishbone analysis ... 31
Figure 16: Type 4 container ... 37
Figure 17: Type 1 container ... 37
Figure 18: Type 2 container ... 37
Figure 19: Type 3 container ... 37
LIST OF TABLES
Table 1: Case study interviews……….………...11Table 2: Quantity/Periodicity dependence……….……..………..…………..16
3
1 Introduction
This chapter provide background to conducted investigations and which problems the study was built from. Three research questions were formulated and outlined in addition to describing the scope and delimitations of the study. The chapter ends with an outline of the study to make information presented accessible and provide additional structure.
1.1 Background
An increasing amount of companies are replacing their packaging with materials, pallets and containers that are reusable and returnable to safeguard the environment and reducing costs. Costs are thusly reduced by eliminating the need for purchasing non-returnable containers regularly in addition to reducing disposal costs (Jansen & Krabs, 1999).
Data and information are vital resources in organizational management. All organizations need a wide array of data and information to effectively control their business. Data can be used to show stakeholders what decisions are necessary for further growth, therefore it is important to gather information that is relevant to the individuals and systems (Giannoccaro, et al., 1999). A good metric to determine if data collected is relevant data could be done through direct connections to data sources, while also being aware of risks regarding the data, in other words working with threat containment. Being aware of risks that could skew data and results show comprehension in what the original information was used for. Effective information management can save on both on time and costs, especially if information flows are effectively automated instead of manually reported (Boname, et al., 2017).
Within logistics, warehousing and manufacturing pallets has been a staple ever since the early 1920’s when forklifts became a common tool (Singh & Ted, 2011). Pallets allow for easy transport of goods and is vital within industrial and transport logistical contexts. Transport pallets are traditionally made of wood but could also be made of a wide variety of materials depending on what is desired and needed during transport and general goods handling (Mokhlesi & Lohrasebi, 2008).
From a lean production perspective, organizing and secure work processes is a core concept of the lean production theory, also known as Poka-yoke. Meaning tasks simple enough that all workers can complete given task regularly without any complexity or confusion. In other words, use visual tools to make sure that underlying problems and issues are not hidden. Clear visualization tools allow co-workers to complete their tasks in the correct way from the start, avoiding the needs of re-doing faulty work and unnecessary costs (Fantin, 2014; Petersson, et al., 2015).
Warehouse optimization is critical for a supply chain to perform optimally, and the information where pallets are located is a central part for increasing the picking, sorting and transportation within warehouses (Maleki & Meiser, 2011). Within warehousing, production and distribution, barcode scanning and Radio Frequency Identification (RFID) are most commonly used to keep track of assets. Assets that could be tracked are anything from tools to supplies, items and co-workers. While it is expected that articles can disappear, scanning and tracking will at least let the organization know when something is missing before it is needed (Maleki & Meiser, 2011).
4
1.2 Problem formulation
Without formal organizing of returnable containers there exists risks for sub-optimal allocation and consequently planned investments and improvements will be less beneficial. Management of said returnable containers has seen increased importance, especially in Kanban and JIT-based supply chains where management of returnable containers is critical (Rosenau, et al., 1996). Ineffective management of returnable containers can lead into increased transportation costs and operational costs. Most common problems in container management are: containers constantly getting misdirected, lost or inadequacy tracked and quantified (Tweede & Clarke, 2008).
Key reason behind mismanagement is often attributed to lack of visibility regarding returnable containers in the supply chain which is a key problem that need to be handled, one way to increase visibility within a supply chain is using AutoID systems (Maleki & Meiser, 2011). Lack of academic results within modern container management showcase the need for this study.
1.3 Purpose and research questions
Companies are investing and focusing more on returnable containers for environmental, economic and flexibility reasons, showing the need for improved management of said containers. Mismanagement of returnable containers can lead to negative consequences in transportation and operational costs. Whilst academic studies relating to implementation of returnable container management methods exist, they are both scarce and focus on a single method instead of comparing theoretical implementation of management methods. This study seeks to supply that information.
Therefore, the study has the following purpose;
“To investigate possible methods for managing, tracking and tracing returnable containers within a supply chain.”
Implementing management methods in a pre-existing supply chain require knowledge regarding how new management systems and methods interact with already established routines and systems, thus following research questions (RQ) have been considered.
RQ 1: How can tracking and tracing methods be implemented within supply chain?
How to implement management methods is a broad question, in which a general overview of several implementation methods is necessary to answer the RQ.
RQ 2: What resources would be required to implement tracking and tracing methods?
Resources are important to take into consideration when investigating possible management methods and systems as that will influence both effectiveness and cost.
5
Achieving a supply chain where returnable containers are central in decreasing operative, flexibility and environmental cost requires support functions such as management, tracking and tracing systems for the resource of returnable containers to be utilized effectively. Due to the physical and returnable nature of returnable containers, it is necessary to manage differently than standard containers. By answering RQ 3 it will provide an outline with how companies can adapt their supply chains to accommodate returnable containers.
1.4 Scope and delimitations
The scope of the study concern evaluating management methods for organizing and tracking returnable containers. The study particularly focuses on the positives and drawbacks each suggested management method will theoretically provide.
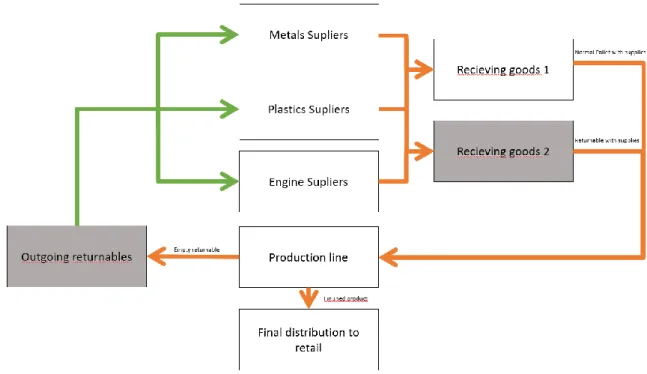
Figure 1: Scope of study
As seen in Figure 1: Scope of study, work was focused entirely within the outgoing returnable terminal and receiving goods 2 sections of the supply chain which is illustrated by the grey squares. Reasoning being that in outgoing returnable terminal and receiving goods 2 is where returnable containers are located most of the time and where it is the easiest to start tracking them. This means that the study did not extend to specific supplier relations but instead what can be done between Outgoing and receiving to create a tracking framework. Why receiving goods 1 is not covered by the scope of this project is because returnable containers received in that terminal is owned by suppliers and therefore not relevant to case company and thus not a focus of this study.
Some returnable containers are owned by the suppliers and are received and processed in a different part of the production facility, these returnable containers were not be covered by this study, however there might be potential for transferability if any suggested solutions are implemented. The study is limited as a suggestion to affecting organization but does cover recommended management, tracking and tracing methods and what resources implementation would entail. Other commodities are not included in current scope of project.
6
1.5 Disposition
In order to create structural integrity in the study, content has been divided into 6 chapters in accordance to framework supplied by Jönköping University.
Chapter 1: This chapter provide background to conducted investigations and which problems the study was built from. Three research questions were formulated and outlined in addition to describing the scope and delimitations of the study. The chapter ends with an outline of the study to make information presented accessible and provide additional structure.
Chapter 2: Methods and approaches used to fulfil the purpose of the case study are presented within this chapter. Background of case company is described followed by an explanation of the work process with a timeframe and outline. Used methods are described and justified. Finally ending with ethical considerations of the research paper in addition to its reliability and validity.
Chapter 3: A theoretical basis for the study is provided, which was required to answer the purpose and research questions. Chapter presents examples, definitions and industrial literature reviews.
Chapter 4: A full business description including relevant operations was introduced. Relevant empirical data and results were presented within theoretical framework to provide basis for the conducted analysis.
Chapter 5: Collected empirical data is analysed through the lens of the theoretical framework to achieve found results. For dispositions sake, chapter is divided into the three research questions.
Chapter 6: Analysed empirics is discussed further within the chapter, practical applications and implications of what the study has achieved is also discussed. Conclusions of study are highlighted, and suggestions are given for future research within the subject.
7
2 Methodology
Methods and approaches used to fulfil the purpose of the case study are presented within this chapter. Background of case company is described followed by an explanation of the work process with a timeframe and outline. Used methods are described and justified. Finally ending with ethical considerations of the research paper in addition to its reliability and validity.
2.1 Case study
A case study is a designation for less defined groups, for example, one to several groups, organizations or situations. Case studies are favourable when working with qualitative information and conducting qualitative analysis. Due to the purpose of the study, most information has been relayed through observations of case company employees and supervisors over pure quantitative data. When Observing processes and social units is perceived as qualitative information and is thus beneficial to conduct a case study (Kothari, 2004). Detailed and deep descriptions of work environment, operators and processes are needed to grant a realistic reflection of work processes. Work sequences are deconstructed within short sequences and become the base for conclusions (Kothari, 2004).
Case company used was Husqvarna Outdoor Products AB, Orangeburg county, Old Elloree Road, South Carolina, which is a subsidiary of the Swedish company Husqvarna Group AB. The Orangeburg county production plant used to be known as Roper Lawn Mower Company in 1972 before being acquired by the Swedish parent company and has since then has experienced rapid growth. It has grown from a single production line to a plant the size of almost two million square feet making it the parent company’s largest plant globally (Gay, 2017). Husqvarna Group AB most commonly produce outdoor products such as both robot and ridable lawn mowers, chainsaws, and trimmers. Husqvarna Group AB additionally produce watering products, cutting equipment and diamond tools for building industries. Historically Husqvarna used to produce muskets during its start-up in 1689 but since then has grown into different industries such as motorcycles, sewing machines and home appliances (Husqvarna Group, 2019). Husqvarna Outdoor Products AB Orangeburg is a production plant specialized in the production of ridable lawn mowers, if it is ridable it was made in Orangeburg according to an interview with Columbia Business Monthly. The production plant has roughly 22.000 employees including temporary workers, leading to the company being the largest source of manufacturing jobs in the region and by proxy lots of support from both the community and local leaders (Gay, 2017).
2.2 Work process
The work process was split into 6 phases and conducted from January of 2019 to June of 2019 at the case company while finalization was done during June. Figure 2: Work process timeframe was established for time management purposes and to effectively structure work.
8 Figure 2: Work process timeframe
Phase 1: Was started when it became time for the author find a suitable area for study, author was already interested in container management and opportunity presented itself to research said subject at the case company. A meeting was held with the case company to present what the author could supply theoretically to solve issues whilst case company presented what they could supply practically within the subject. After the meeting it was established that the author would once a week meet the supervisor for suggested improvements and guidance for the project. During these meetings the author presented progress each time the author arrived at the case company. After the first meeting, a tour of the entire plant was given to the project group, to visualize daily work within the facility and the complexities of the organization.
Phase 2: Methodology and strategy were the first things established after deciding on what to focus on regarding the study. Establishing methodology and strategy early on allowed the writer to structure work efficiently.
Phase 3: Literature review was one of the first chosen methods and could therefore be started shortly after the methodological approach. Chosen literature was a basis for examining similar situations at other companies and how their issues was solved in addition to providing applicable theories to the study.
Phase 4: Frequent visits were made to case company when observations were necessary, most of which were made when the case study was conducted. This is preferable as case studies are mostly based on qualitative information such as observations (Kothari, 2004). During each time a meeting was scheduled an onsite supervisor was supplied that contributed material or information needed for progress within project.
Phase 5: Majority of data collection were complete at the start of this phase, allowing for analysis and discussion of all data collected thus far.
Phase 6: Was spent on finishing touches, presentations and seminars to confirm the quality of the study.
9
2.3 Research approach
The answer to RQ 1 was based on literature reviews and document studies relating to the solutions of similar problems within other industries. Group discussions were conducted with supervisors regarding possible and viable methods. Interviews with concerned parties were conducted to provide framework on how chosen methods can be implemented without interfering with current work environment.
Observations, interviews, literature studies and brainstorming with supervisors were key in answering RQ 2. Observation provided a complete vision of the case company and how implementation of chosen methods will affect the organization.
RQ 3 was answered through interviews with both supervisor within the case company and individuals in case company whose daily work includes managing returnable containers. Conclusions were based on recommendations in chosen literature and examples how other companies solved similar issues.
As seen in Figure 3: Connections between research approach and research questions, observations and interviews are two research approaches which were used to answer all RQs. Therefore, they were of key importance to the studies success.
Radio Frequency Identification (RFID) is a common and modern method in both tracking and management of articles thus it was decided early on to investigate potential implementation. RFID has a lot of new and relevant research due to its increase of usage, but it is not commonly researched and utilized within the subject of returnable container management.
Most conducted research in the study was regarding how new processes can be introduced organically without adding complications to current processes (Golafshani, 2003). By conducting research with workers that are working with returnable containers daily allowed the study to gain important insights regarding potential improvements. Reasoning being that people that work daily in systems are often more knowledgeable than people responsible for said systems due to larger amounts of exposure (Liker, 2009).
10 Literature review
Literature reviews provides understanding of the subject for both the author and the reader, and allows the author to gather, source and evaluate peer reviewed research to provide unbiased research (Winchester & Salji, 2016).
Several information databases were used to search for relevant literature, with Primo, Scopus and ProQuest Central being the most prevalent. As the authors student status within Jönköping University and University of South Carolina these worldwide research databases were accessed through both of their libraries. The technique of snowballing was occasionally used to search for literature. Snowballing is defined as using literature by finding its most reliable source by going through lists of relevant papers that are connected by original paper, and using their relevant articles, continuing until no more relevant articles can be found (Badampudi, et al., 2015).
Document study
Document studies are used to analyse documented events and conditions in order to answer research questions. Documents are useful for mapping and illustrating activities of employees and strengthen interviews and observations (Patel & Davidson, 2011).
All documentation was supplied by the research papers supervisor, documents included mostly information regarding quantity of returnable containers sent to suppliers, but also diverse information regarding suppliers.
Observations
Observations are favourable in understanding behaviours within both systems and people. Observations allow researchers to understand subjects from a differing perspective, often from people’s perspectives that work daily with that is being observed, allowing researchers to get a more holistic view of ‘’things’’ researched (Kothari, 2004). Structured Observations is classified as a qualitative research method which is necessary for case studies (Kothari, 2004).
Within this case study, it was crucial to understand systems for container management in terminals, receiving goods, and outgoing goods. Understanding the workplace at a ground level made sure that suggested methods of management would not interfere with the day to day activities of a terminal worker. Input from specialized workers within terminal was also key for creating qualitative solutions.
Interviews
Interviews are either structured or unstructured, both can be adapted to fit material collection for a specific situation, one example of this is a semi structured interview (Yin, 2003). Semi structured interviews follow a general format and pre-prepared questions but is allowed alter the trajectory of the interview if it is required to collect specific and relevant data. Reasoning behind conducting a semi structured interview is the ability to collect a larger amount of valuable data due to not being limited to a premeditated structure and the informal setting allowing for a steady stream of information. Main drawback of this method is the resource intensity and time-consuming interviews required for this method (Keller & Conradin, 2018).
Interviews with chosen employees were conducted through a short survey in a semi structured form. It was possible to interview a material handler, auditor and a supply chain specialist regarding their opinions on what could be done to solve presented issues.
Table 1: Case study interviews summarize conducted interviews relating to returnable container management.
11 Table 1: Case study interviews
Role Topics discussed Duration
Supply chain specialist
• Terminal structure • Inbound and outbound supply chain • Terminal guidance • Data collection • Issues relating to container management • Work process 2.30 Hours Auditor • Inbound and outbound supply chain • Receiving process • Terminal specifications • Main issues relating
to container management • Work process 1 Hour Material handler • Terminal specifications • Issues relating to container management • Work process 30 Minutes
Three main questions were used as a basis for the semi structured interview for all respondents. • What would you like to see in a new system to organize and track returnable containers? • How would you feel regarding additional barcode scanning or observation during the
receiving process?
12 Root problem visualisation
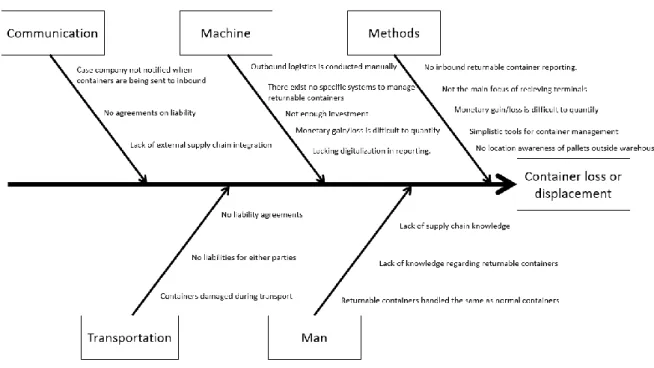
To create new processes or improve old ones, one must consider what core issues the new and old processes are meant to solve. Visualizing issues is an important step to make sure that everyone involved will comprehend what the core issue is instead of just working to solve the symptoms (Radziwill, 2017). To answer which management system will fit case company the best, one must consider core reasons behind management, tracking and management issues. For this purpose, a fishbone analysis is commonly used (Sörqvist, 2004).
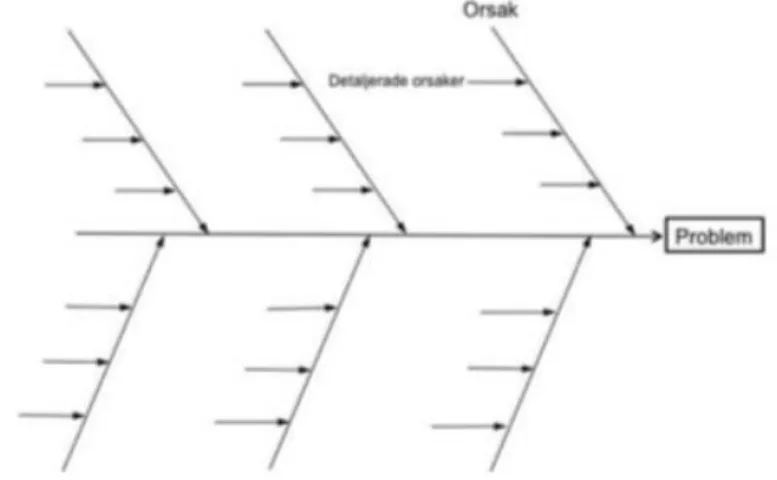
Originally known as Ishikawa diagram from its Japanese origins, it seeks the underlying causes of a studied issue to solve said issues. Potential causes are mostly structured by machine, method and human categories, which is done in a cross functional team which all aim to find possible causes for the problem or issue (Sörqvist, 2004). Main strength of the tool is through visualization purposes, allowing mutual understanding of core issues across departments. When causes are identified the underlying reasons need to be highlighted, commonly by using 5 supplementary questions per cause, usually known as a 5-why analysis (Radziwill, 2017). An example of a traditional Ishikawa diagram is seen in Figure 4: Ishikawa diagram.
Figure 4: Ishikawa diagram
Ishikawa diagram was used within this study to pinpoint the core issues relating to container management of an example. Within this study it was used for visualization purposes for the author which was useful for the analysis.
2.4 Ethical considerations
Biggest ethical considerations within the study was; anonymity, informed consent and confidentiality. Most considerations were based on the times the project needed to interact with workers, mostly through interviews. Before interviews with co-workers within returnable pallet processes, employees were briefed about what their responses will be used for, and how they can later access the report once finished.
The study was firstly used in purpose for the authors education but secondarily as an improvement proposal for the case company. This was explained to the case company avoid misunderstandings between both parties.
Ethics within qualitative research is harder to classify than quantitative contexts. Skewing numbers within a quantitative research project to prove given hypothesis is unethical. But within qualitative research with few statistical processes, it is more difficult to trace where
13
information has been unethically (Sanjari, et al., 2014). To overcome these challenges the researcher used frequent contacts with supervisors both from Jönköping University and at Husqvarna Outdoor products in Orangeburg county to supply feedback on research progress and confirm authenticity (Sanjari, et al., 2014).
Another consideration regarding the context of this study is that it was written by a single person. Problem solving by a single person is often faster and more effective with less complex tasks, meaning that research by a single person has a larger risk of being affected by personal bias. Additionally, it was found that groups perform better than the best individuals at solving complex problems in an article published by the American Psychology Association. Problem solving by an individual have tendencies to often repeat faulty solutions, showing need for alternative ideas, something that is more difficult to be achieved by a single person (Laughlin, et al., 2006). To avoid repetition of faulty ideas, every single idea and possible solution was processed through supervisors of the study before progressing to make the research bias free.
2.5 Reliability and validity
For the study to achieve reliability and validity, frequent evaluations have been conducted by supervisors from both case company and publishing university. Within a case study context, the goal of validity is to ideally eliminate mistakes and personal bias (Yin, 2003). The concept of reliability is most commonly defined as the extent an investigation or study can be repeated and achieve an equal result (Merriam, 1993). Validity is split into two forms, internal and external validity. Internal validity refers to the ability to confirm to which extent measured results and theories line up with reality in addition to measuring that which is supposed to be measured. External validity means to what extent results are transferable and generalizable to other situations that are not researched (Byrman & Bell, 2007).
The reasoning for using several methods of data collection is to elevate reliability by broadening the perspective on the subject area, a concept known as Triangulation which also improves the study’s internal validity. The triangulation within this study has been bolstered with interview questions which have been answered in most parts of the corporate hierarchy leading to even broader perspective of case company. The supervisor and supply chain specialist have been part of the study by regularly confirming if the authors perception of information and workplace was correct (Yin, 2003).
A clear purpose and heavy documentation for methods used was established early on, in addition to a specific research scope and delimitations to avoid confusion about the studies direction. Heavy documentation was used to confirm where gathered information originated from, granting the possibility for methods to be repeated and achieving similar results which is the definition of reliability (Merriam, 1993).
14
3 Theoretical Framework
A theoretical basis for the study is provided, which was required to answer the purpose and research questions. Chapter presents examples, definitions and industrial literature reviews.
3.1 Connection between theory and Research questions
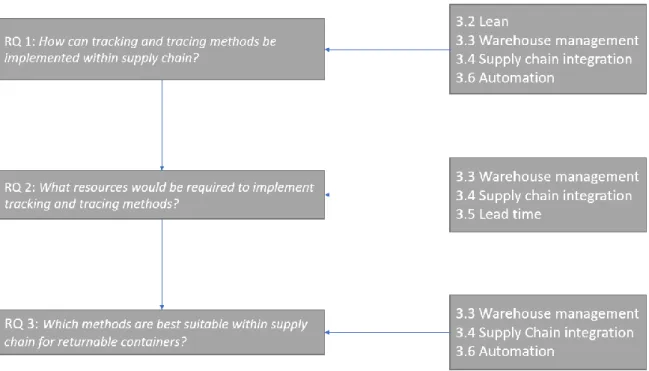
Following theories are used within current study, with Figure 5: Theories in connection to research questions illustrating connections theories have to the previously stated research questions.
In order to answer RQ 1, four development strategies have been consulted within Lean, warehouse management, supply chain integration and automation. Each development strategy allowed for differing implementation viewpoints and will help triangulate the answer to RQ 3.
For RQ 2 warehouse management, supply chain integration and lead time were critical in analysing what effects suggestions can have on supply chains, providing necessary knowledge to answer RQ 2.
In RQ 3 having a deep understanding of what the benefits and conditions are for each chosen organizing systems was key in answering the RQ. Warehouse management provided tools for understanding restocking patterns in the supply chain and how they could be managed. Supply chain integration will provide understanding of how changes will affect both the supply chain and its parts. Analysing possible automation processes was used for understanding where human interaction is necessary and appropriate for improvement projects.
15
3.2 Lean
Lean is a widely known theory within industrial economics. The theory was first pioneered by the Japanese auto manufacturer Toyota in 1980. Through their new production system, Toyota Production System (TPS) Toyota was quickly becoming a role model for superior quality and effectiveness. This later led to the system serving as a base for Lean Production (Liker, 2009).
The Toyota Production System was key for outperforming their American competitors, the system allowed for more endurance and thus less repairs, stemming from the two pillars of both Lean theory and TPS, continuous work improvement and respect for people. TPS is split into 14 principles which is categorized in 4 sections, being: long term thinking, people and partners, problem solving and Processes (Liker, 2009).
Lean Production have several built-in systems and methods for quality and efficiency purposes, most notably Just In Time (JIT) and Jidoka. JIT refers to a planning philosophy that specifically refers to the ability to deliver goods and supplies exactly when needed and in right amount of quantity giving the benefit of continuous work flow, lower amount of capital being bound in storage and less work being necessary for maintenance. For JIT to be utilized it requires low cycle times and setup times. Jidoka refers to a method to avoid delivering defect products to customers while keeping up standard production pace. Jidoka is done in 4 phases: defects or problems are noticed, discover the abnormality, stop the process, fix the immediate problem investigate and solve the root cause (Petersson, et al., 2015).
Lean philosophies
Ensuring that projects, products and services not only satisfies the needs of the moment, but future needs as well is one of the pillars of Lean theory. Meaning that instead of creating temporary solutions that need to be fixed later, focus is instead on creating solutions that will last, saving additional work in the future even to the point where short-term financials are at risk (Petersson, et al., 2015). Waste is inevitable within production contexts; however, another philosophy of lean theory is limiting and eliminating waste. Waste is defined in several ways within Lean theory:
Overproduction: Arises when the company produces more than consumers demand. This
waste will by proxy increase other relevant wastes such as time, inventory and movement. Therefore, this waste that has risk to be the waste with the most negative impact on a company (Liker, 2009).
Inventory waste: Refers to excess raw material that will never be utilized, inventory waste can
be unnecessary inventory holding costs, which can be alleviated through JIT. Further inventory can be wasted if an article or product is defect, not high enough quality or wasting space due to that article not being used anymore (Liker, 2009).
Creativity waste: Underutilizing cerebral qualities and skills co-workers have is also seen as a
waste. If a task can be conducted without any critical thought, there is little to no reason not to use automated work methods instead (Liker, 2009).
Time waste: Refers to the time used for non-value adding processes within a supply chain, for
example if a machine regularly has downtime due to waiting for another process further in the supply chain, scheduling other activities during that downtime is one effective way of minimizing wasted time (Liker, 2009).
16
Process waste: Not using tools or materials to the maximum of their potential. Also occurs
when an item or article is overworked and way to high quality for its intended purpose or market which lead to inflated prices for little to no added value (Liker, 2009).
Defects: Items or articles that are in low quality or broken need to be fixed, creating extra work.
Extra work includes time, effort and potentially extra costs thusly it is critical to aim for satisfactory quality first time (Liker, 2009).
Movement waste: Excessive motions such as having complementary tools apart from each
other requiring unnecessary long walking distances and thus wasting time and energy of the effected worker (Liker, 2009).
Transportation waste: The waste of moving objects longer distances than necessary or having
unnecessary stops to its intended destination increasing both costs and wasting time (Liker, 2009).
3.3 Inventory management
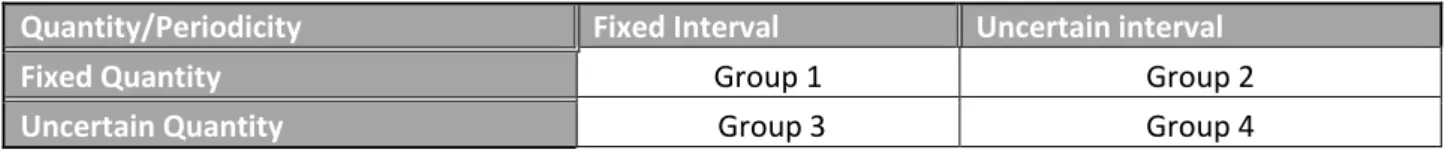
Inventory management methods can be structured in four different ways depending on certain conditions such as quantity and periodicity which is illustrated in Table 2: Quantity/Periodicity dependence (Oskarsson, et al, 2013).
Table 2: Quantity/Periodicity dependence
Quantity/Periodicity Fixed Interval Uncertain interval
Fixed Quantity Group 1 Group 2
Uncertain Quantity Group 3 Group 4
Group 1: Fixed quantity - fixed Interval
When demand is reliable in both time and quantity it is appropriate to use a method of having the right quantity ready to ship exactly when demand is expected to come in. Using safety stock to control for smaller unplanned uncertainties is appropriate to use in a fixed quantity – fixed interval situation (Oskarsson, et al, 2013).
Group 2: Fixed quantity – uncertain interval
Managing stock of items with reliable demand but uncertain periodicity in most cases use one of two methods, Fixed order point system or Timing cover planning (Jonsson & Mattsson, 2016).
Fixed order point system is characterized by following formulas: Reorder Point = Daily Average Usage (Demand) × Lead Time in Days
If case company manages a safety stock:
Reorder Point = Daily Average Usage (Demand) × Lead Time in Days + Safety Stock
For irregular usage rate and no safety stock should daily maximum usage replace daily usage. Reorder Point = Daily Maximum Usage (Demand) × Lead Time in Days
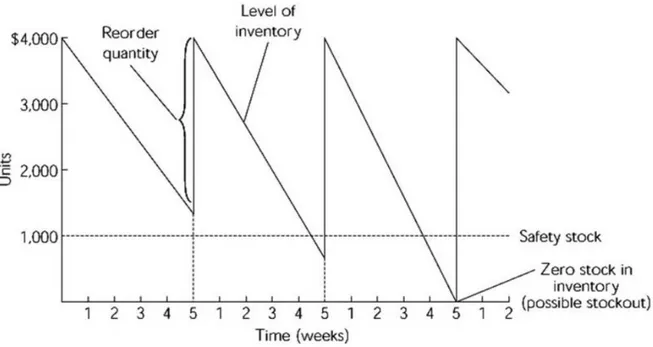
All these formulas result in a stock level looking similar to Figure 6: Fixed order point system (Jonsson & Mattsson, 2016).
17 Figure 6: Fixed order point system
Benefit of using fixed order point system is that once order point or reorder level has been set it is easy to administer stock as all work that needs to be done for system to work is to consistently check stock levels, however fixed order point system does not take into consideration short sighted demand variations (Jonsson & Mattsson, 2016).
Timing cover planning is similar to order point system but diverges from it by categorizing demand as time instead of quantity. The time cover is the time current stock is expected to last, utilizing safety lead time instead of safety stock. Cover time is calculated using following formula:
Cover time = Current Stock / Daily Average Usage (Expected demand)
Reorder point = Cover time – Safety Lead Time < Lead Time in Days (Segerstedt, 2014; Jonsson & Mattsson, 2016).
Group 3: uncertain quantity – fixed interval
Managing a warehouse where the quantity is uncertain, but the periodicity needs to be fixed, deciding during which intervals to position the reorder point is critical. Quantity during the reorder point is typically determined by usage, prognostication or unprocessed orders (Jonsson & Mattsson, 2016). Length of intervals are decided by cost per order and inventory holding costs, as more frequent orders will increase both of those in exchange for stock certainty. Shorter intervals would mean more frequent orders entailing more order costs but with the benefit of keeping average stock lower and thus lower inventory holding costs. Longer order intervals would inversely entail larger inventory costs due to larger order quantities but fewer order costs. Having longer order intervals will additionally lead to further risk of not being able to fulfil orders if larger variations in demand surface (Lumsden, 2012).
18 Figure 7: Fixed order interval model
Fixed order interval model is a typical method of managing uncertain quantities and fixed intervals and showcased in Figure 7: Fixed order interval model. Following formula is used:
Reorder quantity = Demand during lead time (not pictured) + Demand during order interval + Safety stock.
Group 4: Uncertain quantity – uncertain interval
The last inventory management group require the most complex methods due to the large degree of uncertainty, both in time and demand and are known as dynamic methods due to their adaptive qualities (Oskarsson, et al, 2013).
19
A typical example of the Silver and Meal method can be seen in
Table 3: Silver and Meal model. Silver and Meal method is commonly used for inventory management of spare parts which are known as articles often bought at uncertain times and quantities. Another benefit is its relative ease of use compared to other dynamic inventory management methods. Method stems from deciding quantity is based on the demands of a specific number of periods that in total minimize total cost per period. One requirement of using the silver and meal method is knowing demand per period for the number of periods required for deciding order quantity (Jonsson & Mattsson, 2016).
3.4 Supply chain integration
Supply chain integration (SCI) is built from two pillars, internal and external integration both of which aim to optimize information flow and material flow in the supply chain (Fawcett & Magnan, 2002). Commonly defined as a method to coordinate and connect flows of information, processes, people, knowledge and strategies through either technology or human processes. Supply chain integration is built on long lasting relations and complete solutions rather than short term money saving (Stevens & Jonson, 2016).
Within SCI theory exist 12 all-inclusive rules that counts for both internal and external integration if a streamlined supply chain is desired. Most relevant of these rules are as following, the benefits of timeframes, eliminate process uncertainties and highlight all information flows within the chain. By keeping to timeframes will all involved parties will be aware on when processes should be completed which allows involved parties to adapt and plan for themselves efficiently. Eliminating process uncertainties will make sure that time spent will be efficient and not utilized for unplanned processes. Highlighting information flows will simplify and optimize administrative work (Childerhouse & Towill, 2003).
Internal integration
Common description of internal integration is work processes being conducted cross functionally with other departments. Simplifying and standardizing all departments workloads will allow for a larger understanding across departments and will allow for more cross functionality. By giving a supply chain more cross functionality it will give the added benefit of being able to respond to customer demands as information will faster and effectively travel to the affected departments (Bowersox, et al., 1999).
External integration
Through sustainable strategies and visions with stakeholders and affected parties before cooperation is required will allow all parties to deliver a final product with the desired amount of quality with no misunderstandings (Fawcett & Magnan, 2002). By utilizing external integration all parties become dependent on common success, and to achieve said success all parties will have each other’s best interests in mind. To achieve common success, it will require all parties to create a work structure where trading information is common and continual (Chavez, et al., 2015).
20 Information sharing
SCI information sharing is either done technically or socially. Technically companies rely more on RFID or EDI technologies to share and cultivate information. Sharing information both internally and technologically benefits the visibility of production plans, deliveries and packaging instructions (Frohlich & Westbrook, 2001). By technically sharing information such as business systems for controlling the company and warehouse management systems for controlling warehouse related activities such as registering goods receiving, both of which make supply chains are more manageable (Childerhouse & Towill, 2003). Implementing technical information sharing processes could take a considerable amount of time due to the different number of technical standards, which need to be able to interact with current systems (Frohlich & Westbrook, 2001).
The key factor for implementing social information sharing is communication. While technical information is important to share, it does not matter if there is no interest to receive and consume said information (Fawcett, et al., 2007). Examples of social information sharing are sales history which could be used to prognosticate demand, strategic item information, emails and contacts. Specifying and coming to an understanding which role all participators will take within a cooperation regarding specific activities (Bowersox, et al., 1999).
3.5 Lead time
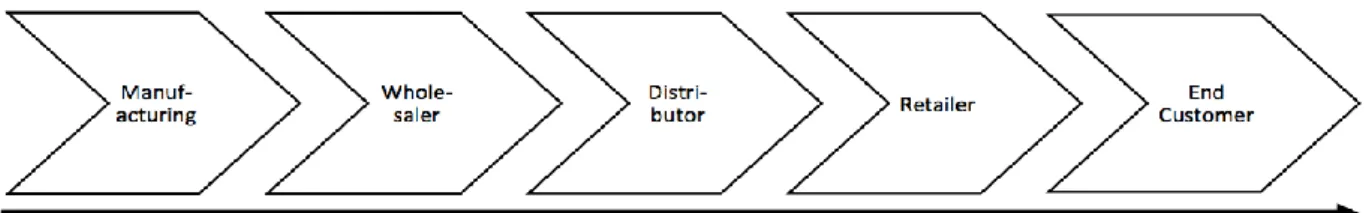
Lead time describes the time required from order placement to delivery, or in other words the time required to go through the supply chain to reach its intended goal. Example of normal supply chain activities which add to total lead time are listed in Figure 8: Supply chain activities added to total lead time. End customer will in most cases never be aware or care about supply chain activities, but rather they will be aware and interested in the amount of lead time to final delivery (Lumsden, 2012).
Figure 8: Supply chain activities added to total lead time
Short lead times are important for both service and cost reasons, short lead times will be perceived as low delivery times from consumer perspectives. Costs can result from long lead times creating longer times for stock spent in warehouse and thusly increased warehousing costs. Finding reasons behind long lead times in a production perspective is typically done by examining batch sizing, finding bottlenecks or examining push or pull demand on manual processes (Jonsson & Mattsson, 2016).
Push and pull demand
Companies generally plan their resources according to either a pull-based system or a push-based system. For a push-push-based system the allocation of resources is initiated by the company focusing on the load of needs, building up stock to meet said demand to the cost of possible overproduction. Pull demand is initiated by end customer or receiver, once a need has been known in form of an order or other interaction is production initiated (Jonsson & Mattsson, 2016).
21 Manual processes
Manual processes are procedures made with human interaction, there are certain movements that are impossible to for a machine to recreate, leading to the need of human workers within manufacturing contexts. However due to globalization aiming for standardization and cost effectiveness, using manual processes is not seen as effective as using machines to create consistent quality and production speed. Manual processes introduce risks of human errors which could potentially entail longer lead times to correct said errors (Sharma, 2011).
3.6 Automation
Due to demands of mass production, consistent quality and increasing labour costs is automation appropriate for many companies. In cases where automation has been properly implemented in production results in increased efficiency, consistency and quality in comparison to manual production and processes (Frohm, et al., 2016).
Modern production requires high adaptability and flexibility, one way to increase both of those factors is trough automation. However there exists issues that automation is less desirable for, such as strategic planning not being as qualitative as the planning of a human would. Certain ranges of motions are also currently impossible to recreate autonomically leading to the need of manual processes. Automation has a risk of requiring large money and time investment to function properly in addition to its implementation maintenance costs (Benet, 1993). In order to implement automation several factors need to be examined beforehand to confirm that automation will benefit the supply chain. The material details are vital to observe such as if there are toxic or hazardous materials which might benefit safety wise from automation. Taking into consideration if automating monatomic processes will free up as much capacity for the workforce as intended is key to identify if automation is necessary (Heizer, et al., 2010).
Level of Automation (LOA)
Depending on the intended processes, different levels of automation are necessary. Certain processes are better fulfilled by manual process as all production cannot be fully automated. The term Level of Automation (LOA) describes the how much automation is possible to implement within a process or a chain. Level of Automation is a tool to determine the optimal degree of automation compared to the human workforce (Endsley, 1999).
The tool uses 5 levels of automation Manual control: No assist from system
Decision support: recommendations are given by the system to the operator. Consensual AI: System and operator interact in tandem.
Monitored AI: System will implement actions with operator supervision, if operator have another option it will be implemented instead
Full automation: No interaction from operator.
Radio Frequency Identification (RFID)
Radio frequency identification or RFID for short, is a method of information automation and management, replacing manual processes when reporting the condition or location of a certain item RFID can transfer data from an electric tag by utilizing wireless radio frequencies. RFID can improve automation processed by allowing items to be automatically be tracked and traced through a manufacturing process. RFID systems are mostly used for management, controlling, transaction reporting and operation tasks (Pala & İnanc, 2008).
22
4 Empirical data
A full business description including relevant operations was introduced. Relevant empirical data and results were presented within theoretical framework to provide basis for the conducted analysis.
4.1 Business description
As illustrated in Figure 1: Scope of study, Outgoing returnable terminal and receiving terminal 2 are currently responsible for managing all returnable containers types. Outgoing returnable unit consist of two full time employees that exclusively manage returnable containers. Main activities and responsibilities of receiving terminal 2 are within goods reporting, receiving, administrating and transferring containers to storage spaces or activities they are required for. Returnable container orders are received frequently, several times per day totalling over 1650 orders since 2016. Returnable containers are delivered to more than 30 different suppliers within the plastics, engine and metals industries. A project to solve pallet management issues has previously been investigated by a case company employee, however the findings and progress of that project has been lost since the departure of said employee.
Outbound returnable containers.
Process for suppliers to schedule deliveries of returnable containers is done through a pull flow. The flow is initiated by the supplier sending a filling request to the supply chain specialist responsible for returnable containers which is typical for pull flows (Jonsson & Mattsson, 2016). After refilling request is received, available pallets are loaded until trailer is full. When pallets are emptied during production, they are sent to a courtyard area through a single gate specifically intended for pallet management. Returnable containers are stacked in the outdoor area for loading with a forklift at a later date. Trucks are always sent as full truck loads (FTL) meaning from a warehouse management system (WMS) viewpoint pallets are sent in uncertain intervals and fixed quantities (Jonsson & Mattsson, 2016). Filled trailers are often left standing until a truck is available to pick it up, case company uses several trucking companies for deliveries and trailers are rarely left standing more than 24 hours. Administratively, trailer number, trucking company, receiving supplier, date of loading and date of departure are noted on a physical spreadsheet, one for each day which is later consolidated within a excel file. Trucks carrying returnable containers are always funnelled through the same terminal when outbound.
Inbound logistics process in receiving terminal 2
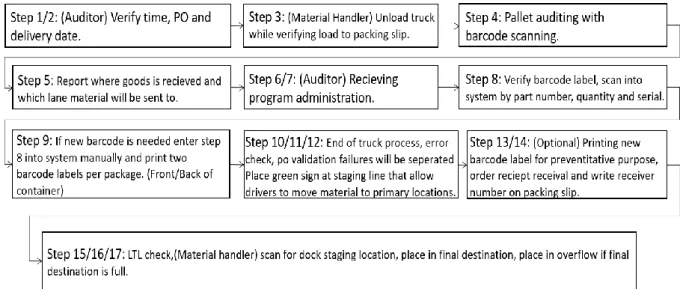
Receiving process of case company is conducted in 17 steps with minor variations depending on the status of wireless scanners, time, material condition, systems and production order details (PO) as illustrated in Figure 9: Pallet receiving instructions and VMI. Pallet receiving is done with at least one auditor and material handler, however production planners can be involved as well if the situation requires it, specifically if items are immediately required to continue production. More than one auditor and material handler can process each shipment, however more than one auditor and material handler per pallet is not allowed. As previously stated, managing returnable containers is not part of receiving terminal 2’s main activities. This is reflected in the work description where disregarding pallet condition, there is to zero mentions of pallet specifics. Due to this, terminal workers have no specific knowledge about what classifies a returnable pallet and what makes them different from standard containers. As illustrated in Figure 9: Pallet receiving instructions and VMI, no additional reporting is done regarding pallet type during receiving. Therefore, it is impossible for supply chain specialist
23
responsible for container management to be aware when returnable containers are returned from suppliers. Close to 90% of all goods received in receiving terminal 2 are located on returnable containers according to the supply chain specialist. Terminal 2 is sized with 5 loading docks.
Figure 9: Pallet receiving instructions and VMI
4.2 Description of returnable container types.
Case company use four types of returnable containers, illustrations of said containers are shown in the appendix.
Type 1 is constructed of hard plastic and is foldable which is 45x48 inches unfolded. This type of container is the most plentiful, 10.000 of the 15.000 returnable containers in property of the case company, and thus the main focus of the study.
Type 2 containers come in two types, with the yellow variants being slightly taller, they are also the organizations oldest type of returnable. They are noted by their plastic sleeves.
Type 3 is noted by their short build and bublex sleeves, the white painted square indicates size, as there are many differing sizes and versions of this type of container.
Type 4 comes in two variants, one with a blue logo and one with an orange logo, the only difference being a slight height difference. The two variants are used for the same type of purpose and therefore share the same SKU. It is unable to be stored outdoors due to its structural weakness to water due to its inner walls being made of cardboard.
4.3 Interview results.
When a material handler was asked about the three questions showcased within Table 1: Case study interviews, the respondent expressed a lack of knowledge regarding said pallets noting that focus is given to transportation of containers to their rightful destination rather than container specifics, which was expressed as being largely the auditors job.
The auditor expressed slight scepticism regarding having additional barcode scanning on returnable containers, main concerns was about the potential of human error due to the need to
24
educate employees regarding pallet specifics. The added lead time was also a concern that might be too much to handle for the current state of receiving terminal 2. As a solution it was suggested by the auditor to allow the suppliers to note what kind of pallet per material are contained on each packing slip, according to respondent this should not be impossible. Reasoning behind this is that it would be fitting to report quantity of returnable containers on the packing slip in addition to all normal details.
The supply chain specialist expressed concern regarding increased lead times with further receiving observations. However, it was expressed that the benefits that with additional receiving administration regarding pallet specifics it is possible to fill information gaps between outbound returnable terminal and receiving terminal 2 which could solve issues.
4.4 Literature examples of returnable container management and
implementation.
Typical problems of container management are: lacking communication feedback from suppliers, lack of liability for missing or destroyed pallets and the physical container inventory. To mend these issues, recommended measures is first to improve communication and information flow within supply chain, which that is an issue that must be addressed before implementing other solutions (Maleki & Reimche, 2011). With liability contracts companies can hold their partners legally liable for lost or damaged pallets, this contract must be discussed with all suppliers and would need to state which party is responsible in certain parts of the supply chain. Integrating identification and tracking systems is one possibility issues with physical container tracking can be handled. By having a satisfactory tracking system one can confirm liability to suppliers or partners, it will allow documentation exactly where damages happened and in whose ownership containers or pallets were lost, additionally it will allow companies to track pallets in circulation and directly track where pallets are located when in demand (Maleki & Reimche, 2011).
Finding suitable tracking technologies
A possible approach for finding appropriate tracking technologies is to firmly establish a work structure that include:
1: ‘’The analysis and documentation of the physical flow and the information flow associated
with the containers’’
2: ‘’the investigation of new technologies to improve the automatic identification and tracking
of containers.’'
Barcode scanning, Passive RFID technology, Active RFID technology and Wi-Fi tagging were main methods investigated. Advantages and disadvantages were noted on each of type of AutoID tracking method and compiled in the end according to Figure 10: Desirable characteristics of AutoID technology (Maleki & Meiser, 2011).
25 Figure 10: Desirable characteristics of AutoID technology
Barcode scanning was found appropriate if management requires (Maleki & Meiser, 2011): • Low implementation cost
• Compatibility with current system • Assigning general locations
• Assigning transit numbers between locations • Being networked with the inventory system
• Requiring an intermediate amount of manual labour for scanning • Passive RFID was found appropriate if management requires: • Medium implementation cost
• Automatic tag reading
• No required manual scanning
• Being integrated with inventory system • No requirement for changing tag batteries • Detecting arrival and departure times
Active RFID scanning was found appropriate if management requires (Maleki & Meiser, 2011): • Automatic tag reading
• No required manual scanning
• Being integrated with inventory system • Longer detection range
• Real time tracking
• Potential and capabilities for future projects
WI-FI scanning was found appropriate if management requires (Maleki & Meiser, 2011): • Automatic tag reading
• No required manual scanning
• Being integrated with inventory system • Longer detection range
• Real time tracking
• Potential and capabilities for future projects • High compatibility with Wi-Fi based electronics
26
RFID tags are widely used to identify contents of pallets but seldom used for localization of pallets, which they have large potential in. One possible approach is to implement a tracking system that is already compatible with already implemented check in systems. Localization by angle of arrival (AOA) and received signal strength (RSS) were suggested in addition to experimentation with standard passive ultra-high frequency (UHF) RFID tags within the warehouse of Jun-ru, Hong-jian, and Hong-liang. Methods used where reference gates were set up on top of shelves with pallets and containers containing tags underneath. With this setup they could visualize exactly what and where specific items were located on said shelves. They found decent success with this method, being able to localize pallets on shelves within a 0.113-meter mean error (Jun-ru, et al, 2015).
Implementation of RFID tracking systems
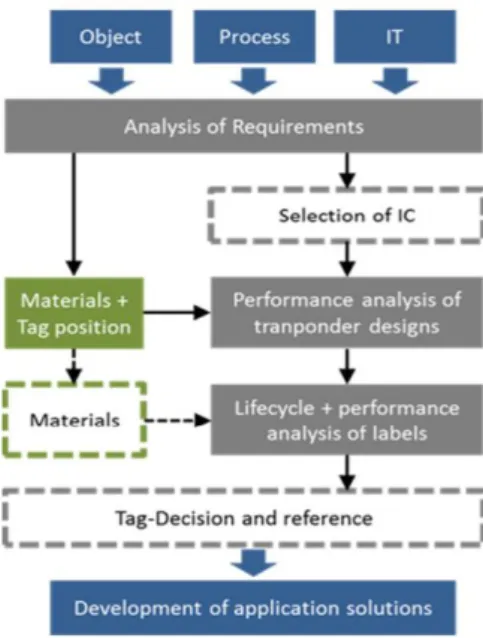
For implementation of RFID systems several requirements need to be fulfilled at three different levels, IT, process and object level as illustrated in Figure 11: Procedure of definitions and laboratory examinations (Kirch, et al., 2017)
By fulfilling requirements at an object level, one need to consider the technical feasibility of which material the RFID tag will be placed on, as the material will affect the transponder effectiveness. On a process level, the way pallets and items go through the supply chain need to be analysed as in some cases need to withstand -20°C to +60°C degrees ranging from refrigerated warehouses, outside in the summer sun to rain and snow. RFID tags will need to withstand all conditions during supply chain cycles and remain fixated to pallet and continue working for the foreseeable future. From an IT perspective what information that going to be stored on RFID tags is critical and how that data will transfer to pre-existing systems and networks. Based on these three factors the choice of RFID components can be pinpointed. All RFID components will need rigorous testing and evaluation such as laboratory measurements to confirm application (Kirch, et al., 2017). As for implementation, costs are expected $0.12 per applied tag in labour costs, additionally the cost for a tag is between $0.2-$3 for passive tags to $20-$150 for active RFID tags. Software and support will roughly cost $150.000 during the first year. RFID readers or gates are considerably more expensive for passive tags than active ones, passive ones usually go from $3.000 to $20.000. Barcodes are generally inexpensive, with fixated metal ones going for $1 each at most (Maleki & Meiser, 2011). Figure 11: Procedure of definitions and laboratory examinations (Kirch, et al., 2017)
27
5 Empirical data analysis
Collected empirical data is analysed through the lens of the theoretical framework to achieve found results. For dispositions sake, chapter is divided into the three research questions.
5.1 How can management, tracking and tracing methods be implemented?
As the case company already report when they ship returnable containers to suppliers providing the supply chain specialist with the ability to be notified when and from whom returnable pallets are received will fill in information gaps. For example, how many containers are currently in the inventory of each supplier, how many returnable containers exist in rotation and how long lead time it took for the pallet to do a cycle through the supply chain. Therefore, the first step to implement management, tracking and tracing methods is to introduce additional administration in receiving.
RFID scanning
Having RFID in receiving terminal 2 will allow for simple receiving administration without increasing lead time and labour cost through the benefits of automation (Frohm, et al., 2016). Introducing RFID systems into the supply chain will allow for additional internal integration and information sharing by immediately reporting information electronically rather than manual methods (Frohlich & Westbrook, 2001). For further information sharing, having a RFID gate by outbound logistics will allow outbound and receiving terminals to interact electronically, removing the need for a material handler to manually report outbound pallet details. If desired, RFID scanning will benefit external integration by sharing stock count based on scanned containers in receiving will give information to suppliers on how many returnable containers are currently available for orders (Chavez, et al., 2015). Additional benefit of RFID systems is futureproofing, for example allowing automatic RFID scanning for standard articles as well eliminating the need for manual scanning. Biggest weakness of RFID methods is the amount of investment required in capital, effort and time (Maleki & Meiser, 2011).
One possible RFID implementation method is showcased by Kirch, Poenicke & Richter in Figure 11: Procedure of definitions and laboratory examinations . Object wise are returnable containers constructed of hard plastic, which will not interfere with RFID signals, however fixability need to be considered for tags on plastic foundations. If hard plastics does not give necessary amount of fixability, it could be solved by fixating a wooden or metal plate which the RFID tag then could be attached to. Considering RFID tags on a process level, containers do not need special handling such as heating or cooling, however containers spend a lot of time outdoors while awaiting shipment to suppliers which might become a risk. South Carolinian weather usually fluxuate between 0°C and 42°C each year, additionally there is hurricane risk in fall and tornado risk during spring. Pallets will require laboratory testing to examine if RFID tags will endure said conditions and if tags do not meet conditions, workarounds like building an outdoor shelter or warehousing space for pallets during the most vulnerable parts of the year. Confirming methods and conditions in which containers are handled within the ownership of suppliers need to be clear before implementation. Data that need to be stored for tracking purposes would most notably be date of receiving and date of departure. While it is possible for more information to be used and used within future projects, date of receiving and departure are the only necessary ones for tracking, tracing and management. If a pallet is scanned for departure it will count as one container less for the warehouse total and one container more for warehouse total if scanned as inbound (Kirch, et al., 2017).