Young Drivers and
Driver Education
How Socioeconomics and Lifestyle are reflected in Driver Education from the Age of 16
eel 0) ) o ms q Ca) q «fud usd & «@a [ hic Hind
Kristian Eliasson, Jan Palmkvist and Hans-Y¥ngve Berg
Swedish National Road and I Transport Research Institute
VTI rapport 404A- 1996
Young Drivers and
Driver Education
How Socioeconomics and Lifestyle are reflected
in Driver Education from the Age of 16
Kristian Eliasson, Jan Palmkvist and Hans-Yngve Berg
Wg ir
533$
Publisher: Publication:
VTI rapport 404A
Published: Project code:
Swedish Readand 1996 20222
'Transport Research Institute
S-581 95 Linkoping Sweden
Project:
Young drivers, aged 17 - Lifestyle and driving Published in english 1997 pracnce
Author: Sponsor:
Kristian Eliasson, Jan Palmkvist and Hans-Yngve Berg Swedish Communications Research Board (KFB)
Title:
YOUNG DRIVERS AND DRIVER EDUCATION - how socio-economics and lifestyle are re ected in driver education from the age of 16
Abstract (background, aims, methods, results) max 200 words:
On 1 September 1993, a new law took effect which permitted instructor supported driving practice from the age of 16. This study describes which persons make use of the new 16-year age limit with reference to socioeconomics and lifestyle.
In the study, the participants were divided into socioeconomic groups (blue-collar and white-collar) and lifestyle groups (oriented towards friends, the surrounding world or parents). The results showed that children in white-collar families acquire a permit for driving practice in more cases than children in blue-collar families. One of the reasons for the latter group not acquiring a permit is that they cannot afford it, while children in white-collar families state that they have neither the desire nor the time.
Driving mileages vary widely between the lifestyle groups. The group oriented towards the surrounding world drives the most. Other factors that encourage the acquisition of a driven practice permit are the possession of several driving licences in the family, the ownership of several cars in the family, living with several adults, driving a car before the age of 16 and friends who have driving practice permits. The study has been conducted at the Swedish Road and Transport Research Institute (VTI), and has been sponsored by the Swedish communications Research Board (KFB).
Keywords: (All of these terms are from the IRRD Thesaurus except those marked with an *.)
ISSN: Language: No. of pages:
Foreword
This study was conducted as part of the KFB (Swedish Communications Research Board) Young Drivers topic and, as such, is part of the research being conducted at VTI (Swedish Road and Transport Research Institute) to gain greater insight into why young people are overrepresented in traffic accidents.
Thanks to Nils Petter Gregersen and Sixten Nolén for interesting discussions during the course of this work.
Thanks to Per-Olof Grummas Granstrom of the Swedish Road Administration s Road User Section for interesting discussions before and after this work was conducted.
We would also like to thank Tom Nilsson, Dept. of Social Sciences, Linkoping University.
The project leader for the study was Hans-Yngve Berg, VTI. Thanks also to Gunilla Sjoberg who compiled the report.
The study was conducted at the Swedish Road and Transport Research Institute (VTI) and financed with funds from the Swedish Communications Research
Board (KFB).
Table of contents
Summary
1
Introduction
1.1 Presentation of the area of investigation 1.1.1 1.1.2 1.1.3 1.2
2.1
2.2
2.3
2.4
2.5
2.6
3.1
3.2
3.3
3.3.1
3.3.2
3.3.3
3.3.4
3.4
3.4.1
3.4.2
3.4.3
4 4.1 4.2 4.3 4.3.1 4.3.2 4.3.3 4.3.4Background to Sweden s decision
Driver training by the old model
The French model
Goals and limitations
Theory
Importance of the driver s license to young people Classification by class
Socioeconomic classification Lifestyle
Social class and lifestyle Statement of the problem
Method
Introduction Selection
Method of measurement Social background factors Lifestyle questions
Prerequisites for driver education Driver training questions
Reliability and validity Reliability Validity
Statistics
Results
Introduction Socioeconomic classification Classification by lifestyleSocioeconomics and lifestyle
Place of residence and lifestyle Family makeup and lifestyle
Gender and lifestyle
VTI rapport 404A
Page
11 11 11 12 13 13 14 14 15 15 17 2O 21 23 23 23 23 24 26 27 27 27 28 28 2930
3O
30
32
34
36
36
36
4.3.5
4.3.6
4.4
4.4.1
4.4.2
4.4.3
4.4.4
4.4.5
4.4.6
5.1
5.2 5.2.1 5.2.2 5.2.3Lifestyle and education
Lifestyle and activities
Driver education questions Learner s permit
Why they do not have a learner s permit
How often they practice driving
How many total hours they have driven privately
Driving lessons at driver training school Other questions related to driving practice
Discussion
Discussion of methods
Discussion of results
Comparison with the old model of driver education Driver education Final comments
References
36
37
38
33
43
44
47
49
50
52
52
52
53
53 55 57YOUNG DRIVERS AND DRIVER EDUCATION - how socioeconomics
and lifestyle are reflected in driver education from the age of 16 years by Kristian Eliasson, Jan Palmkvist and Hans-Yngve Berg
Swedish National Road and Transport Research Institute, VTI SE-581 95 Linkoping SWEDEN
Summary
On 1 September 1993, a new law took effect which permitted instructor supported driving practice from the age of 16 instead of 17 years 6 months. The intention is to enable young people to gain more experience of car driving before they acquire a driving licence and thereby to reduce the accident risk. The purpose of the study was to determine which persons make use of the new 16 year age limit with reference to socioeconomics and lifestyle.
The study was conducted by means of a questionnaire posted to 601 17-year-olds throughout the country. The participants were divided into socioeconomic groups (blue colour and white collar) and lifestyle groups (oriented towards friends, the surrounding world and parents). The results showed that children in white-collar families acquire a permit for driving practice in more cases than children in blue-collar families. One of the reasons for the latter group not acquiring a permit is that they cannot afford it, while children in white collar families state that they have neither the desire nor the time.
Driving mileages vary widely between the lifestyle groups. The group oriented towards the surrounding world drives the most. Other factors that encourage the acquisition of a driving practice permit are the possession of several driving licences in the family, the ownership of several cars in a family, living with several adults, driving a car before the age of 16 and friends who have driving practice permits.
The study has been conducted at the Swedish Road and Transport Research Institute (VTI), and has been sponsored by the Swedish Communications
Research Board (KFB).
1 Introduction
On 1 September 1993 a new law took effect that permitted instructor-supported driving practice from the age of 16. As a result, driving practice can begin at age 16 instead of 17 years and 6 months, as was the case previously. Besides having a learner s permit, the 16 year old must have an instructor with an instructor s certificate that allows the instructor to accompany the 16 year old as the latter practice drives. If the 16 year old chooses to practice drive only at driver training school, then neither a learner s permit nor an instructor s certificate is needed.
From the standpoint of traffic safety, the purpose of the new age limit is to give young people a chance to gain greater experience driving an automobile before they obtain their driver s license. With the new driver education age limit, it is hoped that the well known and extremely high initial risk of accidents among young, new drivers can be reduced.
It is too early to say what effect the 16 year age limit will have on the number
of accidents since, at the time of this writing, there are no recent driver s license
recipients who have utilized the new system of driver education for two years. Consequently, we will not deal with the effect of the new system on driving safety in the present paper. Instead, we will see if there are groups in society that are making extensive use of the new 16 year age limit and, if so, we will discuss what the causes of this might be.
1.1 Presentation of the area of investigation
Below we will present the background to the new system of instructor supported driver education beginning at age 16 and discuss driver education in accordance with the old model (beginning at 17.5 years of age).
1.1.1 Background to Sweden s decision
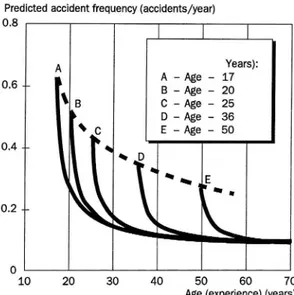
Those who recently received their driver s license are viewed as a high-risk group, particularly the 18 19 year age group [Thulin, 1987]. Some of the discussion surrounding young drivers has taken up the question of whether a totally new driver training system or various additional training programs could reduce the high rate of accidents among young people. Research on why young drivers who recently obtained their license form such a high-accident group presents several explanatory factors. Two of these factors are the drivers experience and their age. American studies, in particular, stress the importance of age. According to Gregersen (1991), this is because the driving age in the United States is frequently quite low (15-16 years) and, in this case, age has a great significance. Spolander (1985), who studied the risk of traffic accidents among Swedish drivers, shows in his study that experience is of greater importance for the risk of accident a driver runs in traffic. Figure 1 shows how experience and age affect the risk of accident.
Predicted accident frequency (accidents/year) 0.8 I | l A Years) A Age - 17 0'6 B Age 2o \ B C Age 25 5 D Age 36 \ c E Age 50 0.4 o.2
10 20 3O 40 50 60 70
Age (experience) (years)
Figure 1 Predicted risk of accident as a function of age at which drivers
obtain their license. (Maycock, 1991).
Without going in detail into the reasons, we can point out that too little driving experience may be seen as a contributing factor to the high accident rate. This causal relationship has given rise to the idea of instructor-supported driver s education beginning at age 16. The hope is that young people will utilize this opportunity to gain greater driving experience before obtaining their driver s license, i.e. that this change in driver training will result in a lower initial risk to young new drivers, once they have taken their pre-license training and go out into traf c on their own.
1.1.2 Driver training by the old model
In a study on the old model of driver education, Spolander (1985) shows that there are two main groups that teach young people to drive: parents and driving
instructors. Others, such as brothers and sisters, friends, acquaintances, etc., are
less frequently involved. His study shows that half the young people had their parents as one of their teachers and 15% had their parents as their only teacher. Further, one third had a driving instructor as their only teacher. Spolander s main purpose, however, was to study how drivers experienced their training and the test. Thus, there is no data in the study indicating if and how various groups of young people differ from one another with regard to their driver education .
It is also common, according to Spolander, for private driving practice to occur in conjunction with errands and leisure trips, i.e. often not at specially appointed times for driving practice. Private driving practice occurs once or twice a week, the same as driving at a driver training school. The number of lessons before obtaining a license is usually 13 to 16 at driver training school and 10 to 15 with private sessions [Spolander 1985].
1.1.3 The French model
Instructor-supported driving practice beginning at age 16 was introduced in France on a trial basis in 1982. Initially, this was done to a very limited extent, but beginning in 1988 the system was implemented throughout the country [Heggda1, 1993]. A scientific study of the system began at the University of Toulouse, but so far no results have been published. One source there said that the accident frequ-ency among young drivers dropped by 70 % [Gregersen, 1991]. The results of this study are under discussion, however. In particular, the methodology had some shortcomings, so that a cautious interpretation may be in order. The French model differs somewhat from the Swedish one. The greatest difference is that in France it is obligatory that the first phase of driver education occurs at a driver training school. Otherwise, the models are quite similar and they are based to a great extent on the possibility of extensive driving with a private instructor.
1.2 Goals and limitations
One prerequisite for reducing accidents among young drivers by having a lower age limit is that as many as possible be able to utilize the new system. Thus, it is of interest to learn who is using it. Consequently, our purpose is to see which different groups of young people begin practice driving and to try to determine the extent to which they are utilizing the chance to practice driving.
We will limit our study to those who are at least 17 years of age. At the time of the study, they had had an opportunity to practice driving for about 13 months.
2 Theory
Continuing the process, we will consider what significance a driver s license may have for young people, apart from permission to drive a car. We will then examine the concepts of social class and lifestyle and the possibility of studying young people from the standpoint of these concepts.
2.1 Importance of the driver s license to young people
If a young person obtains a license to drive automobiles at age 18, it comes during a transition period in which many other things are happening. They are finishing school, perhaps moving away from home, performing military service, getting a job, or deciding on additional education, etc.
Just as moving away from home is not just a practical solution to a problem of finances or insufficient space, but also a way of testing one s wings or demonstra-ting independence vis-a-vis one s parents and others, the driver s license can have similar symbolic importance.
Mitterauer (1991) discusses important symbolic events in the transition of youth to adulthood. He calls these events caesura of youth, i.e. a kind of gradual change in status from the world of youth to the world of adults. Thus, he believes the obtaining a driver s license is one such caesura for young people, both in their eyes and in the eyes of others. Other caesurae may be gaining sexual experience, going and coming when one chooses, finishing job training, moving away from home, etc. Mitterauer also believes the driver s license car ownership are not simply a practical means of transportation that becomes available, but they also symbolize progress, independence, and freedom of movement on their path toward adulthood. He writes:
For today s young people, obtaining a driver s license is a more important initiation rite than coming of age or obtaining the right
to vote. [Mitterauer, 1991, p. 58]
Andersson (1987) also discusses the importance of the driver s license to young people s entry into the adult world. He believes that for young people, the driver s license is a large step toward independence and self-reliance vis-a-vis their parents. With a driver s license, the young person is no longer dependent on public transportation or parental good will in order to get around.
Even though Andersson s work was published eight years ago, his ideas are still relevant when he says that in times of unemployment the driver s license is an even more important symbol of adult status. Young people are forced to remain in the world of youth, since they cannot get a job and their own living quarters. Instead, they continue studying and living at home with their parents. Thus, according to Andersson, young people are greatly enthusiastic about obtaining their driver s license and other symbols of adult status.
In their discussions, both Mitterauer and Andersson stress the significance of the driver s license in the transition from juvenile to adult life. Thus, obtaining a driver s license takes on symbolic content for many young people. In this case, the driver s license is important not only because it grants permission to drive a car
independently and offers a means of identification, but it also serves as a visible
symbol of who one is and what one is. Thus, it seems reasonable that many young
people see the driver s license as a symbol of a more independent and adult position vis-a-vis parents and friends.
2.2 Classification by class
According to Giddens (1994), class is the type of social stratification that exists in modern Western society. He defines social stratification as a structural inequality among people and distinguishes four different stratification systems: slavery,
caste, estate, and class. As stated, the latter is characteristic of our type of society,
while slavery, caste, and estate belong elsewhere, geographically and historically. The term class differs from the other three systems of stratification in that social mobility is possible both upward and downward between classes. Unlike the other three stratification systems, class affiliation is in part acquired, not simply
inherited. Moreover, class boundaries are not as sharp as boundaries in the other
systems. According to Giddens, differences that exist between classes are often
dependent on economic differences such as capital, ownership, and control over
the means of production, which creates differences in wages and working
condi-tions. According to Giddens, it is these differences that lead to structural
inequality among various groups of people in Western society.
In Marx s classification according to class, it is the relationship to the means of production that is crucial. Marx divides society into three classes: wage laborers, capitalists, and land owners. This classification was made in the late 19th century and is still applicable on a societal level. However, the link on the individual level is no longer as clear as it was a hundred years ago. Examples of this are the enormous growth of the white collar sector and the increase in administrative professions [Ahrne, 1985].
Unlike Marx, Weber s classification by class is not dependent solely on control
or lack of control over the means of production, but it also includes economic factors that are not directly related to ownership, such as the education, skills, and
qualifications a person has when he or she looks for a job [Giddens, 1994].
The social class structure described by Marx and Weber is based primarily on antagonisms between social classes that arise in the struggle to gain control over capital and production. Since this goal cannot be achieved by everyone, this struggle leads to con ict [Giddens, 1994].
When making a classification according to class, it is important that the classes
re ect actual conditions. Dividing people into social groups or classes can certainly be an easy way to sort people for a sociological analysis, but the division is irrelevant if it has no counterpart in reality. Thus, it is important how the classes are defined and how an individual is assigned to a class. In other words, we may say that a class concept attempts to describe and identify basic conditions among a large group of people [Ahrne, 1985]. The question then is what do we define as basic conditions? Ahrne writes that these conditions must first have significance to the individuals included in the group and, secondly, they must have important relationships to the economic and material structure of society. In this way, class becomes a link between society and the individual.
2.3 Socioeconomic classification
During the first half of the 20th century, Swedish statistics utilized various categories of class and socioeconomic divisions. The classification most often
used was a division of the populace into three groups according to occupation, i.e. the well-known division into social groups I, II, and III.
This division was created in 1911 and one problem with this classification is that the criteria for classification are unclear. During the 1950 s the SCB (Swedish Central Bureau of Statistics) stopped using the social classification and went over to a socioeconomic classification based, instead, on an internationally recognized
classification of occupations. This classification was criticized and, as a result, it
was little used. Not having a good, common classification system created prob-lems for determining how well political goals were being achieved, but social-science research also had difficulties correlating results from individual studies with social descriptions of the populace. This was because different studies used different classifications.
In the early 1980 s, the SCB invested considerable resources in developing a new classification and it is a variation of this classification system that we used and that we present below.
Like previous classification systems, this one uses an individual s occupation. The classification is an attempt to collect in each category persons with similar occupations that result in similar situations on the job and on the labor market.
The classification also makes it possible to distinguish between blue collar and white collar workers. The occupational classification is dependent on several criteria. Both blue collar and white-collar occupations are classified according to the number of years of training normally required for the occupation. The expec-ted level of qualification is assumed to determine the position in the organiza tional hierarchy a person tends to assume. Consequently, a person is assumed to have greater control over his or her working situation. Because it encompasses both the position and the qualifications a person has, this classification system is seen as a combination of the theories of Marx and Weber.
With the help of Ahrnes discussion above, the classification system can be seen as a classification that attempts to capture basic differences between various social milieus, i.e. it involves aperson s daily life. It is also assumed that, to a certain extent, the classification re ects economic differences among the incomes of the various groups.
The classification is often used to study how well political goals are achieved,
but it is also useful in social science research, since many issues there deal with
relations among social classes. The system is also suited to studying the distribu-tion of prosperity, opportunities in life, and differential behavior. However, the classification captures only the basic differences. The accent is on a person s more permanent relationship toward his or her working life. Thus, a person who nor-mally does not work, but who is working temporarily is classified as unemployed. Gainful employment is delineated at 16 hours per week. In its complete form, the classification has 16 different socioeconomic groups, but this can be reduced, for example, to a six degree scale. The reduction is determined by what is being studied [MIS, 1982].
In studies involving young people, it may be desirable to know the socioeco-nomic group to which their parents household belong. Classification by household then becomes an individual classification, i.e. the household s socio economic code applies to the young person, not to the household [MIS, 1982].
2.4 Lifestyle
In post-modernist theories of lifestyle there are three concepts that may be seen as complementing one another, namely form of life, lifestyle, and style. These three concepts are quite unstable and uid. It may be said that form of life has been given a broader meaning than lifestyle which, in turn, is broader than style. To describe or analyze basic differences in living conditions, perspective on life,
and social praxis, among various social classes, strata, or groups, the term form of
life is often used. The concept of lifestyle is most often used to delimit basic
values, interests, free time, or consumption. Finally, style is used to describe expressive expressions, signs, symbols, or artifacts that a special social group, subculture, or culture uses. There are also no absolute boundaries between the
aspects of reality to which the concepts refer [Lundgren, 1992].
The term lifestyle is used in various research contexts to describe people s attitudes, values, value judgments, opinions, and behavior. Thus, lifestyle is a term that emphasizes the social and cultural aspects of a person s life [Miegel, 1990]. According to Andreasen s (1967) definition, the term lifestyle can be used to describe an individual as well as a group of people.
In many articles and reports in the behavioral sciences, the term lifestyle is often vaguely defined. In market surveys, the term is often used to mean consump-tion patterns. In medical research it is used to mean a way of living that is injurious or pathological in some way or another. In studies on social life the term lifestyle is used to study gender related roles, social mobility, etc. Most lifestyle studies assume that, in one way or another, lifestyle is an expression of overall
individual values [Miegel, 1992].
Another frequently cited basic assumption in various lifestyle theories is that lifestyle is based on the individual s need to indicate his or her social affiliation or status. Consequently, lifestyles are often distinguished based on consumption,
taste, and preferences in various areas [Berg, 1993].
In Andersson s study on Gothenburg youth of the sixties [Andersson, 1969], he looks at how they relate to their friends and to adults. Depending on which of these relations are given higher priority, he divides the young people into
friend-oriented and parent friend-oriented [Andersson, 1982]. Of course, the classification does
not always apply, since the young people can be oriented toward different groups, depending on the situation. Nevertheless, he believes the choice has certain syste matic aspects, in that those who choose the friend-alternative in one case often choose the same alternative in other cases, as well. The same holds for the
parent-alternative [Andersson, Wallin, 1971]. Even though Andersson does not use the
term lifestyle, to describe the groups, his group classification is reminiscent of the lifestyle classification made by Hermansson (1988) in his study.
Hermansson believes the term lifestyle refers to people s actions. The material culture can be seen as a result of these actions and the spiritual culture can be seen as both the framework that determines these actions and a result of these actions [Hermansson, 1988 from Berg, 1994].
In contrast to Hermansson, who concentrates on deep, lasting cultures that follow the individual throughout life, we have Ziehe s concept of lifestyle. He believes lifestyle changes are a part of our modern society and that young people are sensitive to changes in their choice of a lifestyle. Ziehe believes the individual passes through a lifelong socialization process and the choice of various lifestyles
through the socialization process is an important part of life. The lifestyle we have is dependent on the life situation in which we find ourselves at the moment [Loov
and Miegel, 1989].
Thunberg et al. [1982:61, from LoOV and Miegel, 1989] believe human
pheno-mena can be studied at three levels: the structural level, the positional level, and
the individual level.
Structural level: studies on various parts of the world, countries, religions, etc.
Positional level: studies on various classes, men-women, age, i.e. differences
among large groups within a given social structure.
Individual level: studies on how individuals see their reality, how they live their
lives, relationships, etc. This level could be called lifestyles.
Loov and Miegel (1989) call the level a researcher decides to analyze the level of determination. Loov and Miegel believe there are two levels in lifestyle studies, namely the micro and the macro levels. On the macro level, lifestyles are studied in the form of ideal types and they are abstract and theoretical construc tions containing a number of characteristics within the culture under investigation.
If lifestyles are studied on the micro level, it involves individuals themselves and
each individual s unique social and cultural relationships are examined.
The arguments of Loov and Miegel may be summarized as shown in the following figure:
Macro Micro
Structural Ways of living Level of determina- Positional Forms of life -tion
Individual Ideal Type Individual Lifestyle Lifestyle
FigureZ Term to be used, depending on which level of analysis and discovery has been chosen [Léav and Miegel, 1989, page 5].
Hermansson s concept of lifestyle differs from the concept of style, which is often used in studies of youth culture. His concept of lifestyle is not based on
attri-butes and products, such as hairstyle or taste in music, but rather concentrates on
basic differences in the daily lives of young people. Thus, according to Hermansson, a hip-hopper and a hard rocker may be said to have the same
life-style, since both are oriented toward their group of friends. Moreover, he states
that lifestyle differs somewhat between working class and middle class. Conse quently, we may say that his concept of lifestyle has little in common with forms of life, since it takes social class into account. Using this argument, we may say that Hermansson s concept of lifestyle is on the positional level, i.e. his idea of lifestyle is somewhat broader than that usually found in lifestyle studies.
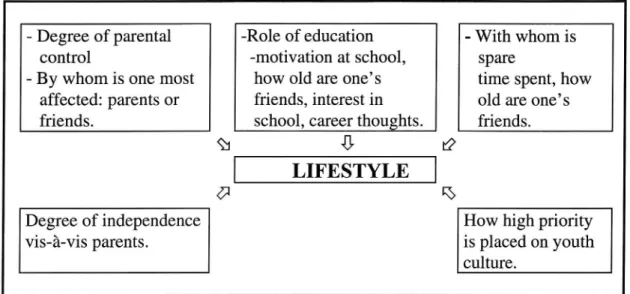
In interviews with Eskilstuna youth, Hermansson (1988), it is the basic diffe
rences in the everyday lives of the young people that form a basis for the lifestyle classification. Hermansson used an analytical template to produce these lifestyle groups. The template is presented below and includes five groups of information
(figure 3).
- Degree of parental -Role of education - With whom is control motivation at school, spare
By whom is one most how old are one s time spent, how affected: parents or friends, interest in old are one s friends. school, career thoughts. friends.
Q1 5 t?
LIFESTYLE
5' 1%
Degree of independence How high priority
vis a-vis parents. is placed on youth
culture.
Figure 3 Hermansson s analytical template for classification of lifestyles [from Hermansson, 1988, pp. 142-143].
Hermansson found that some young people stressed their relationship with their parents, while others talked more about contacts with their friends. He saw this as an expression of two different lifestyles among young people: parent-oriented and friend-oriented lifestyles. Continuing his analysis, he found a third category that stressed both parents and friends. Hermansson viewed this third group as a variant of the parent-oriented lifestyle. He describes this third group as being oriented toward the surrounding world. Characteristics of the three groups are presented below.
Parent oriented youth come most often from a middle-class background. They stress the importance of family life and their thoughts are concentrated around issues involving the home. Life with their parents is not con ict free, but they try nevertheless to please their parents. Demands for independence are toned down and they View their subordinate position with respect to their parents as the natural order of things. They often experience con ict between their friends and their parents. Their network of contacts is limited outside the family and contact with their friends often occurs in the home environment. School work is an important part of daily life for these young people. They devote considerable time to their studies and have career ambitions that are aimed at the professions or positions held by their parents. They often share their free time activities with their parents and they prioritize activities that can be done with them, such as TV watching. Compared to the other groups, they are not as easily in uenced by the symbols and fashions of the youth culture. Parent-oriented young people are characterized
by restraint, caution, and traditionalism.
Friend-oriented young people are predominantly from blue-collar environ-ments. Relations with friends are more important than life with their parents. They have little motivation in school and spend little time on their studies. They usually seek training and courses of study that are practical in nature and they see their future occupational life as self-fulfillment. If they continue their studies, they usually do so because of the risk of unemployment. These youth do not necessarily
follow in the footsteps of their parents. They often hang out with a group of friends of the same age and usually do so outside the home. They stress their independence from their parents and react strongly against parental authority, which they see as working against their desire to be seen as adults. One expression of this may be a desire to have their own independent finances. Thus, people in this group often hold an extra job. Friend-oriented young people are often well-acquainted with the language and rules of youth culture. They also leave home earlier than members of the other lifestyle groups.
Hermansson sees the surrounding world oriented young people as a variant of the parent-oriented group. Most in this group are from the middle class. Relations with their parents are characterized by dialog rather than con ict. The type of activity determines with whom the young person interacts. Surrounding world oriented young people interact alternately with friends and parents or other adults and this does not lead to con ict situations. Their free time is often organized at clubs. This group is generally occupation and career oriented. Education is often given high priority and is seen as a means of self-fulfillment. Young people in this group usually plan their future in a goal-oriented manner so that their choice of education varies depending on what currently seems to give them the best career possibilities. Their strategic planning of the future also affects areas outside education. They have individualistic ambitions of making a career.
2.5 Social class and lifestyle
The job situation, which is at the foundation of socioeconomic class distinctions can determine a person s living habits through a number of factors, such as
in-come, place of residence, free time habits, knowledge, type of work, etc. [Ahrne,
1985]. This means that the living patterns one has are related to the social class to which one belongs. In addition to class position, Ahrne believes age and gender also determine the living patters an individual develops. Age and gender, for their part, can also affect the class position a person has.
Ahrne sees two perspectives on life, based on the combination of age and class position. One he calls career perspective and it is typical of high-level white-collar workers and business executives. He calls the other wear-and tear perspec-tive and it is found primarily among the working class. He describes these pers-pectives as ways of related to production. With the career perspective, a person has a chance to advance through the hierarchy. This possibility increases with age.
The opposite, i.e. the wear-and-tear perspective, means that the workers value on
the labor market diminishes with increasing age. Thus, Ahrne assumes that a rela tively strong relationship should exist between lifestyle, class, and age. Con-sequently, instead of using the concept of lifestyle as an alternative to that of class, he believes it should be a complement in analyzing how class position in uences people s lives and behavior.
In his above-mentioned study, Hermansson (1988) also presented a class-based classification. To be sure, he points out that in a study on young people it is
difficult to place them in various classes. This is because, by definition, the class
of young people is determined by the class position of their parents and does not consider their own experiences of work and any positions they may have held in
the world around them. Nevertheless, he believes that there is a link between the parents class position and the child s lifestyle, in that most middle class children
stress family life, while working class youth emphasize interaction with their friends. He interprets this to mean that there is a lifestyle difference that is based on social class.
Thus, Hermansson bases his class-based classification on the occupations of the parents. He considers young people whose parents are employed in traditional working class occupations such as trades, transportation, and production, but also those in subordinate positions in the public and private sectors to be working class youth. Under middle class, he includes those whose parents work in the private and public sectors in administrative positions or who hold skilled jobs as office workers or care providers.
Like Ahrne, Hermansson discusses the question of whether lifestyle can be seen as separate from social class. He believes that people s actions, which can be defined within a lifestyle, are related to their social position and social rela tionships. Thus, he also sees the concept of lifestyle as a complement to the con-cept of class. In his study, he also found that the various lifestyles were linked to the social class of the parents.
2.6 Statement of the problem
In our examination of the background and theory, we have discussed the reason
for the new driver education age limit and how driver education was structured under the old model. Moreover, we have discussed arguments on the symbolic sig-nificance of the driver s license to young people. The emphasis here is on the driver s license as proof of adult status, i.e. a step by young people toward be coming more independent vis a-vis their parents. At the same time, driving practice is a situation that demands cooperation with parents, since they often serve as instructors. A stronger relationship with one s parents and a strong desire for independence may be seen as contradictory, but both may be assumed to in-crease both the opportunity and desire to begin practice driving.
The question is whether young people s social situation with regard to friends and parents in uences their practice driving. In our attempt to answer this ques-tion, we will study driving practice habits on the basis of Hermansson s concept of lifestyle since, to a great extent, it deals with relationships between youth and parents, where friend-oriented young people can represent those who set a high priority on interaction with friends and the parent-oriented ones can represent the group that is most closely linked to their parents. The surrounding world oriented group will represent those who interact alternately with friends and parents. They are somewhat more individualistic than the other groups.
We have pointed out that obtaining a driver s license can be seen as a choice for young people. In other studies on young people s choice of high school, leisure
time habits, consumption habits, etc., there is often a link with the class position
of their parents.1 Consequently, we will see if there is a social background factor, as in these other studies, that affects young people s choice concerning driver training. In the matter of driver training, there can also be material differences between social groups in society that move young people to begin driver training or not. It may depend on how many cars the family has, how many are available to act as instructor, etc. In addition, the cost of a permit and for driver training could give rise to differences between social classes. This is not just a matter of whether
1 See, for example, Asemar, 1985, Czaplicka & Ekerwald, 1986.
or not a young person has a permit, but also how often he or she is able to drive.
As a measure of class affiliation, we have selected the socioeconomic classifica
tion, since it makes possible a class categorization of young people based on the socioeconomic position of their parents household.
The concepts of social class and lifestyle are not separate from each other, but
are linked, according to Hermansson and Ahrne, in that a certain social class pre
ferentially has a certain type of lifestyle. This is because conditions at the parents work place, with respect to both position and relationships, in uences their attitudes off the job, as well, for example their living habits and living patterns.
The argument we are presented may be depicted schematically as in the following model.
SOCIOECONOMICS &
o Learner's permit ~|¢ 0 Amount of driving
LIFESTYLE z
The main questions we would like to answer in this study are if and how lifestyle and socioeconomics in uence:
whether or not a young person has a learner s permit and if not, why;
how often a learner drives with a private individual as instructor and how many
total hours the learner has driver;
whether a learner drives at a driver training school and, if so, how many total
hours.
In addition, we have chosen to study the question of inclination to obtain a learner s permit based on the following factors:
gender;
family composition;
residence in rural or populated area;
how many cars in the family;
how many with driver s license in the family; whether or not the person drove before age 16;
whether the person has friends with a driver s license or learner s permit.
3 Method
3.1 Introduction
At an early stage of our work, we brought together six young people of the age group in question for a discussion. The idea was to discuss» not only questions of practice driving, but also general issues in the everyday lives of the young people and their friends. In this way, we gained an initial picture of the target group. We asked what they though could in uence and motivate young people to obtain a learner s permit or not. They made no distinctions among various youth cultures, but stressed the importance of the family. Their views dealt mostly with material conditions, differences in family composition, etc. This was a contributing factor to our later choice of Hermansson s lifestyle concept as a basis for our study, since it goes beyond differences in details, such as youth cultures, and is based instead on general differences in the everyday lives of young people.
3.2 Selection
The study was conducted using a mailed questionnaire that was sent in September 1994 to a random selection of 601 seventeen year olds (born in October 1977) throughout the country. The selection was purchased from SPAR (coordinated personal and address file), which is a registry of all persons who are registered with the population registry in Sweden, have a tax card, or are registered with a social insurance office.
The young people who received the questionnaire had had an opportunity to utilize the new driver education system for over a year, 13 months to be precise. The questionnaire and two reminders were sent out during the fall of 1994.
After the third mailing, we had received 392 responses, giving a response frequency of 65 %. Ten of these were discarded (blank questionnaires). No non-response analysis was performed.
According to a report sent from the National Road Administration to the
Transportation and Communication Ministry, ca. 115,000 learner s permits were
issued between 1 September 1993 mid-November 1994. If we divide this by the number who were qualified to obtain a learner s permit during this period,2 we find that about 60 % of the young people had obtained a permit.
Calculations showed that 60 % of those who responded had a learner s permit. Consequently, we believe the results can be generalized to include all 17 year olds in Sweden. Moreover, the percentage of permits and the distribution of the respon-dents over socioeconomic groups was in close agreement with the available sta tistics for these categories.
3.3 Method of measurement
The data were gathered using mailed questionnaires. The questionnaire method was used in order to assure statistical reliability. A study based on interviews would have been far too extensive and time-consuming. It would probably have been possible to penetrate deeper into the lifestyles of the young people had we
2 Young people of two ages in the age group in question, ca. 197,000 people (SCB Population
Statistics, 1993).
used interviews, but we believed it was unnecessary to reach such depths, since
we were interested only in a rather rough classification of their lifestyles. The questionnaire was designed to obtain data in four areas:
1. Social background factors: mainly father s and mother s occupation, in order to classify the household in accordance with the socioeconomic classification (SE1) system, but also information on the population of their place of residence,
family composition, etc.
2. The young people s lifestyle: the emphasis is on relationships with their parents
and friends, but information on their attitude toward education was also in
cluded, so they could be classified in accordance with Hermansson s lifestyle
categories: friend oriented, surrounding world-oriented, or parent-oriented. We
used Hermansson s analytical template (chapter 2.4, figure 3) for this purpose. 3. Other conditions that may in uence their opportunity and desire to practice
driving, such as car availability, number of driver s licenses in the family, whether or not their friends have a learner s permit, etc.
4. Whether the young people have their learner s permit and, if so, how much driving practice they have done.
3.3.1 Social background factors
Since members of the study group seldom have an income of their own and still mainly live at home with their parents, we looked for a way to categorize the
individuals by some class distinction. Socioeconomic classification (SE1) gave us
a way to classify a household s socioeconomics.
A household s socioeconomic status was obtained by encoding both parents
occupations in accordance with the standard encoding of M18 (19824). The
socioeconomic position of the household was then taken to be the higher value of the spouses. For those who are interested, Appendix C (in the swedish report (VTI report 404) describes how households are classified.
We used the 12-level scale to classify the socioeconomic status of the parents
(see table 1).
Table I
BLUE COLLAR WHITE COLLAR
SEI- Title Example of SEI Title Example of
code occupation code occupation
11 Unskillled Sawmill 36 Low salaried Policeman worker worker employee 2 Payroll assistant Producer of Spot welder Driving instruc
goods Textile worker tor
12 Unskilled Store clerk 46 Mid-level Midwife worker Truck driver salaried Elektrical engi Provider of Care provider employee neer
services Personnel
manager 21 Skilled worker Electrician 56 High level Bank manager
Producer of Auto mechanic salaried Trained social
goods Baker employee worker
Physician 22 Skilled worker Hairdresser 57 High-level CEO
Provider of Locomotive salaried Local gov t services engineer employee in commissioner
Assistant nurse leadership Principal position
33 Low salaried Office worker 60 Academic Psychologist employee 1 Watchman professional (self-employed)
Tour guide Lawyer (self
employed) Data consultant (self-employed) 79 Entrepreneur Store owner
Contractor Landlord 89 Agricultural Farmer
worker Forestry worker Fur farmer As seen in the table, we are dividing the households into blue-collar and white collar households. Instead of using. For the sake of brevity, instead of using the terms young people from blue-collar households and young people from white collar households, we will call the young people themselves blue-collar and collar workers (see chapter 2.3). The line delineating blue-collar and
white-collar may be debatable. Initially, we drew the line between 36 and 46, i.e. be
tween lower salaried employees II and mid-level salaried employees. However, when we took a closer look at the occupations under salaried employees II, we de cided to draw the line between 33 and 36, i.e. between lower salaried employees I and lower salaried employees II. The reason for this was the lower salaried employees 11 contains some occupations that require college-level training, such as
police officer and others. It is not our goal, however, to determine where the line should be.
3.3.2 Lifestyle questions
Since Hermansson (1988) categorized individuals in various lifestyle using materials from interviews, we had no ready method of formulating our lifestyle questions. Consequently, we constructed questions on the basis of his description of the three groups. We also took some questions from Andersson (1969).
Later, when the responses came in, we found that many of these questions did not measure that which was intended. For example, the response frequency of some questions had an uneven distribution and in some cases we found it difficult to evaluate the alternative responses from the standpoint of our lifestyle determi-nation. We deleted these questions and the 17 questions that remained3 were used to measure the degree of parent and friend-orientation.
Standardization
The variables were arranged such that the parent oriented alternative always yielded the greatest number of points and the friend-oriented alternative always gave the least points. Then the variables were standardized. Standardization is used in behavioral sciences to allow comparison of many different variables, such
as age, level of education, attitudes, etc. A standardized variable has two impor
tant qualities: the variable has a mean value of zero and the standard deviation is 1. The variables were then summed together so that each individual received a final total. The dispersion of the final totals after standardization was found to be between -4 and 3. The higher this figure, the more parent-oriented the individual is. The friend-oriented individuals have a low final total and the surrounding world-oriented ones are between these groups.
Cluster analysis
We used cluster analysis to divide the individuals into the various lifestyles. A cluster is a property that can be described on the basis of its internal cohesion and its external isolation from something else [Cormack, 1971 and Gordon, 1980, from Everitt, 1993]. We used cluster analysis to produce the three most homogeneous groups, i.e. we drew the boundaries between groups. The group with the lowest mean value was called friend-oriented and the one with the highest mean value was called parent oriented. We chose to place the surrounding world-oriented group as an intermediate group.
Other possible classifications were discussed and tested. The first method we tried was simply to divide the individuals into three groups of equal size. Individuals who had a final total for the 17 lifestyle questions under the 33rd per-centile were placed in the friend-oriented group and individuals with a final total over the 66th percentile were placed in the parent oriented group. The surrounding world oriented group comprised those with a final total between the 33rd and the 66th percentiles. The discussions we had on this method of classification dealt with whether or not boundaries can be drawn in this manner. What is to say that
3 Questions 17, 18, 20, 22, 26, 29, 49*, 50*, 56*, 57*, 59*, 60*, 65*, 76*, 78*, 81*, 82*. *=activity list on the last page of the questionnaire. These questions are unnumbered in the questionnaire.
there must be equal numbers of individuals in the various lifestyle categories? Another method of drawing the boundaries was to look at the 17 questions and draw up criteria for what the final total must be to get in a particular lifestyle group. We noticed that this would be an impossible task, since the combinations of responses to 17 questions are too numerous. As a result, we chose to cluster the three groups, i.e. to let the computer determine the most homogeneous groups. 3.3.3 Prerequisites for driver education
Includes other variable that could conceivably affect the possibility of practice driving.
3.3.4 Driver training questions
A large portion of the driver training questions were taken from questionnaires at
VTI.4
3.4 Reliability and validity
It is important to consider reliability, validity, and generalizability in any study. We have already discussed generalizability. In this section we will attempt to describe what reliability and validity mean.
The reliability of a measuring instrument should be tested before the instrument is used. For a measuring instrument to be reliable, it should give a measured value that is as close as possible to the actual value. This is seldom a problem in research in the natural sciences, since it is easy for the researcher to determine which measuring instrument to use and the measuring instrument can also be tested by repeated measurements [Carlsson, 1990].
However, research in the behavioral sciences seldom have much use for the
measuring instruments of natural science. Variables such as intelligence, attitudes, and motivation cannot be measured directly, but must be measured indirectly by measuring behavior that is believed to express these variables. Patel and Tebelius
(1987) believe that since researchers in the behavioral sciences often must
con-struct their measuring instruments themselves, it is obviously problem fora researchers to know what actually is being measured and how certain their mea-surements are.
There are several types of errors that may arise in behavioral science studies.
Kinnear and Taylor (1991) indicate what they believe to be the five most common
sources of error.
1).The mood, health, degree offatigue, etc. of the respondents and other short-lived personal realities the respondent experiences at the time can affect the results of the measurement. We do not believe this has any significant impact on our questionnaire study. Not all respondents are sick at the same time.
2).The environment where the measurement is made can a ect the measured results. We are unable to say anything about the environment in which the measurements are made, since we do not know where the respondents were when they wrote their responses. We can assume, however, that most were in
4 Unpublished questionnaires from previous studies.
their home environment, which can be assumed to be a good, quiet environ-ment in which to answer a questionnaire. There is a risk, however, that parents
and siblings could affect the respondents choice of response.
3).H0w data are collected, i.e. variations in the data collection method (telephone, interviews by mail, etc.) can in uence the measured results. We had no varia-tions in our data gathering method.
4).Desz'gn 0fthe measuring instrument (ambiguities in questions, degree of diffi-culty, respondents ability to answer the questions, etc.) can affect the measured results. There may be certain problems involved in using a questionnaire to study lifestyles. It is difficult to know whether or not the questions measure that which is intended. The question may be asked improperly or misunderstood by the respondent. There is greater opportunity in an interview situation to avoid possible misunderstandings and to get to the bottom of certain responses by asking the question from another angle, if it is noted that the person being inter-viewed does not respond to the intended question. The questionnaire contains questions that require the respondent to ask their parents. This may explain part of the relatively high non response rate. Their parents may not be at home at the time or they may not have time, etc., making the questionnaire appear diffi cult and be put aside and forgotten. The questionnaire itself may have been a bit too long and may have appeared demanding to answer. The respondent may have thought he/she would have to devote too much time to answering the questions.
5).Err0rs made when measurement results are analyzed (coding errors, improper method of analysis, etc.) can affect the results of the study. The chance of a coding error may be considered quite small, since we monitoring the encoding process and double checked it. With regard to the method of analysis, we used the chi-square test and the measure of association.
3.4.1 Reliability
The term reliability refers to how well the measuring instrument resists various random in uences, i.e. how dependable the measuring instrument is and how
reli-able its results are [Patel and Tebelius, 1987, Carlsson, 1990]. The number of
errors in the measured results defines the reliability: the greater the number of errors, the lower the reliability of the measured values [Kerlinger, 1986].
With regard to our classification of lifestyles, it resists random in uences well, since it is based on an index of many questions and, consequently, it is not signi ficantly in uenced by false answers.
3.4.2 Validity
The term validity means how well the measuring instrument actually measures the quantity it is intended to measure [Bystrom, 1985].
Since there are three of us writing this report, we were able to discuss the all the questions, one at a time. We are confident that we were able to ask the proper questions. We have not relied on some expert s judgment in the area, although several of the lifestyle questions were taken from earlier studies. Some of the
questions we intended to use in the lifestyle section were deleted. This was because there was too uneven a distribution in the responses, i.e. almost everyone answered the same way. Of the 17 questions that were used in the lifestyle grouping, there may be some question as to what some of the questions actually measure. For example, if the hypothetical question were asked, Who in uences you mostwhen you buy clothes, the answer could express a desire to be or act in a certain manner. As a result, the question may not measure who actually in u-ences the respondent, which was the purpose of the question. With regard to life-style classification in general, it may be debatable whether our surrounding world-oriented group is what Hermansson defines as surrounding world-world-oriented. We see from the lifestyle profiles (pages 24-26 [in original]) that it agrees on certain points. Among other things, they interact alternately with friends and parents. On the other hand, our surrounding world-oriented group does not seem to be as devoted to their studies as Hermansson describes. This could be because our questions are measured on a two-dimensional scale, where the alternatives go from parent-oriented to friend oriented. We do not have questions that would delineate the surrounding world-oriented group more precisely, but we believe it still bears a strong resemblance to what Hermansson describes. Our study was performed on a national average, while Hermansson based his qualitative study on a rather small number of persons in Eskilstuna. Consequently, Hermansson s results cannot be interpreted as statistically generalizable over the entire country. His study was also performed 10 years ago. Thus, the difference between Hermansson s study and ours could be due to differences in selection and method and to changes in society.
3.4.3 Statistics
The section on results indicates frequencies and cross tabulations between ques-tions with comments. Certain results are also shown in tables or figures. When two or more variables are compared, a significance test is performed using chi square (x2). On the nominal level, phi ((1)) is used as the measure of association and on the ordinal level gamma (7) is used as the measure of association. Row per-centage is used in cross tabulation.
One problem involved in the use of so many significance tests on the same study material is mass significance. Mass significance means that the chance of finding a significant result increases with the number of tests performed. One method of controlling the problem is to use Boole-Bonferroni inequalities [Bickel
and Doksum, 1977], which can calculate the actual significance level. If such a
calculation is performed with this material, it is found that 11 of our significant results avoid the mass significance problem. Of the remaining 20 tests, it must be said that one or more results may be due to a random effect greater than 5 %. Con sequently, it is important to concentrate not only on whether or not the result of a test is significant, but also on whether or not the result may be considered probable, based on a certain measure of common sense or based on the theory that has been used.
4 Results
4.1 Introduction
The first part of the presentation of results is devoted to describing the socioeconomic groups and lifestyle groups in the study. This is followed by a report on how these groups responded to the questions on practice driving.
The results are presented in tables and diagrams. The figures and table refe-rences give levels of significance to three decimal places.
4.2 Socioeconomic classification
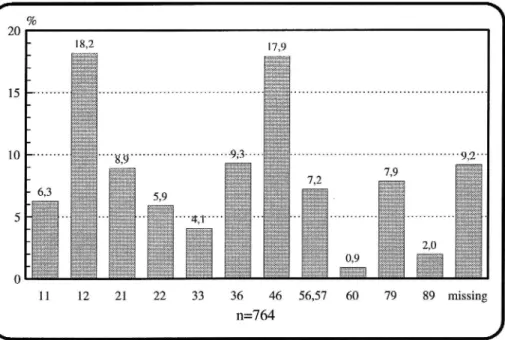
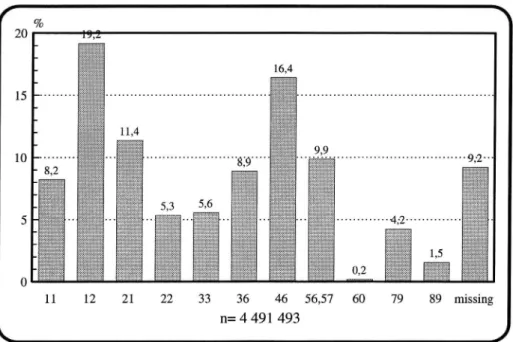
To determine whether the respondents formed a representative sample of the population, we classified their parents SEI values in accordance with the FoB 90 [Population and Housing Census] classification, in order to make a comparison.
Figure 4 shows the parents occupations of the young people in our sample and figure 5 shows the gainfully employed population of Sweden. It should be noted that among parents of our young people there are almost twice as many entrep-reneurs (code 79) as in the population as a whole. This could be because the parents of today s 17 year olds were born in the forties and fifties and the number of entrepreneurs in this age category is somewhat greater than the national average (FOB 90). Otherwise, the correspondence is good.
F %
W
20 18,2 17,9 11 12 21 22 33 36 46 56,57 60 79 89 missing n=764x
J
Figure 4 Socioeconomic classi caton ofyoung people '5 parents in our study group.
11 12 21 22 33 36 46 56,57 60 79 89 missing
n= 4 491 493
L
J
Figure 5 Socioeconomic classi cation of Swedish population accordingto FoB-90 (see section on method, table I, for an explanation of occupation codes).
When we take the household s socioeconomic situation, we shift the material
upward, since it is the higher code of the parents in the household that counts. In
a family where the mother works as a care giver (code 12) and the father works as an electrical engineer (code 46), the household s socioeconomic code is 46.
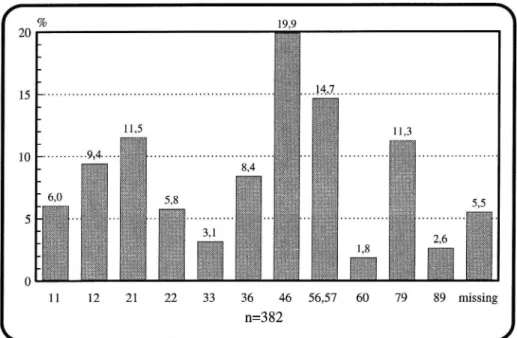
Con-sequently, theindividual-related and household related classification of the socio-economic situation differ somewhat (figure 6). The household related code is used as the socioeconomic code of the young people.
11 12 21 22 33 36 46 56,57 60 79 89 missing
n=382
L
J
Figure 6 Socioecnomic classification of households5 compared to individual classi cation. (See section on method table I, for an explanation of occupation codes).
The households are divided into blue-collar and white-collar to facilitate sub
sequent analyses. This yielded 137 blue-collar households (38.0 %) and 224
white-collar households (62.0 %).
4.3 Classification by lifestyle
Below, we show how the various lifestyle groups responded to the questions we
used to classify them. Questions 17, 18, 22, 26, and 29 are not included, since they
had different alternative answers and would make the results more difficult to understand. All the questions that are presented have alternative responses on a scale from never to very often. The mean value of each variable is zero and the line in the figure shows the group s mean value within the range of the scale, from 1 (never) to 0.75 (very often). Thus, the questionnaire responses of all individuals within a group are used to calculate a mean value for that group.
5 The young people s socioeconomic code (see chapter 2.3).
r
L
Figure 7
Help from parents on homework
Tell where youare going Dinner with family
Evening at home TV with friends TV with parents Video with friends Video with parents
Do homework Talk about school
Do own shopping lllllllllllllllllll llllllllllllllllll] -1,00 -0,75 Aldrig Friend-oriented lifestyle -0,50 -0,25 0,00 0,25 0,50 0,75 1,00 Z po'ang Mycket ofta
J
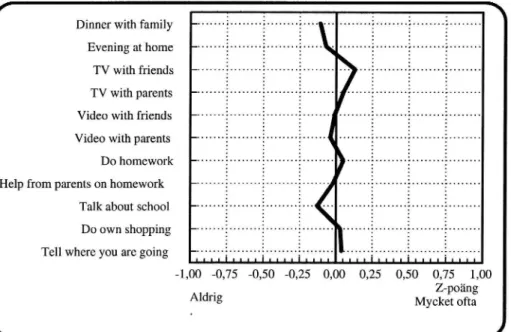
Figure 7 shows how those we classified as friend-oriented responded to these questions. They have low values for activities involving family and parents. Interest in school also seems low. The activities that receive high values are those that are done with friends. It can be seen that they are oriented toward their friends.
( Dinner with family -
--Evening at home - --TV with friends --TV with parents --Video with friends - --Video with parents --- ~-Do homework _... ..
Help from parents on homework
--Talk about school --Do own shopping
--Tell where you are going -
--L
Figure 8 Illllllllllllllllll n uuu o n o - n u u u a a u n u p n u-u - ua u . n o o u u un-n c un-n g . un-n g ¢ u . - u . un-n un-n un-n un-n u uun u. n n u n n u uc n . .-lllllllllllllllllll -l,00 0,75 Aldrig -0,50 -0,25 0,00 0,25 0,50 0,75 1,00 Z-po'ang Mycket oftaJ
Surrounding world-oriented lifestyle
Figure 8 shows the profile of those in the surrounding world-oriented group. We see that they correspond neither to the friend nor the parent side. They are also quite neutral on the school question. They are strongly oriented neither toward their friends nor their parents.
( Dinner with family
Evening at home TV with friends TV with parents Video with friends Video with parents Do homework Help from parents on homework
Talk about school Do own shopping Tell where you are going
1,00 0,75 -0,50 -0,25 0,00 0,25 0,50 0,75 1,00 Z points
Never Very often
L
'
J
Figure 9 Parent-oriented lifestyle.
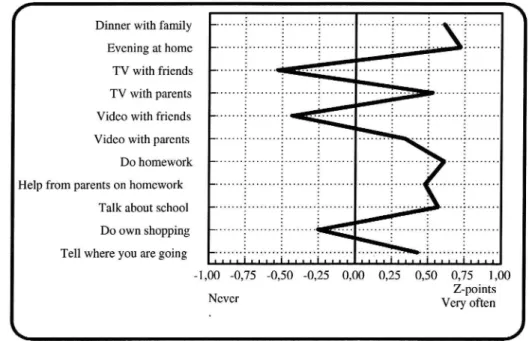
The parent-oriented lifestyle profile is shown in figure 9. It appears to be the exact opposite of the friend-oriented lifestyle. Here, family and parents seem to be an important part of the young people s lifestyle and school also has a high priority.
Of the three lifestyle groups in our classification, the surrounding world oriented is the largest with 40 %, while 35 % are parent-oriented and 25 % friend-oriented.
4.3.1 Socioeconomics and lifestyle
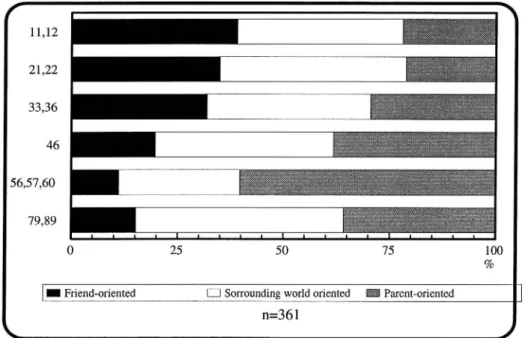
Figure 10 below shows how the different lifestyles are distributed among the socioeconomic groups. Among unskilled workers (codes 11, 12), the friend oriented lifestyle is most common. Among higher level salaried employees (codes 56, 57, 60) the parent oriented lifestyle is strongly predominant.
If we look at the friend oriented and parent-oriented groups, there is a boundary
line between lower salaried employees (codes 33, 36) and mid level salaried
employees (code 46). Below mid-level salaried employees the friend-oriented life style is more common, while from mid level salaried employees and up the parent-oriented lifestyle is more common. The surrounding world-oriented group is a relatively large group among all the socioeconomic groups.
( 11,12 21,22 33,36 46 . fa . :2 if. i. 1;. I I. . 79,89 Parent-oriented I
I - Friend-oriented I: Sorrounding world oriented
n=361
o
J
Figure 10 Socioeconomics-Lifestyle (P=0. 000).
(See section on method, table I, for an explanation of occupation codes).
If we divide the material into blue-collar and white collar workers, the
friend-oriented and surrounding world-friend-oriented lifestyles are most common among blue-collar workers. The parent oriented and surrounding world-oriented lifestyles are most common among white-collar workers (see figure 11 below).
F %
W
50 40 3O 20 10Blue-collar workers White collar workers
- Friend-oriented Parent oriented
l: Sorrounding world oriented
n=361
L
J
Figure 11 Socioeconomcs (blue collar/white collar) - Lifestyle (P=0, 000)
4.3.2 Place of residence and lifestyle
Lifestyle orientation does not seem to be affected by whether a person lives ina rural or populated area (P=O.353).
4.3.3 Family makeup and lifestyle
Young people who live with both their parents are twice as likely to have a parent-oriented lifestyle, compared to the other two family compositions, namely living with one parent or with one parent and another person (P=0.024).
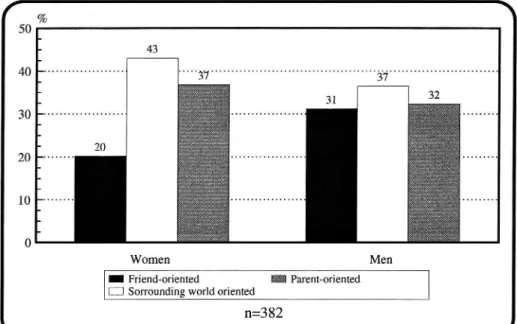
4.3.4 Gender and lifestyle
A gender-related difference may also be observed in our three lifestyle groups (figure 12). The surrounding world-oriented and parent-oriented groups are most common among women, while the lifestyles are evenly distributed among the men.
Women Men
- Friend-oriented
1:] Sorrounding world oriented
n=3 82
L
J
Parent-oriented
Figure 12 Gender - Lifestyle (P =0, 048) 4.3.5 Lifestyle and education
The results also show that there is a great difference in choice of high schools among the various lifestyle groups. The friend oriented individuals generally attend occupational training programs and the parent-oriented ones academic programs (figure 13).
f %
W
75 /1 50 _. . . . 42 25 _. . . . 0 .Friend-oriented Surrounding world-oriented Parent-oriented Occupational training [3 Academic training
k n= 355 J
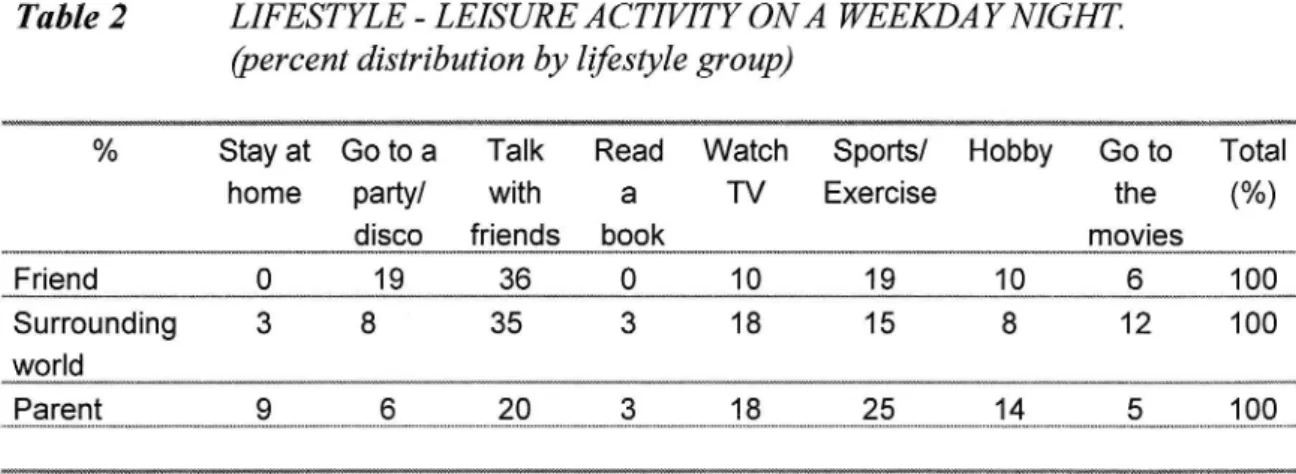
Figure 13 Lifestyle High school education (P=0, 000) 4.3.6 Lifestyle and activities
When asked what they would like to do during leisure time on a weekday evening, most friend-oriented and surrounding world-oriented individuals choose to sit around talking with their friends, while most parent-oriented ones choose sports/exercise. Among parent-oriented individuals, home activities such as watching TV, staying home and working on a hobby are common responses. The friend-oriented individuals also consider going to a party/disco more frequently than the other two groups (table 2).
Table 2 LIFESTYLE - LEISURE ACTIVITY ONA WEEKDAYNIGHT Coercent distribution by lifestyle group)
% Stay at Go to a Talk Read Watch Sports/ Hobby Go to Total
home party/ with a TV Exercise the (%)
disco friends book movies
Friend 0 19 36 O 10 19 1O 6 100
Surrounding 3 8 35 3 18 15 8 12 100
world
Parent 9 6 20 3 18 25 14 5 100
In the next table, table 3, which describes what they would like to do on a
Saturday evening, we see that the alternative go to a party/disco is dominant in all three groups. However, there is a greater spread in the parent-oriented group. They appear to have calmer wishes for their weekend than those in the other two groups. For example, they choose to sit and talk with their friends and go to the movies. It should also be pointed out that this is the only group in which anyone chose to stay at home.