Determinants of Venture Capital
Investments
BACHELOR
THESIS WITHIN: Economics NUMBER OF CREDITS: 15
PROGRAMME OF STUDY: International Economics
AUTHOR: Martia Karim JÖNKÖPING 05 2018
A panel data analysis across regions in the United Kingdom
Bachelor Thesis in Economics
Title: Determinants of Venture Capital Investments Author: Martia Karim
Tutor: Emma Lappi and Michael Olsson Date: 2018-05-21
Venture Capital, Private Equity, Fundraising, Financial institutions, Regional analysis
Abstract
Venture Capital is an important theme in economic research as a growing intermediate in the financing of new or growing young firms. In Europe, it is the United Kingdom that is the leading country with the highest amount of venture capital activity. However, there is a wide spatial distribution of venture capital across the regions of the United Kingdom where London and the South East alone pulled nearly 60% of venture capital in 2013. This paper focuses on a cross-regional study with the selected regions of the United Kingdom: Scotland, England, Wales, and Northern Ireland. The purpose to investigate the relationship between economic growth, research & development expenditure, and population density with total venture capital investments during the time period 2006 – 2016. The aim is to contribute to existing literature on determinants of venture capital with evidence from the United Kingdom. Using a fixed effect model, we can establish a positive relationship between population density and total venture capital invested. Economic growth and gross expenditure on research & development did not yield any significant result.
Table of Contents
1.
Introduction ... 4
1.1 Why is Venture Capital important? ... 4
1.2 Venture Capital in the United Kingdom... 5
1.3 Regional Venture Capital ... 6
1.4 Purpose ... 7
2.
Theoretical framework ... 8
2.1 The structure of Venture Capital firms ... 8
2.2 Geographical concentration of venture capital ... 10
2.3 Related Literature ... 11
3.
Data and Variables ... 16
3.1 Data Issues ... 18 3.2 Excluded data ... 19 3.3 Descriptive Statistics ... 19
4.
Methodology ... 21
4.1 Estimation methods ... 215.
Empirical Results ... 22
6.
Conclusion ... 24
7.
Reference list ... 26
8.
Appendix ... 31
Figure I – The Structure of Venture Capital Firms ... 9
Figure II - Classical and Keynesian view of LRAS ... 12
Table I – Definition of Variables ... 16
Table II – Average Venture Capital invested during 2006 – 2016 (£m) ... 17
Table III – Descriptive Statistics ... 19
Table IV – Correlation Matrix ... 20
Table V – Least Squares Dummy Variable Regression ... 22
Figure A – Supply and Demand Framework ... 31
Table A – Total Venture Capital Investments (£m) ... 31
Table B – Gross Value Added Growth per Head (%) ... 32
Table C – Gross Expenditure on R&D Growth (%) ... 32
Table D – Population Density per Square Kilometre ... 33
Table E – Hausman Test Summary ... 33
Table G – Pooled Ordinary Least Square Regression ... 34
1. Introduction
Venture Capital (VC) is a form of equity investment in high-risk, innovate start-ups with potential for fast and high growth, or young businesses that are already experiencing significant growth in which the venture capitalists take a minority stake. Venture capital has grown as an intermediary for financing firms where other institutions do not choose to allocate capital because of regulations such as usury laws or internal guidelines. While venture capital is available globally, it may not always be defined same. In Europe, venture capital refers to private equity investments, which are investments by institutions or business angels in both privately held and publicly traded companies. In contrast, the US define venture capital as one specific form of private equity investment, involving seed, start-up, and expansion investments (Bonini and Alkan, 2006). This paper uses the US definition of venture capital as private equity and business angel investments are not included in the research. Research by Poterba (1989), Gompers and Lerner (1999), Black, B. and Gilson, R. (1996) and Jeng and Wells (2000) among others have attempted to distinguish the supply and demand side factors of venture capital. The various author’s research was conducted to get a greater understanding of what factors affects venture capital activity. However, most research is done with respect to the U.S. market as it is more established with a higher flow of capital. In contrast, this paper will focus on the venture capital industry in the United Kingdom, one of the leading markets in Europe with the aim to find what determined venture capital investments. The relationship between economic growth, research & development expenditure growth, and population density with total venture capital investments is investigated in this paper.
1.1 Why is Venture Capital important?
The types of firms that venture capital funds invest in may have had difficulty attaining financing as they are typically young and small with few or any tangible assets and with credit constraints. Thus, traditional bank loans are usually not an alternative for the entrepreneurs seeking financing, neither is debt financing without having the necessary availability of collaterals. It is why the Venture Capital niche flourished in the first place as the rules and
structure of capital markets limit the financing options (Zinder, 1998). Few other institutional investors such as insurance companies, banks or hedge funds invest in the given type of young firms due to the risky nature of a start-up. Therefore, Venture capital investments fill an important role in the economy where it has become an intermediary in allowing high-risk, high-growth firms to prosper where they otherwise may have not. Intel, Microsoft, Cisco Systems and Apple computers are all tremendous global high-technology firms that Venture Capitalists were instrumental in fostering. Today these firms employ tens of thousands globally and have contributed to large leaps in modern technology. It signifies the important effects of these types of investments made. However, the typical portfolio of a venture capital fund consists of a small number of portfolio companies, usually from 5 to 30, where the majority of them fails to realise profits (Gage, 2012). Only a few of the firms invested in results in a successful business. Venture capital funds select ideas that seem promising using their expertise and knowledge and it is the few successful investments that offset the losses of the alternative investments. Therefore, it is possible that venture capital substitute for other financings that would have been granted, given other institutions also finding the idea viable in a situation without the availability of venture capital. The true impact of venture capital hence remains open to question.
1.2 Venture Capital in the United Kingdom
Statistics from KPMG Enterprise (2018) shows that the Venture Capital industry in Europe has grown significantly with a trending increase in the amount invested over the years 2010-2017. Regional annual investments are reaching record levels with companies in the United Kingdom raising the lion’s share of investments during quarter four, 2017. The United Kingdom has traditionally been Europe’s top venture capital hub with London as its hotspot (Dealroom, 2017). Today, Venture capital is considered one of the most important sources of funding in the UK economy (Barclays Bank UK, 2017). The success of UK’s venture capital scene could be because it shares many characteristics with its US counterpart with ambitions to build valuable, high-growth companies. Entrepreneurship holds prestige in the UK, even more so than in the other large venture capital regions in Europe such as France and Germany. Financial and labour regulations are mostly more flexible overall as well compared to other European countries. Another factor that may contribute to the successful venture capital scene in the UK could be because the online economy accounts for 8.3
percent of GDP, the highest percentage in the world (Barclays Bank UK, 2017). Technological advancement and a growing trend for online purchases have a positive influence on venture capital investments (Brandeborn and Mathson, 2017). Recent years research by the BVCA shows that investments in companies within the technology sector, specifically software & computer services, is leading with nearly double the number of companies invested in compared to the second most sector (BVCA, 2017). The UK having a strong online economy has a higher demand for venture capital in the technology sector while venture capital firms who tend to invest in this sector meet the demand with a higher supply.
1.3 Regional Venture Capital
Large regional gaps of venture capital are present in the United Kingdom. Coyle and Rosewell (2014) defined the regions as a system with a set of specializations where England, London, focuses on business services and finance, and other regions where they may have a comparative advantage. London, having a dominant reputation for being the centre for finance may hurt other regions, reducing their value for similar services while London attracts talent and captures the finance industry. This can be observed by venture capital investments tendency to concentrate in economically advanced regions where entrepreneurial opportunities are high (Martin et al., 2002). EU funding such as “Joint European Resources for Micro to Medium Enterprises”, JEREMIE, has been available for start-up funding in major cities in the UK. Even so, in 2013 London and the South East alone pulled nearly 60% of venture capital according to BVCA. Consolidation of the UK banking industry and increasing significance of scale economies in banking result in loan decision becoming standardised and centralised. (Coyle and Rosewell, 2014). Attention to local knowledge specific to individual businesses is excluded from bank’s provisions of loans. Moreover, Sunley et al. (2005) argued that there are three main advantages of venture capital operating regionally. First, operating within a region and not cross-region allows venture capitalists to better understand specific regional conditions and problems by working closely with investors, entrepreneurs, and supporting institutions. Second, regional public venture capital programmes may foster locally oriented innovation policies that aim to create the type of firms that venture capitalists typically invest in. Regional equity gaps and market failures that
originate in specific regions can also be addressed by venture capital programmes (Martin et al., 2004).
1.4 Purpose
The objective of this paper is to contribute to the research on the subject regarding Venture Capital activity determinants with evidence from regions of the United Kingdom. Specifically, I conduct the research to see if economic growth, growth in R&D expenditures, and population density increase venture capital investments. The research is done with data collected from 2006 - 2016. The independent variables are regressed on our dependent variable, total venture capital invested. The hypothesis is that R&D expenditures will have a positive significant correlation with total venture capital investments as venture capital firms tend to invest in innovative start-ups and new technology. Economic growth is also assumed to have a positive significant correlated with venture capital investments as the venture capital market allows for higher risk when the economy is strong. Population density is expected to have a positive correlated with venture capital investments as a higher population density stimulates the creation of firms. Therefore, an increased demand for venture capital in regions with higher population density is to be expected.
With the use of a least square dummy variable regression, it is concluded that neither economic growth or a growth in R&D expenditures is significant in determining total venture capital investments. Population density has a positive significance in determining venture capital investments. However, population density itself affecting total venture capital investments can be questioned as population density is likely to capture another influential factor, thus a problem with endogeneity.
The structure of the paper is as following: Section 2 provides the reader with the background of venture capital firms and previous research related to the topic. Section 3 contains data gathered on gross value added growth per head, gross R&D expenditure growth and population density as well as descriptive statistics. Section 4 covers the methodology used and section 5 the results obtained. Lastly, a conclusion is presented in section 6 followed by suggestions for future research.
2. Theoretical framework
To understand how macroeconomic factors may affect venture capital investments it is important to discern the structure of venture capital at a firm level. The structure of Venture Capital firms also explains why population density is investigated when taking a deeper look at where the capital originates from. The following section first provides information on the structure of a venture capital firm followed by a look at the geographical concentration of venture capital. To continue, venture capital activity is explained from broader economic theories to understand what may affect venture capital activity at a macro-level. Lastly, a section with empirical findings is presented.
2.1 The structure of Venture Capital firms
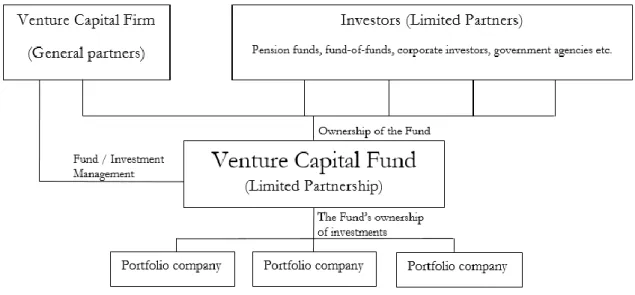
Today’s venture capital firms are structurally similar to its late 1970 and early 1980s predecessors, including a partnership with both limited and general partners (Harvard Business Review, 1998). The first step in setting up a venture capital fund is to attain investors, i.e. limited partners. In the United Kingdom, the most common limited partners are pension funds, fund-of-funds, corporate investors and government agencies (British Venture Capital Association, 2018).
The Venture Capital firm is managed by venture capitalists, also known as general partners, and together with the investors form the structure of ownership of the Venture Capital Fund as shown in Figure I. The investors, however, do not manage the fund themselves as it is solely the venture capitalists that screens the market and choose appropriate investments. Several factors help to ensure that the investors are not taken advantage of by the venture capitalists. Included is a limited lifespan of the fund which usually stretches from seven to ten years, also, the structure of compensation package (Sahlman, 1990). After limited time profits are expected to be paid out, usually about 20 percent of the funds returns to the investors. The venture capitalists receive a management fee, about 2.5%, and only when the returns pass a hurdle rate will the venture capitalists receive any additional returns (Hadzima, 2007).
Figure I – The structure of venture capital firms
Source: Brandeborn and Mathson (2017)
Venture capital firms tend to have industry-specific expertise. It eases the process of picking companies to their portfolio which is crucial as the companies typically invested in are characterized by significant informational asymmetry. Moreover, venture capitalists actively involve themselves in the governance of the companies they fund through board membership, management recruiting and the provision of management incentives, unlike traditional investors who are satisfied by being shareholders (Chen, Gompers, Kovner, Lerner, 2009). Venture capitalists also have a comparative advantage compared with other financial intermediaries due to their relative efficiency in selecting and monitoring investments because of their expertise in their field of industry. Strong industry effects are therefore present that captures the structural characteristics of industries in venture capital fund (Amit, Brander, Zott, 1998).
As venture capitalists do not only finance but also add value to companies in their portfolio firms through advice and governance, time constraints result in a trade-off between the concentration of aid to each firm and the portfolio size (Kanniainen and Keuschnigg, 2003). Diminishing returns are present to the support given by venture capitalists as the more portfolio companies a venture capital firm is involved with, the less the venture capitalists will be able to focus on each firm. Therefore, eventual portfolio expansion will not be profitable as entrepreneurs receiving less support will be reluctant to give up a larger share
of their company. The number of portfolio firms is limited, usually between five and thirty and is endogenous according to empirical findings by Cumming (2006). Four main categories of significant factors were found to affect portfolio size by Cumming (2006). Included factors are characteristics of the venture fund, characteristic of the entrepreneurial firms, characteristics of the financing arrangements, and market conditions. The four categories together determine the size of a venture capital firms’ portfolio.
2.2 Geographical concentration of venture capital
There are four key factors associated with regional differences in the supply of venture capital: the location of venture capital investments, the support for the development of a local/regional technology infrastructure and the inter-regional flows of capital (from investors in venture capital funds) which determine the pattern of investment (Mason and Harrison, 2002). The key factors are characteristics of well-developed regions and as a consequence, the economic benefits of venture capital mainly contributed to what already was the economically dynamic part of the United Kingdom (Martin, 1988). The uneven geographical distribution of venture capital can be explained by the clustering of the venture capital industry and the localised nature of venture capital investing (Mason, 2007).
The uneven distribution of investments in the UK regions was observed as early as in the 1980’s when venture capital first gained ground where Martin (1989) and Mason and Harrison (1991) interpret the regional differences as a reflection of both demand- and supply factors. Early in the rise of venture capital in the UK, the investment opportunities were found in London and in the South East. This was due to the highest volume of new firms and businesses being located in England, which explains the high demand and inflow of venture capital (Keeble and Walker, 1994). On the other hand, the supply-side has been dominated in London where the venture capital firms were concentrated with nearly two-thirds of the UK firms located in London (Mason and Harrison, 1991). It is a result of the long-established position as the financial centre in the UK as the concentration reflects venture capital firms originally being offshoots of other financial institutions, notably banks. Financial related institutions, investment expertise, and businesses have localization effects as it provides proximity to other financiers, entrepreneurs, and other parties involved in venture capital. It increases the accessibility to pools of knowledge and expertise venture
capital firms seek. Scotland has also had a relatively strong venture capital scene in the UK with evidence that the presence of a strong indigenous financial sector partially attributes to a flourishing venture capital industry. On the other hand, Wales and Northern Ireland has not been able to establish any major success in venture capital funding like their counterparts in England and Scotland (Mason, 2007).
Population density may also be significant in determining venture capital as it captures characteristics of regions that are favourable for entrepreneurship and the creating of startups. According to Capelleras et al. (2015), a higher population density is an indicator for potential customers and business opportunities in the region. Population density determined demand through the opportunity structure and supply through resources and the stock of knowledge. A higher population density is therefore believed to stimulate the creating of firms (Deckner and Gruber, 2014). Another regional characteristic population density captures is the human capital. A developed business infrastructure such as proximity to suppliers, potential customers, and the presence of a skilled workforce results in the settings for entering a market to be favourable for entrepreneurs. (Capelleras et al., 2015). Therefore, with higher population density and the characteristics it captures, the demand for venture capital should be higher.
R&D levels in the regions also differ. McCann and Folta (2009) discuss the importance of geographic proximity where locating businesses sin hotspots and clusters comes with benefits of externalities. Agglomerations potentially spur innovation in and between firms, raises productivity and competitiveness that results in higher growth for the firms (Andriani et al., 2005). It could explain the spatial and geographic distribution of R&D as clustering is highly beneficial when focusing on innovation.
2.3 Related Literature
While R&D expenditures and population density are of interest due to the nature of venture capital, different economic theories can explain why economic growth is of interest. Among them are Keynesian Economics, The Classical Theory, and the Acceleration Principle. The theories mostly reflect the demand-side of venture capital as it is the growing firms who seek funding’s to invest capital for their expansion.
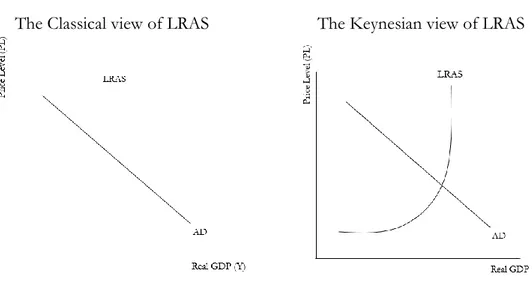
First, we have The Keynesian and the classical view that holds similarities with each other. The classical view indicates that growth of real GDP is determined by supply-side factors – the level of investment, the level of capital and the productivity of labour etc. This suggests that an increase in economic growth comes with a higher level of investments. If businesses see an improved economic forecast, the investment needs to increase to capture future demand. Venture capital markets willingness to invest increases as they become more risk-tolerant when the economy is strong and growing (Campbell and Cochrane, 1999). As the economy grows and demand rises, more firms enter the market and demand for venture capital should also increase. The Keynesian model holds a similar theory where short-run and long-run performance depends on investments. The output is not only dependent on supply-side factors in the Keynesians model, but also on demand intermediaries as seen in Figure II.
Figure II - Classical and Keynesian view of LRAS
Further, the Acceleration Theory of Investments proposed by Clark (1917) derives the same assumptions. The accelerator is a version of the neo-classical theory of investments where the price variables are constant. The Acceleration Principle implicates that an increased investment occurs because of growth in output while the output is assumed to be proportional to the capital stock. If there is an increase in demand and economic output, investments will rise to meet the expected demand.
Early work of Schumpeter (1911) introduced “entrepreneur as innovator” as an influence on driving economic development. In Schumpeter’s theory (1942), Innovation and entrepreneurship enable for creative “destruction processes” by causing disturbances to an economic system in equilibrium. It creates opportunities for economic rent and in correcting to equilibrium, more entrepreneurs enter the economic system (Wong, Ho, and Autio, 2005). The theory predicts that an increase in entrepreneurs leads to an increased economic growth. Therefore, in a region with economic growth, a higher rate of entrepreneurship is to be expected and demand for venture capital is expected to increase.
Poterba (1989) pioneered research revolving around macroeconomics and venture capital investments. The link between capital gains taxation and venture capital activity was investigated in the US market with the approach that change in either supply or demand of venture capital will affect investment activities. In doing so, Poterba (1989) provided the framework for the sensitivity of supply- and demand of venture capital, which his successors have fundamentally based their research on. Gompers and Lerner’s (1998) continued to build on Poterba’s (1989) work and through their research methodology attempt to distinguish what factors affect the supply or demand side of total venture capital investments. In doing so, Gompers and Lerner (1998) suggested that the economic concept of supply and demand equilibrium is applicable in the venture capital industry.
In place of price on the vertical axis, Gompers and Lerner (1998) conceived the model (see Appendix, Figure A) using expected rate of return as the willingness of investors to commit funds depend on the expected rate of return rather than the price. Higher expected returns increase the attractiveness for investors to supply venture capital, i.e., upward sloping supply curve. However, the authors acknowledged some issues with their modelling as they substituted price with the expected rate of return. The anticipated rate of return in the venture capital cannot be measured as private firms are valued at cost until they are sold or at an Initial Public Offering (IPO). The returns can therefore only be observed a couple of years after the investment is made. Also, as accounting policies may vary, the stated return for venture funds being partially misleading due to the variation. The authors go by the assumption that the expected rate of return (price) will not vary extensively but as they found supply to be elastic, changes in the equilibrium result in a considerably larger effect on quantities than on expected rate of return.
Gompers and Lerner (1998) further studied influencers of accessible funds in the venture capital market through alternative macroeconomic determinants. The empirical study used U.S. data on a state and national level for venture capital firms from 1969-1994. Gompers and Lerner verify Poterba’s (1998) theory that shifts in demand positively affect new funds for venture capital investments. The authors found evidence for investment activities to be positively affected by industrial and academic R&D expenditures. R&D is likely to capture demand effects of high-technology and entrepreneurial firms, which is connected to technological opportunities. Another variable Gompers and Lerner examined is GDP growth that they found to play a critical role as a determinant of venture capital supply. Through stable economic growth, there are greater opportunities for entrepreneurs, thus the demand for such capital is assumed to increase.
Further research on the relationship between economic growth and venture capital activity was conducted by Jeng and Wells (2000). The authors research venture capital determinants for a sample of 21 countries from 1986 to 1995 on different continents. Similar to Black and Gilson (1996), who argued that a well-developed stock market is fundamental for a vigorous venture capital market as it permits for exits through IPO, Jeng and Wells (2000) found that IPO is one of the most important factors for the availability of venture capital funds. A cross-country study by Levine and Zervos (1996) find that the predetermined component of stock market development to be positively and robustly associated with long-run economic growth, suggesting a relationship between IPO’s and GDP growth. To continue, Jeng and Wells (2000) found venture capital financing to be affected differently across stages of investment. Early stage and seed investments in their research were negatively impacted by labour market rigidities, while later stages were not. IPO also resulted in different findings. Early stage financing was not affected by IPO but is a significant determinant of later stage investing. Jeng and Wells (2000) concluded that when analysing venture capital investments, seed/early, expansion and late-stage investments should be taken into consideration. However, in contrast to Gompers and Lerner (1998), Jeng and Wells found that GDP growth was not a significant factor in their cross-country analysis for venture capital activity even though it was expected to be.
Schertler (2003) analysed driving forces of venture capital activity for Western European countries with a methodology similar to Jeng and Wells (2000). Schertler approached venture capital investments as two different variables. First in a narrow stage, including seed/early investments, and broadly defined for expansionary and late stage investments. While using the narrow definition of venture capital, interpretable results were achieved unlike when using the broader definition. The reason is possibly due to the broader definition as in investments in expansion stages are affected by determinants Schertler did not consider in the analysis. Similarly, like Jeng and wells (2000), Schertler also found evidence for different stages to matter when researching venture capital.
Romain and La Potterie (2004) continued to research determinants of venture capital and use the supply and demand framework to analyse panel data of 16 OECD countries over the period 1990 to 2000. Romain and La Potterie base their research on previous mentioned authors work (Gompers and Lerner (1998), Jeng and Wells (2000)). Both business R&D expenditure growth and GDP growth was analysed where venture capital was found to be pro-cyclical, similar to GDP growth. In periods of high GDP growth, venture capital activity was high as well and outperformed GDP growth and vice versa. A high labour market rigidity was found to reduce positive impact of GDP growth on venture capital intensity. The authors show that indicators of technological opportunities, such as R&D activity, available stock of knowledge and the number of triadic patents, significantly influence a country’s investment in venture capital.
3. Data and Variables
This paper includes panel data over the time-period 2006 – 2016. Regional data from the United Kingdom has been collected, namely from Scotland, England, Northern Ireland, and Wales. The regions are selected as they are the largest regions that together form the United Kingdom. As such, venture capital across smaller defined regions are all accounted for. However, breaking the United Kingdom down into smaller regions in this study would have resulted in more observations. For the selected regions and time span, there are 44 observations. Table I contains a summary of the variables and their expected signs.
Table I – Definition of variables
Variable Description Source
Total Venture Capital Total Venture Capital across seed/start-up, early stage, and expansion stage investments
British Venture Capital Association (BVCA)
Gross Value Added
Per Head The value generated by any unit engaged in the production of goods and services Office for National Statistics (ONS)
Gross Expenditure in Research and
Development
The aggregate expenditure on R&D by business enterprises, higher education, government, and non-private
organizations
Office for National Statistics (ONS)
Population Density Number of people per square kilometer Office for National Statistics (ONS)
Expected Signs
Gross Expenditure on
R&D Growth +
Gross Value Added Growth per Head +
Population Density +
Total Venture Capital Investments
The data used for selected dependent variable this paper, total venture capital investments, is collected from the British Venture Capital Association (BVCA). This data includes all stages of venture capital investments which includes seed/start-up, early stage, and expansion venture capital. BVCA is the industry body and public policy advocate for the private equity and venture capital industry in the UK. The collected data from BVCA’s research has a 98
percent response rate, which included essentially every major venture capital firm in the UK and therefore is a good representation of the venture capital industry. Table II presents the average venture capital invested from 2006 – 2016. It illustrates a major difference across the regions and as discussed, in England it is London’s dominant finance sector that attracts venture capital while Northern Ireland seems to have had a lacking venture capital industry. See Table B in the Appendix for data on total venture capital invested (£m) for each year. To normalise the data in the regression instead of measuring size, Total Venture Capital Investments will be logged.
Table II – Average Venture Capital invested during 2006 – 2016 (£m)
England Scotland Wales Northern Ireland
6705,45 295,27 69,27 27
Gross Value Added Growth per Head
The data on the independent variable for economic activity is presented as Gross Value Added growth per head (GVA growth per head). It is collected from Office for National Statistics, UK’s largest independent producer of official statistics and is the recognised national statistical institute. GVA measured in growth per head is used as a tool to adjust for regional differences in growth. More on GVA is discussed in section 3.1 Data issues. See Table C in the Appendix for data on gross value added growth per head.
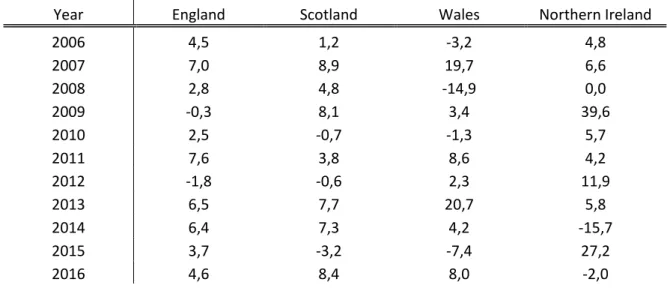
Gross Expenditure on Research & Development Growth
Office for National Statistics is also used to collect data for the variable Gross Expenditure on R&D (GERD). GERD is the aggregate R&D expenditure done by business enterprises, higher education, government, and private non-profit organisations. All data is in current prices and adjusted for inflation. The data used is in terms of annual growth. The following calculation was used to calculate growth:
𝐺𝑟𝑜𝑠𝑠 𝐸𝑥𝑝𝑒𝑛𝑑𝑖𝑡𝑢𝑟𝑒 𝑜𝑛 𝑅&𝐷 𝐺𝑟𝑜𝑤𝑡ℎ = (𝐺𝐸𝑅𝐷𝑡− 𝐺𝐸𝑅𝐷𝑡−1
See Table D in the Appendix for data on Gross Expenditure on Research & Development Growth.
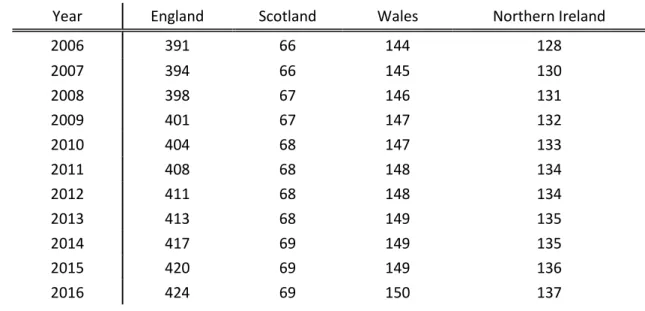
Population Density
Office for National Statistics is the source for the region’s population density as well. The data is measured in people per square kilometres. See Table E in the Appendix for data on population density.
Table I contains the expected signs and represents the expected results when running a regression. Venture Capital firms are known to seek and invest in new technology. R&D expenditure is crucial to the development of new technology. Therefore, as regions increase their expenditures, venture capital investments are expected to increase as well to capture the demand. Gross Value Added Growth per Head represents the productivity in regions. It is a close measure to GDP growth. While Venture Capital firms already invest with a high risk, the amount of risk acceptable ss even higher in a growing, strong economy (Campbell and Cochrane, 1999). Subsequently, GVA growth per head is expected to be positive and a growth assumed to increase venture capital levels. Lastly, population density is also assumed to be positive. A higher population density drives the creation of firms and comes with favourable settings for entrepreneurs to start their business (Capelleras et al., 2015). With more startups, the demand for venture capital is expected to increase. A higher demand may subsequently affect the total amount of venture capital invested.
3.1 Data Issues
Jeng and Wells (2000) and Schertler (2003) suggests that venture capital investment could be analysed at various stages for early/seed, expansion, and late stage investments. Both authors argued for it as they found inconsistent significance in their selected variables across investment stages. However, as the purpose of this paper is to find empirical evidence with a regional breakdown from the United Kingdom, it is an approach that cannot be used. This is due to data on stage investments not being available on a regional basis. Using data for stage investments for the United Kingdom as a whole does not fit the purpose of this paper and is therefore not included.
The data on GDP growth in regions for the United Kingdom is not available, instead, economic activity is measured using gross value added. GVA is mostly used to give a sector, industry or regional-specific picture of growth and arguably illustrates the economic activity better as GDP growth can record a sharp increase in events of increased tax collections and not necessarily because of increased output. Also, while GDP growth is a key measurement to make cross-country analysis, this paper only includes regions within the United Kingdom. Therefore, GVA growth per head is a good estimation of economic growth and will be used instead of GDP growth compared to previous research.
3.2 Excluded data
Apart from the included variables, I acknowledge the fact that more elements are driving venture capital investments. An important variable in previous research is IPO that Jeng and Wells (2000), and Black and Gilson (1996), found to be one of the main determinants for venture capital activity. Also, pension funds play a significant role in determining the supply of venture capital (Jeng and Wells 2000, Gompers and Lerner, 1998). As such, a variable for pension funds has been included in previous research. Mentioned data has been excluded due to IPO figures, and pension fund investments, being unavailable on a regional basis for the United Kingdom.
3.3 Descriptive Statistics
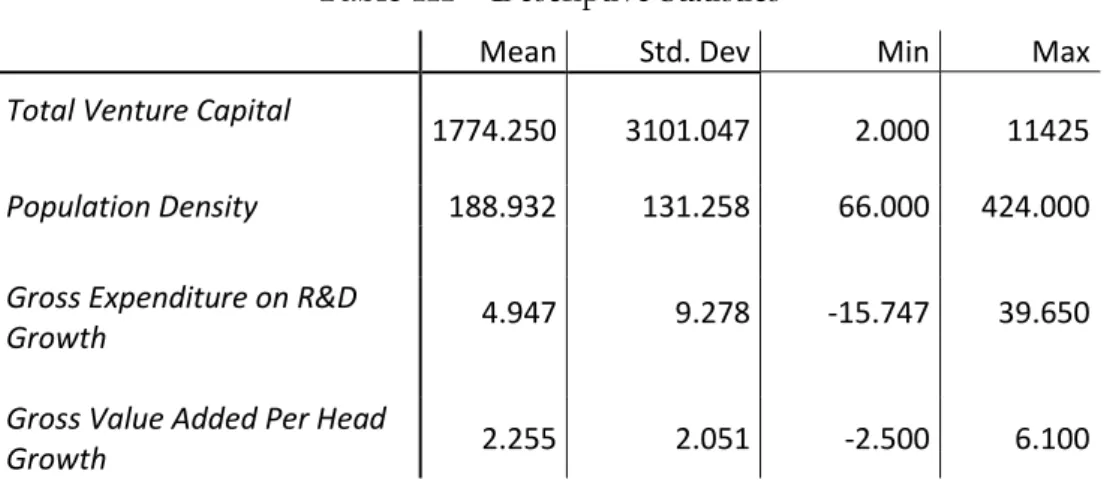
Table III contains descriptive statistics of the data collected.
Table III – Descriptive Statistics
Mean Std. Dev Min Max
Total Venture Capital
1774.250 3101.047 2.000 11425
Population Density 188.932 131.258 66.000 424.000
4.947 9.278 -15.747 39.650
Gross Expenditure on R&D Growth
Gross Value Added Per Head
There is a total observation of 44. Total Venture Capital shows a mean of 1774.250 and a high standard deviation due to the large difference between the region’s venture capital activities. England stands for the maximum value of 11425 while Northern Ireland is showing the minimum of 2. Population density also differs over a wide range. England has a maximum value of 424 and Scotland represent the minimum value of 66. A noteworthy observation is that with a lesser population density, Scotland still has higher venture capital investments than other regions with more. The standard deviation for Gross Expenditure on R&D growth indicates large regional differences most likely due to sizes like the other variables, which can also be observed by the difference in minimum and maximum value. Gross expenditure on R&D growth is also showing interesting numbers. The mean growth is close to five but presents large differences in minimum and maximum value. It happens to be Northern Ireland that represents both the minimum and maximum value, indicating large volatility in the region.
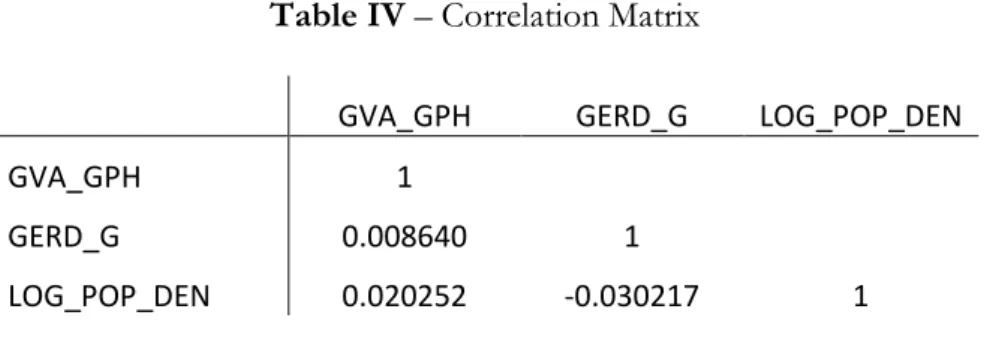
Table IV – Correlation Matrix
GVA_GPH GERD_G LOG_POP_DEN
GVA_GPH 1
GERD_G 0.008640 1
LOG_POP_DEN 0.020252 -0.030217 1
Table IV represents a correlation matrix between the independent variables. The correlation matrix is conducted to see if there are any variables correlated on a high level, which would negatively affect the analysis. As seen in Table IV, the variables are not correlated. Gross expenditure on R&D growth and population density shows a negative correlation, however, the value is almost zero.
4. Methodology
With the use of panel data, we have more accurate inference of model parameters. Panel data usually contain more degree of freedom and more sample variability than cross-sectional data with T = 1, or time series data that contains N = 1. As a result, the efficiency of econometric estimates will improve overall (Hsiao, Mountain, Ho-Illman, 1995). We can also control for regional heterogeneity that varies across regional but not over time by using panel data. Furthermore, repeated observations with cross-sectional data enable us to analyse dynamic changes over a shorter time-period, in our case a time span of ten years. The methodology includes the dependent variable, total venture capital investments, and three independent variables, gross value added per head, gross expenditure on R&D and population density.
4.1 Estimation methods
The methodology used is similar to the one used by Jeng and Wells (2000) in their research. However, we do not attempt to distinguish demand or supply variables for venture capital. A Hausman test was conducted to find the most appropriate estimation model between fixed effects and random effects, the test results can be found in the Appendix, see Table F. The null hypothesis in a Hausman test states that both fixed effect and random effects methods are appropriate for the given data, and both effects should present similar results. However, at a 5 percent significance, the Hausman test presents a p-value > Chi-sq value. We reject the null of random effects and based on the results proceed with a fixed effects model for the analysis. Yearly dummy variables (T – 1) are added to control for year-specific effects to account for possible relationship biased from time trends and macro shocks. A fixed component for regional fixed effect is also included. The two-way fixed effect model is as followed:
𝐿𝑂𝐺_𝑉𝐶_𝑇𝑂𝑇𝑖𝑡 = 𝛽0+ 𝛽1𝐺𝑉𝐴_𝐺𝑃𝐻𝑖𝑡+ 𝛽2𝐺𝐸𝑅𝐷_𝐺𝑖𝑡+ 𝛽3𝐿𝑂𝐺_𝑃𝑂𝑃_𝐷𝐸𝑁𝑆𝑖𝑡
+ 𝜎𝑡+ 𝛿𝑖+ 𝜇𝑖𝑡
Where:
LOG_VC_TOT is total venture capital invested with log data, GVA_GPH is gross value added growth per head,
GERD_G is gross expenditure on research & development growth, LOG_POP_DENS is population density with log data,
σ
represents dummy variables, δ represents regional fixed effect,µ
represent residuals,t = 1, 2,…, T (where t denoted the time series, in our model years),
i = 1, 2,…, N (where i denotes the cross-section dimension, in our model regions).
5. Empirical Results
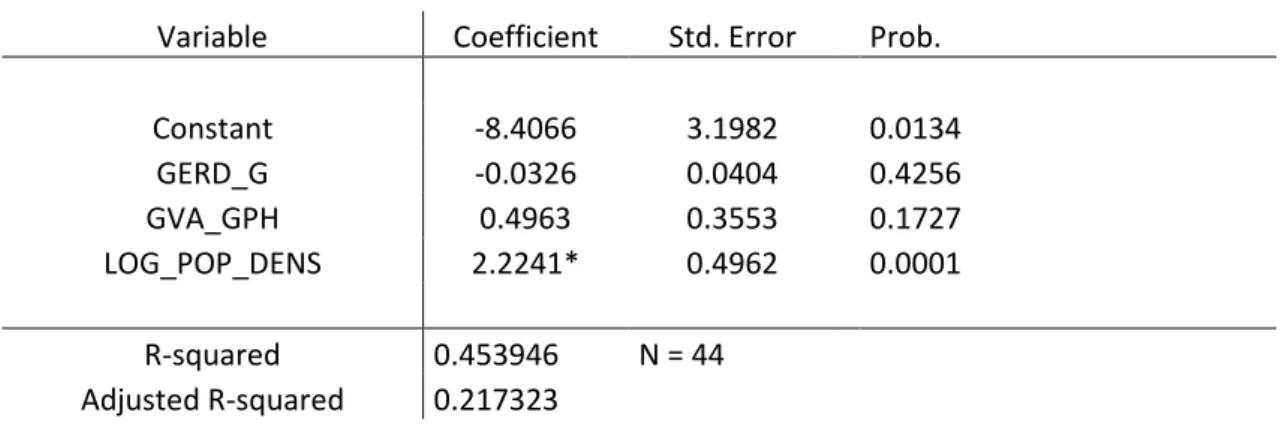
Table V shows the results obtained from the fixed effect model in Equation (1). Table V – Least Dummy Squares Variable Regression
Variable Coefficient Std. Error Prob. Constant -8.4066 3.1982 0.0134 GERD_G -0.0326 0.0404 0.4256 GVA_GPH 0.4963 0.3553 0.1727 LOG_POP_DENS 2.2241* 0.4962 0.0001 R-squared 0.453946 N = 44 Adjusted R-squared 0.217323 * Significant at 1% level.
Dummies are excluded from the table due to all of them being insignificant.
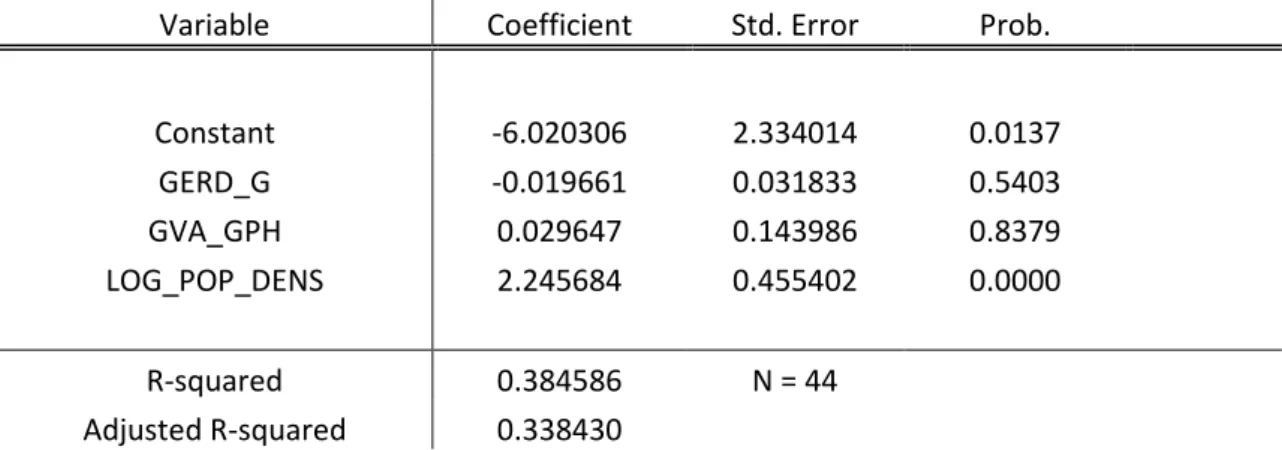
In Table V we can observe that only population density is significant. An ordinary least squares regression as well to check for robustness that yielded persistent results, see Table G in the Appendix for the results. Even though the dummy variables are not significant, the coefficients are similar with the same signs in a fixed effect regression with dummies
excluded. The dummies are, therefore, still included in the model. See Table H in the Appendix for the fixed effects model regression without dummies.
When comparing the results with previous research, there are some differences. First, Gross value Added growth per head proved to be insignificant in the results, indicating that it does not have an effect on the total venture capital invested. GVA was used as a substitute to GDP used in previous research in this paper as a mean of measuring economic activity. The findings on GDP’s effect on venture capital remained open to question as various authors’ evidence differed. Gompers and Lerner (1998), and Romain and La Potterie (2004) concluded that GDP growth was critical to venture capital supply unlike Jeng and Wells (2000) who did not find any significance for GDP growth. Also, economic theories such as the Keynesian view and the Classical view suggests that an increase in economic growth comes with increased investments. In other words, in a growing and strong economy, firms are expected to invest more capital and thus seek additional funding. GVA growth per head was expected to be positively significant based on economic theory and the majority of previous authors’ findings but the results did not correspond. However, as venture capital focus on few, smaller businesses, the effects of the increased demand for capital and investments may not be captured. It could explain why GVA growth per head did not show significant results, although, one should note the variable GVA GPH has a positive coefficient.
Gross expenditure on research and development was not significant in this study. R&D was expected to be positively significant in determining the demand for venture capital. Gompers and Lerner (1998) found evidence for industrial and academic R&D expenditures to increase the venture capital demand. Romain and La Potterie (2004) conceived the same results by including data for business R&D expenditure growth in their research. Even though his paper included additional R&D expenditures by non-profit organisation and government, the expected result was not believed to differ. However, the aggregate R&D expenditures may through sectors they excluded prove to diminish the significance in deciding venture capital demand. The typical portfolio company of a venture capital firm is in either a up stage, early stage or an expansion/late stage. It is mostly during the seed/start-up stage that the portfolio companies focus on R&D and product testing. According to data from the British Venture Capital Association, the amount invested by the venture capitalists during this stage is notably modest in comparison to later stages where the businesses already
have their product ready. A theory could be that GERD growth did not indicate the expected result due to the total amount of venture capital invested in seed businesses being insignificant compared to the grand total. However, the results should be interpreted with care as a negative coefficient suggesting a negative correlation is highly unlikely.
Population density was the only variable that proved to be significant in this study. According to empirical findings, population density was believed to be a positive influence of venture capital investments due to it measuring the favourable environment for entrepreneurship. In turn, demand for venture capital is expected to be higher and the supply to meet it as there is a wider selection of businesses to invest in. However, Scotland with the lowest population density among the regions selected for this study is next after England when measuring total venture capital invested. Therefore, the reason to why population density is significant may be due to an endogeneity problem. It is possible that there is an omitted variable bias present in case of variables not included in the regression that influence both population density and total venture capital investments. A specific variable that comes to mind is human capital, as it may be more suitable to capture a strong workforce and richer regions more directly than population density. Also the amount of firm in the regions that could lead to more vacancies and an inflow of workforce that also gives venture capitalists more investment opportunities.
6. Conclusion
This paper analyses determinants of the United Kingdom venture capital market using a two-way fixed effects model, the least squares dummy variables model. The data set breaks down the United Kingdom into the regions of Scotland, Wales, England and Northern Ireland for the period from 2006 to 2016. There are large differences across the regions in the UK when it comes to venture capital activity. England with local regions such as London proved to have historically a dominant position as a finance hub. In comparison, other regions do not come near the levels of venture capital. Therefore, rather than going a time series analysis on the UK, panel data was used. The empirical model includes independent variables for measure economic growth, population density, and R&D growth. Gross value added growth per head is used instead of GDP growth as it is the main measure of economic growth in the regions of the United Kingdom. The second independent variable is Gross expenditure on R&D growth across all sectors for business enterprises, higher education, government, and non-private organizations and lastly, population density. The results indicate that neither
gross value added growth per head nor gross expenditure on R&D growth are factors influencing venture capital investments in the United Kingdom when analysing regions. The results were unexpected as economic theories supported the suggestion of an economic growth increasing the demand for venture capital as a strong economy increases the risk-tolerance of venture capitalists. Gross expenditure on R&D was also expected to be positively correlated with venture capital investments as new technologies is mainly what venture capital firms seek to invest in. Although population density presented significant results, it is likely that it captured the effects of a more specific factor as Scotland with a lower population density had higher total venture capital investment than other regions, thus, an endogeneity problem.
In this paper, only a few variables are used in the empirical model. While gathering data on regions across the United Kingdom may prove to be difficult, further research should attempt to expand the empirical model with more variables to control for endogeneity and achieve more reliable results. Also, while the United Kingdom in general is a leading hub for venture capital activity in Europe, it is mostly England and local regions such as London that pulls the greatest weight. All gathered data is also available in all the regions in the United Kingdom, thus, the research could therefore be applied to different regions.
7. Reference list
1. Amit, R., Vrander, J. and Zott, C. (1998). Why do Venture Capital Firms Exist?
Theory and Canadian Evidence. Journal of Business Venturing, 13(6), pp.441-466
2. Andriani, P., Jones, C., Perkmann, M., Propris, L. de, Sena, V., Delbridge, R., et al.
(2005). Challenging clusters. The prospects and pitfalls of clustering for innovation and economic development.
3. Black, B. and Gilson, R. (1996). Venture Capital and the Structure of Capital Markets:
Banks Versus Stock Markets. SSRN Electronic Journal.
4. Bononi, S. and Alkan, S. (2006) The Macro and Political Determinants of Venture Capital Investments around the World. 16 November 2006 draft.
5. Brandeborn, C. and Mathson, F. (2017). The Macroeconomic Determinants of Venture Capital Investments. Undergraduate. Stockholm School of Economics.
6. Campbell, J. and Cochrane, J. (1999). Force of Habit: A Consumption-Based
Explanation of Aggregate Stock Market Behavior. Journal of Political Economy, 107(2), pp.205-251.
7. Capelleras, J., Contin-Pilart, I., Larraza-Kintana, M. and Martin-Sanchez, V. (2015).
Population density and individual human capital influences on entrepreneurial growth aspirations.
8. Chen, H., Gompers, P., Kovner, A. and Lerner, J. (2009). Buy Local? The Geography
of Successful and Unsuccessful Venture Capital Expansion. SSRN Electronic Journal
9. Clark, J. (1917). Business Acceleration and the Law of Demand: A Technical Factor
in Economic Cycles. Journal of Political Economy. 25(3), pp.217-235.
10. Cumming, D. (2006). The Determinants of Venture Capital Portfolio Size: Empirical
Evidence. Journal of Business, 79(3), pp.1083-1126.
11. Deckner, J., and Gruber, M. (2014). The Effects of Opportunities and Founder
12. Eklund, J. (2013). Theories of Investment: A Theoretical Review with Empirical
Applications. Working Paper, Swedish Entrepreneurship Forum.
13. Gompers, P. A. and Lerner, J. (1999). What drives venture capital fundraising? Working Paper, Harvard University, Cambridge, MA.
14. Hsia, C., Mountain, D. C., and Ho-Illman, K. (1995). Bayesian integration of end-use
metering and conditional demand analysis. Journal of Business and Economic Statistics, 13, Pp.315-326.
15. Jeng, L. and Wells, P. (2000). The determinants of venture capital funding: evidence
across countries. Journal of Corporate Finance, 6(3), pp. 241-289.
16. Kanniainen, V. and Keuschnigg, C. (2003). The optimal portfolio of start-up firms
in venture capital finance. Journal of Corporate Finance, 9(5), pp. 521-534.
17. Kebble, D. and Walker, S. (1994). New firms, small firms and dead firms: spatial
patterns and determinants in the United Kingdom. Regional Studies, 28, pp. 411-427.
18. Levine, R. and Zervos, S. (1996). Stock Market Development and Long-Run Growth. The World Bank Economic Review, 10(2), pp. 323-339.
19. Martin, R. (1988). The political economy of Britain’s north-south divide. Transactions of the Institute of British Geographers, 13, pp. 389-418.
20. Martin, R. (1989). The growth and geographical anatomy of venture capitalism in the
United Kingdom. Regional Studies, 23, pp. 389-403.
21. Martin, R., Sunley, P., and Turner, D. (2002). Taking risks in regions: the geographical anatomy of Europe’s emerging venture capital market. Journal of Economic Geography, 2.
Pp.121-150.
22. Mason, C. (2007). Venture Capital: A geographical perspective. Handbook Of Research On Venture Capital. pp. 86-112.
23. Mason, C. and Harrison, R, T. (1991). The north-south divide and small firm’s policy
in the UK: the case of the Business Expansion Scheme. Transactions of the Institute of
British Geographers, 14, pp- 37-58.
24. Mason, C. and Harrison, R, T. (2002). Barriers to investment in the informal venture
capital sector. Entrepreneurship and Regional Development, 14, pp. 271-287.
25. McCann, B. T., & Folta, T. B. (2009). Demand- and supply-side agglomerations:
distinguishing between fundamentally different manifestations of geographic concentration. Journal of Management Studies, 46(3), 362-392.
26. Poterba, J.M. (1989). Venture Capital and Capital Gains Taxation. Tax Policy and the
Economy, Volume 3, pp. 47-67
27. Romain, A and Van Pottelsberghe de La Potterie, B. (2004). The determinants of
venture capital: a panel data analysis of 16 OECD countries, No. 04-15.RS, Working Papers CEB, ULB – Universite Libre de Bruxelles.
28. Sahlman, W. (1990). The Structure and Governance of Venture-Capital Organizations.
Journal of Financial Economics, Volume 27, Issue 2. Pp. 473-521.
29. Schertler, A. (2003). Driving Forced of Venture Capital Investments in Europe: A
Dynamic Panel Data Analysis. Kiel Working Paper, No. 1172.
30. Schumpeter, J.A. (1911). The theory of economic development. Cambridge, MA:
Harvard University Press
31. Schumpeter, J.A. (1942). Capitalism, Socialism, And Democracy. American Economic Review, 3.
32. Sunley, P., Klagge, B., Berndt, C., Martin, R. (2005).
33. Tran, A and Jeon, B. (2011). The dynamic impact of macroeconomic factors on initial
public offerings: evidence from time-series analysis. Applied Economics, 43(23), pp. 3187-3201
1. Barclays Bank UK (2017). Venture Capital in the UK. [online] Available at:
https://www.barclayscorporate.com/content/dam/corppublic/corporate/Docum ents/Industry-expertise/venture-capital-in-the-uk.pdf [Accessed 9 Apr. 2018]
2. CB Insights. (2015). The U.S. Venture Capital Year in Review – 2014. [online] Available
at: www.cbinsights.com/venture-capital-2014 [Accessed 9 May 2018].
3. Data.worlbank.org. (n.d.). GDP (current US$) | Data. [online] Available at:
https://data.worldbank.org/indicator/NY.GDP.MKTP.CD?end=2016&locations =EU-US&start=1960&view=chart [Accessed 29 Mar. 2018]
4. Dealroom (2017). Fundraising by European venture capital funds. [online] p.5. Available at:
https://blog.dealroom.co/wp-content/uploads/2017/09/EuropeanFundsFINAL.pdf [Accessed 3 Mar. 2018]
Electronic sources:
5. European Commission (2017). Commission and EIF start selecting Pan-European Venture Capital Fund-of-Funds promoters. [online].
6. Gage, D. (2012). The Venture Capital Secret: 3 out of 4 Start-Ups Fail. The Wall Street Journal. [online] Available at:
7. Hadzima, J. (2007). “A beginner’s guide to venture capital. (PowerPoint presentation).
Massachusetts Institute of Technology. Available at:
https://l.facebook.com/l.php?u=https%3A%2F%2Fwww.google.se%2Furl%3Fsa %3Dt%26rct%3Dj%26q%3D%26esrc%3Ds%26source%3Dweb%26cd%3D1%26 ved%3D0ahUKEwjB56WY2pnaAhVF8ywKHWhbDb8QFggsMAA%26url%3Dht tp%253A%252F%252Fnutsandbolts.mit.edu%252Fresources%252FBeginners%25 2520Guide%252520to%252520VC.ppt%26usg%3DAOvVaw0482dBRfbfNCcllEE dGvPd&h=ATPFB97oV6457Ywm3wUyeX5I6Tz9SoEQgAzsRmZ88tlZPh7l8L-Ma0ZkA70QR7K93sIAnlvTWQF1ty5TNNRCRYYHxiNiZAvO04I0s8Wx5Q_nh 5bhyBE [Accessed 4 Apr. 2018]
8. Harvard Business Review. (1998.). How Venture Capital Works. [online] Available at:
https://www.wsj.com/articles/SB1000087239639044372020457800498047642919 0?mod=WSJ_business_LeftSecond%20Highlights
9. Investeurope.eu. (n.d). Invest Europe Platforms. [online] Available at:
https://www.investeurope.eu/about-us/invest-europe-governance/platforms/?loc=2327 [Accessed 28 Mar. 2018]
10. KPMG Enterprise (2018). Venture Pulse Q4 2017. Venture Pulse Report. [online]
p.61. Available at:
https://assets.kpmg.com/content/dam/kpmg/xx/pdf/2018/01/venture-pulse-report-q4-17.pdf [Accessed 3 Feb. 2018]
11. Marovac, N. (2017). Can Europe emulate Silicon Valley’s success?. [online] World
Economic Forum. Available at:
https://www.weforum.org/agenda/2017/11/europe-venture-capitalists-silicon-valley/ [Accessed 9 May 2018]
12. World Economic Forum (2017). Europe’s venture capitalists are closing the gap with Silicon Valley. [online]. Available:
https://www.weforum.org/agenda/2017/11/europe-venture-capitalists-silicon-valley/ [Accessed 3 Mar. 2018]
13. Zinder, B (1998). How Venture Capital Works. [online] Harvard Business Review.
Available at: https://hbr.org/1998/11/how-venture-capital-works#comment-section [Accessed 4 Jun. 2018]
8. Appendix
Figure A – Supply and Demand Framework
Table B – Total Venture Capital Investments (£m)
Year England Scotland Wales Northern Ireland
2006 9979 174 61 13 2007 11425 393 128 26 2008 7383 1052 112 9 2009 4270 443 67 12 2010 7864 171 39 163 2011 6130 334 58 21 2012 5510 159 87 9 2013 4042 47 55 6 2014 4446 206 51 16 2015 5775 138 55 20 2016 6936 131 49 2
Table C – Gross Value Added Growth per Head (%)
Year England Scotland Wales Northern Ireland
2006 4,4 6,1 5,2 5,4 2007 4,4 3,3 2,4 3,2 2008 2 1,4 -1 -0,6 2009 -2,5 0,2 -2,2 -2,3 2010 1,4 -1,3 0,5 0,7 2011 1,6 2 3,6 1,9 2012 3 1,8 2,8 3,4 2013 3,3 4,1 3,9 1,7 2014 4,3 4,9 1,4 2,8 2015 2,3 1,2 3,2 3,2 2016 2,7 2,6 3,6 3,2
Source: Office for National Statistics
Table D – Gross Expenditure on R&D growth (%)
Year England Scotland Wales Northern Ireland
2006 4,5 1,2 -3,2 4,8 2007 7,0 8,9 19,7 6,6 2008 2,8 4,8 -14,9 0,0 2009 -0,3 8,1 3,4 39,6 2010 2,5 -0,7 -1,3 5,7 2011 7,6 3,8 8,6 4,2 2012 -1,8 -0,6 2,3 11,9 2013 6,5 7,7 20,7 5,8 2014 6,4 7,3 4,2 -15,7 2015 3,7 -3,2 -7,4 27,2 2016 4,6 8,4 8,0 -2,0
Table E – Population Density per Square Kilometre
Table F – Hausman Test Summary
Chi-Sq. Statistic Chi-Sq. d.f. Prob.
Cross-section random 277.8774 3 0.000
Variable Fixed Random Var(Diff.) Prob.
GERD_G 0,00618 -0.01966 0.000005 0.000
GVA_GPH -0.04170 0.02965 0.000019 0.000
LOG_POP_DENS -13.0109 2.24568 30.74550 0.006
H0: The individual specific effects are random
Year England Scotland Wales Northern Ireland
2006 391 66 144 128 2007 394 66 145 130 2008 398 67 146 131 2009 401 67 147 132 2010 404 68 147 133 2011 408 68 148 134 2012 411 68 148 134 2013 413 68 149 135 2014 417 69 149 135 2015 420 69 149 136 2016 424 69 150 137
Table G – Pooled Ordinary Least Square Regression
Variable Coefficient Std. Error Prob.
Constant -6.020306 2.334014 0.0137 GERD_G -0.019661 0.031833 0.5403 GVA_GPH 0.029647 0.143986 0.8379 LOG_POP_DENS 2.245684 0.455402 0.0000 R-squared 0.384586 N = 44 Adjusted R-squared 0.338430
Table H – Fixed Effect Model Regression Without Dummies
Variable Coefficient Std. Error Prob.
C -6.0203 2.3340 0.0137
GERD_G -0.01967 0.0318 0.5403
GVA_GPH 0.0296 0.1440 0.8379