AN ANALYSIS OF THE ELECTRIC UTILITY INDUSTRY DURING THE ENERGY CRISIS
WITH IMPLICATIONS TO SOLID WASTE MANAGEMENT POLICIES
By
Jeffrey S. Strickland
ARTHUR LAKES LIBRARY C O LO M B O SCHOOL of M INES
ProQuest N um ber: 10783724
All rights reserved
INFORMATION TO ALL USERS
The qu ality of this repro d u ctio n is d e p e n d e n t upon the q u ality of the copy subm itted.
In the unlikely e v e n t that the a u th o r did not send a c o m p le te m anuscript and there are missing pages, these will be note d . Also, if m aterial had to be rem oved,
a n o te will in d ica te the deletion.
uest
ProQuest 10783724Published by ProQuest LLC(2018). C op yrig ht of the Dissertation is held by the Author.
All rights reserved.
This work is protected against unauthorized copying under Title 17, United States C o d e M icroform Edition © ProQuest LLC.
ProQuest LLC.
789 East Eisenhower Parkway P.O. Box 1346
T - 4051
A thesis submitted to the Faculty and the Board of Trustees of the Colorado School of Mines in partial fulfillment of the requirements for the degree Master of Science (Mathematics). Golden, Colorado Date P U r iK , m t Approved Signed JeffreyS /Strfckland Thesis Co-advisor Approved Dr. William R. Astle Thesis Co-advisor Golden, Colorado Date M to e i » 4^ i Dr. Ardel J. Boes Professor and Head Mathematics Department
T - 4051
ABSTRACT
This thesis analyzes the electric utility industry during the energy crisis of the 1970’s and compares the various factors of the crisis and the operation of utilities during the crisis to current trends in solid waste management. Due to sim ilarities between the electric utilities and an integrated solid waste management system, and similarities between crisis factors, a statement can be made about the the cumulative effects of the energy crisis on the electric utility industry and the associated future impacts on solid waste management policies.
In conducting this analysis, we have concentrated on the following parameters:
1. Determine what functional relationship exists between electricity consumption and various factors brought about by the energy crisis, and build a causal forecasting model to support the conclusions.
2. Determine how increasing electric prices influenced a decrease in the growth rate of residential electricity consumption, and hypothesize a similar relationship between the cost of solid waste disposal and the growth rate of solid waste generation.
By investigating these questions, we were able to gain insight into the complexity of the relationships that occurred during the Energy Crisis, and how these same conditions exist today in the Solid Waste Crisis, giving policy implications about the future of solid waste management.
T - 4051 TABLE OF CONTENTS Page ABSTRACT... iii LIST OF APPENDICES...v LIST OF FIGURES... vi
LIST OF TABLES... :...vii
ACKNOWLEDGEMENTS... viii
CHAPTERS 1. Introduction...1
2. The Problem and Techniques for Solving It... ...9
3. Economic and Regression Analysis...17
3.1 The Energy Crisis... 18
3.2 The Decline of the Electric Utilities...23
3.3 Solid Waste Parallels... 35
3.4 Statistical Regression Analysis...37
3.4.1 The Statistical Data... 38
3.4.2 Regression Models...40 3.3.3 Model I 1960-70... 42 3.3.4 Model II 1960-1988 (Modified)... 49 4. Conclusions... 58 REFERENCES CITED... 64 iv
T - 4051
APPENDICES Page
APPENDIX A: Definitions...68
APPENDIX B: Data... 70
APPENDIX C: Analysis of Models... 73
C.1 Model 1...73
C.2 Model I 1...75
C.2.1 Evaluation of Assumption... 80
C.2.2 Derivation of Long-run Elasticities... 93
T - 4051
LIST OF FIGURES
Bage
FIGURE 3-1: Scattergram for Energy Consumption, 1960-87... 41
FIGURE 3-2: Scattergram for Total Wastes Discarded, 1960-87... 41
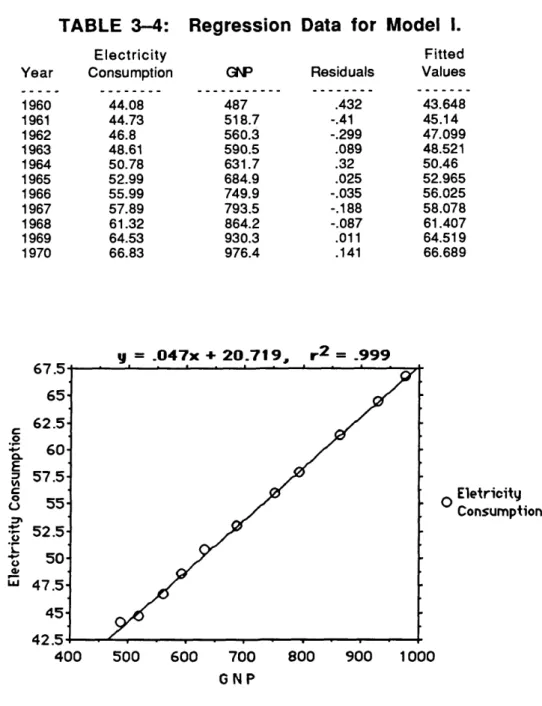
FIGURE 3-3: Regression Scatterplot for Model 1... 45
FIGURE 4-1: How Much Time Remains?... 59
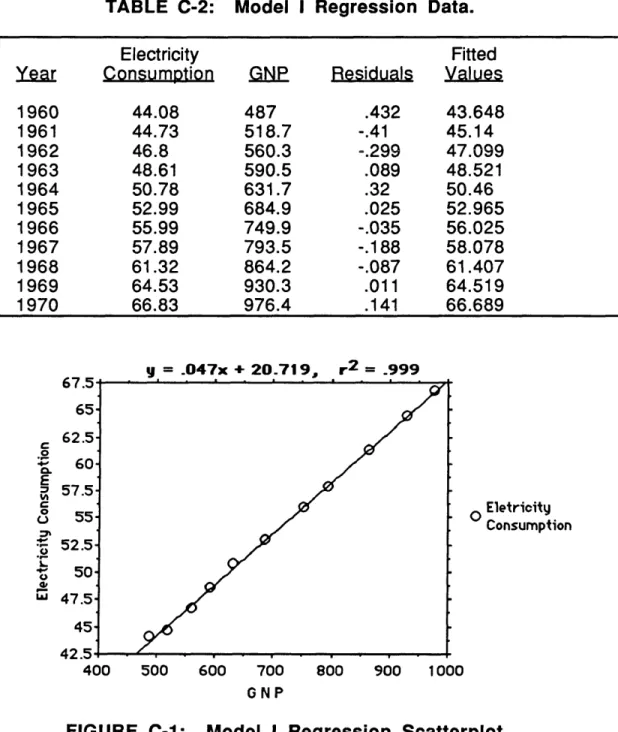
FIGURE C-1: Model I Regression Scatterplot... 74
T - 4051
LIST OF TABLES
Page Table 2-1: Parallels Between an Electric Utility and a Solid Waste
Agency... 12
Table 3 -1: Comparison of Solid Waste and Energy Crises... 21
Table 3 -2: Electricity and Other Energy Index 1945 - 1981... 28
Table 3 -3 : Regression Results for Model 1...43
Table 3 -4: Regression Data for Model 1...45
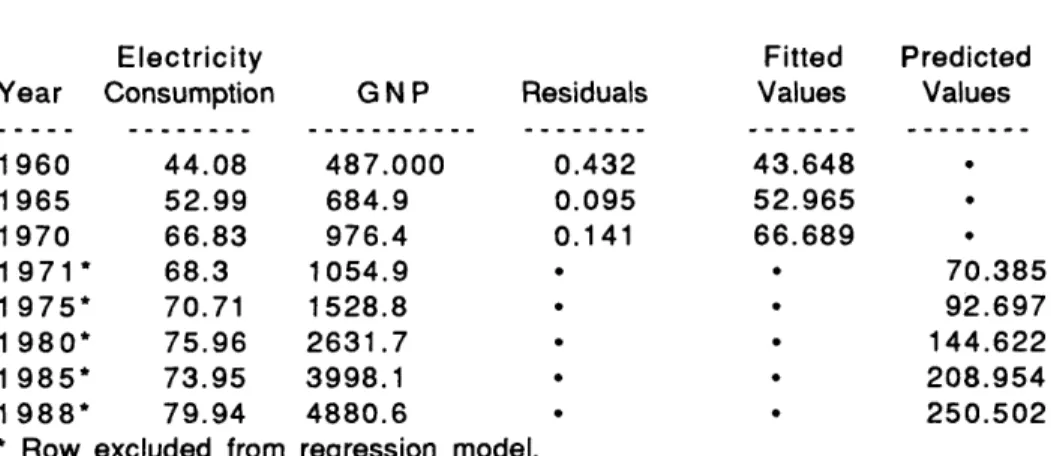
Table 3-5: Predicted Values Using Model 1... 47
Table 3-6: Regression Results for Model II... 52
Table 3 -7: Coefficients of Correlation...55
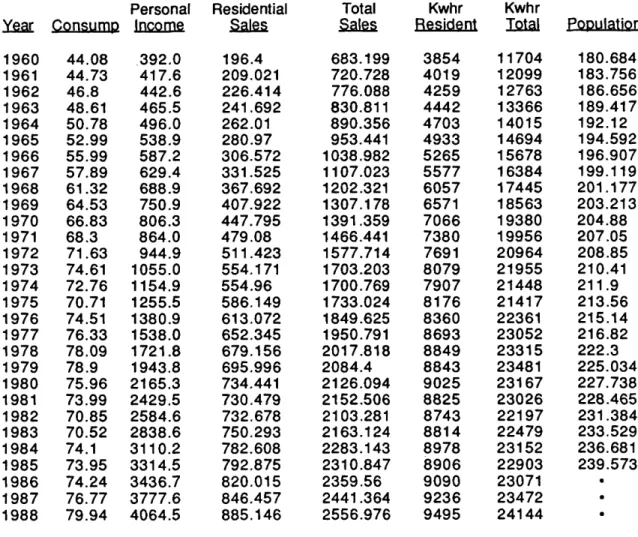
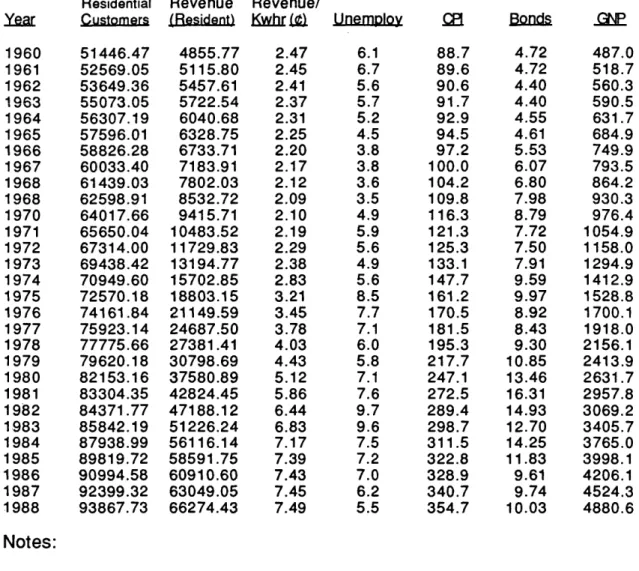
Table B -1 : Energy Consumption and Related Data... 70
Table B -2: Products Discarded Into The Municipal Waste Stream ... 72
Table C -1 : Model I Regression Results... 73
Table C -2: Model I Regression Data... 74
Table C -3: Regression Results for Log-Log M odel... 75
Table C -4 : Model II (log-log) Regression Data... 76
Table C -5: Regression Results for Model II (Normal M odel)...77
Table C -6: Model II (Normal) Regression Data...78
Table C-7: Lack of Fit Test...82
Table C -8: Residual Regression Results... 83
Table C -9: Pearson Product-Moment Correlation for Residuals...83
Table C -10: S2{e} Matrix... 87
Table C -1 1: Pearson Product-Moment Correlation... 89
Table C -1 2: Summary Statistics... 92
T - 4051
ACKNOW LEDGEM ENTS
I would like to thank my parents for providing me with an environment which molded me into what I have become as a gentleman and a scholar.
The expert instruction I received from Dr. Robert Woolsey, Professor Bill Astle and Dr. Robert Underwood made my experience at the Colorado School of Mines exceptional. Dr. Woolsey deserves special thanks for the extra effort that he extended, not only in getting me here, but for what he taught me outside of the classroom.
My fellow students deserve more recognition than anyone would ever know. In particular, Rob Elich gave valuable guidance on the technicalities of econometric and forecasting aspect of this thesis.
W ithout the constant aid of Larry Beaumont, I would not have this opportunity to acknowledge anyone regarding this thesis. To him, I am thankful.
Last I would like to thank my most special friend in all the world, my wife Laurie, for all the support she has given me, whether I was at home or at school. Thanks to all of you, you will always have a special place in my heart.
T - 4051 1
CHAPTER 1
INTRODUCTION
The normal mechanisms that work so well in providing consumers with the products they want, often do not provide adequate financial incentives to encourage stewardship in the disposal and recovery of used products. Local governments typically have, and are faced with increasing quantities of waste requiring disposal. While recycling, composting, and incineration are leading to larger quantities of waste diverted from landfills, population and economic growth have resulted in no net reduction in the 130,000,000 tons of garbage we send to landfills in the United States each year (1).
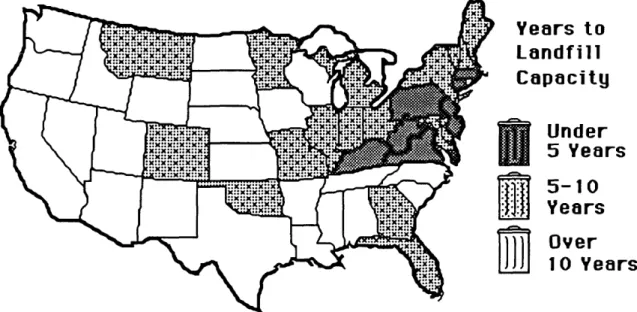
In many states, there is very little landfill capacity remaining. Even in Colorado, experts estimate that there are only between 5 and 10 years of landfill capacity remaining in the state (2). Also, new EPA regulations have reduced the number of landfills that meet specifications for use, without considerable upgrading costs. We simply must find new ways to reduce the amount of trash we produce, and manage its disposal better.
In an article entitled “How Can Communities Judge the True Cost of Solid Waste Management?,” Solid Waste & Power. October 1989, Mr. E. Larry Beaumont proposes that solid waste should be managed in a manner similar to public service agencies, specifically with electric utilities. He poses the following problem (3):
T - 4051 2
Many providers of solid waste management do not think of them selves as public service agencies, since they provide fragmented, disconnected pieces of the total system. What happens when a new law suddenly requires closure of the landfill? Or what if a m unicipality is required to implement recycling? The effect on these fragmented “agencies” can be devastating, with interruptions in service, angry ratepayers, and an uncertain, reactive future.
Mr. Beaumont saw that drawing of parallels between solid waste management and electric utilities could result in management models for solid waste “utilities.” He further saw, as a result of extensive experience with the solid waste problem on the Eastern Seaboard, that the current solid waste crisis might have parallels with the “energy crisis” of the 1970’s. He believed that the lessons necessary to solve the solid waste crisis, may have already been demonstrated in a similar crisis, and all that was remaining to be done was an analysis of the one, relating it to the other.
As a result, R. W. Beck and Associates asked me to conduct this study, an analysis of the effects of the “energy crisis” on residential energy consumption, and its parallel crisis: solid waste management. This study has been made using methods of operations research, including an economic and statistical analysis.
Chapter 2 discusses in detail the methodology that I have used in conducting this analysis. However, to provide some focus from the outset, I will briefly describe what I have done here. In conducting this analysis, we are concerned about common factors that affect energy consumption and solid
T - 4051 3
waste generation, for example, cost of services, gross national product (GNP), and some measure of population. Using the forecasting techniques described in the following chapter, I have used models that will suggest how elastic these factors are over a long period. In this case we have used the period from 1960 to 1988, since it incorporates the period of crisis years, 1973-75, 1980-83, and
1985-86.
The models used in this analysis are not intended to provide an accurate forecast of consumption in the future. Instead, they will provide answers to questions about the elasticities of the various factors affecting consumption in the past, and which correspondingly, may affect solid waste generation in the future. We are interested in discovering how these factors affected consumption during the entire period from 1960 to 1988, collectively, in the presence of recurring crisis conditions. This need has dictated the models that I have used.
There appears to be no previous work related to this thesis topic. Specifically, there has not been an attempt to compare energy and solid waste, or to use the results of an analysis of the energy crisis on energy consumption to say something about the effects of the solid waste crisis on solid waste disposal. However, the volumes of work regarding the energy crisis itself, could hardly be contained in an average college library. Therefore, in analyzing the “energy crisis” and energy consumption, I have been able to recover a large amount of previous work to assist me. However, in drawing parallels to solid waste management, I have depended on the expertise of R. W. Beck and Associates.
T - 4051 4
It is somewhat misleading in talking about the amount of work available for reference on energy consumption and the energy crisis. More than 90% of this published work was researched from 1970 to 1980. Very little information is available regarding forecasting models used before 1970, and very little has been published since 1980 (although much work is still carried out by private consulting firms). Even less has been published since 1980, analyzing the “energy crisis” (which may still be in progress), and much of the material may be outdated.
It would seem that I have the good fortune to analyze this problem with the 20/20 vision of hindsight. Thus, I would contend that this study is more a historical study of the past, yielding lessons learned for the future, rather than a forecasting tool for things yet to come. Therefore, my magnificent contribution is a statement, supported with historical facts, and analyzed with tools of operations research, maintaining that we do not need to go through another “crisis” to learn how to fix our current problems. This study will show the need for fresh thinking in “environmental economics.” Traditional approaches to supply and demand may need radical change if we are to solve the solid waste and other impending environmental crises.
Before I present an annotated bibliography of the background research, I think it is necessary to understand that a direct analysis of the solid waste crisis and solid waste disposal is not feasible at this time. Due to the deficiencies inherent in most solid waste management systems today, the type of data
T - 4051 5
needed to do a direct analysis is inadequate. For example, there is at least one major problem with current measurements of solid waste economics: disposal fees are often artificially low, not covering all long-term costs. Therefore, the data, if not true, is somewhat misleading. An integrated system, as proposed by Mr. Beaumont and the professionals in the field, would begin to overcome these problems by generating accurate cost data (See Reference 3 for details of an integrated system). Currently, however, the true data required is not available, nor is there a system in place for obtaining this data. Therefore, any forecast made in this thesis, regarding solid waste, is purely hypothetical and based solely on parallel electric consumption forecasts. Further, due to the similarities, which are addressed in this thesis, we will be able to say something about the factors affecting solid waste disposal, using the elasticities obtained in the study for energy consumption. We do have data on the total amount and type of solid waste disposed of in the United States, from 1960 to 1986, that will allow us to compare solid waste generation to energy consumption.
Keeping in mind the comparative nature of this problem, the following annotated bibliography contains references that seemed to be most pertinent to the problem that is posed in Chapter 2.
1. U. S. Congress, Office of Technology Assessment, Facing America’s Trash: What Next for Municipal Solid W aste. OTA-O-424 (Washington, DC: U.S. Government Printing Office, October 1989).
A study on municipal solid waste (MSW), requested by the House Com mittee on Energy and Commerce, the House Committee on Science, Space, and Technology, and the Senate Committee on
T - 4051 6
Environment and Public Works, in anticipation of the reauthorization of the Resource Conservation and Recovery Act. The report discusses the options for a national policy based on the dual strategies of MSW prevention and better management. It also presents options to address immediate problems such as increased interstate shipments of MSW and unfinished Federal guidelines for landfills and incinerators.
2. E. Larry Beaumont. “How Can Communities Judge the True Cost of Solid Waste Management?”, Solid Waste & Power. Vol.3/No.5, 5 October 1989, 26-33.
This article discusses how the current system of municipal solid waste management hides many of its costs from the public, making it difficult to compare new options. The author suggests accounting for solid waste operations using utility-like methods. He maintains that, in this way, options can be compared on true overall costs. This article also introduces public service agency parallels.
3. State of Colorado. Interim Report of the Governors Task Force, on Integrated Solid Waste Management. January 1990.
In August 1989, Governor Romer created the Integrated Solid Waste Management Task Force to study the existing status of solid waste management in Colorado and develop recommendations leading to a comprehensive plan for the state. This interim report summarizes the status of the issues and presents some short-term recommendations. 4. Melinda Beck, et al. “Buried Alive,” Newsweek. 27 November 1989, 66-76.
This article discusses the crisis of running out of space to put our trash. It includes some national and regional statistics, and discusses the various sources and recycling of MSW.
T - 4051 7
5. Reid Lifset and Marian Chertow. “Pay-As-You-Throw Is the Solution To the Waste Management Crisis,” Governing. May 1990, 74.
This article discusses the historically low fees for trash collection, and using the city of Seattle as an example, presents a case for charging for solid waste pickup according to the number of standardized cans a household uses. The author maintains that pay-as-you-throw, deposit laws, disposal bans and packaging taxes are all good ways to undo the free ride consumers and manufacturers have enjoyed at the expense of local government.
6. U. S. Congress, Office of Technology Assessment, Residential Energy Conservation. Vol 1 (Washington, DC: U.S. Government Printing Office, August 1979).
This study focuses on the demand aspect of residential energy use, specifically those functions that consume most of a home energy budget. It leads to the conclusion that the analysis of data on price and consumption, combined with research on consumer motivation, indicates a desire to save money is the principal motivation for changes in energy habits and investment in conservation.
7. Eric Hirst and Janet Carney. “The ORNL Engineering-Economic Model of Residential Energy Use: Structure and Results,” Symposium Papers: Energy Modeling and Net Energy Analysis. Institute of Gas Technology, 1978.
This paper presents the ORNL residential energy use model that was developed to simulate energy use in the residential sector from 1970 through 2000. The model provides considerable detail on annual energy uses by fuel, end use, and housing type. It estimates annual equipment installations and ownership, equipment energy requirements, structure thermal performance, fuel expenditures, equipment costs, and costs for
T - 4051 8
improving thermal performance of new and existing housing units. Thus the model provides considerable detail on residential energy use and associated costs.
8. W. G. Michaelson. “A Utility’s Forecasting Model: The Ideal and the Real,” Energy: Mathematics and Models (Philadelphia, PA. Society for Industrial and Applied Mathematics, 1976).
This paper discusses the uncertainty associated with forecasting energy demand, and maintains that today’s forecasts must have certain essential qualities evident to the decision maker: (a) They must be rational and responsible, (b) They must not be highly dependent on the expectation of deviant behavior of some exogenous variable, (c) They must be able to be made in a reason reasonably short period of time, (d) They must be explainable and believable to a non-forecaster, (e) They must reflect the beliefs and convictions of the forecaster, (f) They must be susceptible to checking and analysis when actual results are available. Each of these six qualities is further elaborated.
T - 4051 9
CHAPTER 2
THE PROBLEM AND TECHNIQUES FOR SOLVING IT
R. W. Beck and Associates asked me to analyze the “energy crisis” of the 1970’s and its effects on the electric utility industry, and to determine if relationships between increased consumer rates and other factors caused the American public to reduce its rate of consumption of energy, and if so, to draw a parallel scenario for the “solid waste crisis” of the 1990’s.
Research conducted in the Eastern United States, by Mr. Beaumont, presents some inherent problem s associated with current solid waste management practices that allow us to draw parallel conclusions about solid waste from an analysis of the “energy crisis” and the pre-crisis electric utility industry. Two of the major problems within current solid waste management are (5):
1. First, disposal fees are often artificially low, not covering all long-term costs (which is true of electricity rates before the 1970’s). For example,
collection costs are often quietly added to property tax, so the public never sees a separate disposal bill.
T - 4051 10
2. Second, solid waste management alternatives are often considered competitors with the existing system and with other alternatives, rather than a
blend of management options.
As a result, according to Mr. Beaumont, “communities compare new te ch n o lo gie s and environ m e n ta lly sound p ractices against current, inadequately funded systems. Either the community does nothing to improve current practices, or, if improvements are recommended, the public is outraged by what they see as dramatically higher disposal fees (6).”
Because of these problems, it is necessary for changes to be made in the current system. For example, adopting integrated solid waste management techniques could bring solid waste management in line with other currently existing public service systems, such as electrical utility management. These techniques include:
1. Adopt an integrated solid waste management system.
2. Consolidate ownership of the solid waste management system to a single entity, either public or private. Free enterprise can be protected through franchising, especially for curbside services. In fact, competition is essential in this area.
3. Establish a clear hierarchy of solid waste management tools to be implemented.
T - 4051 11
4. Establish blended, rates based on variations in type of customer, level of use, and type of waste management behavior to be encouraged.
5. Establish equitable cost allocation through State Utilities Commission regulation.
6. Establish a financing structure allowing econom ically stable implementation of policy-directed alternatives based on total system cost, not stand-alone cost of a single element or potentially competing alternative.
An integrated solid waste management system incorporates every aspect of the solid waste system, including land-filling, composting, incineration, and recycling, and manages waste removal (i.e., curb-side pickup), transport, and disposal. This assures that all alternatives are considered in making the system economical, efficient, and environmentally sound.
Mr. Beaumont proposed Table 2-1, which compares the elements of a typical electric utility with the parallel needs of an integrated solid waste management agency.
T - 4051 12
TABLE 2-1
Parallels Between an Electric Utility and a Solid Waste Agency
Description Electric Utility Solid Waste Agency
Ownership Single Entity
i
Single Entity*
Service Area Control of Electricity Supply Waste Stream Control Service Provided Electric Power Solid Waste Disposal
Assets Multiple plants/
Mix of fuels T ransmission/Distribution Landfill Transfer Stations Collection Vehicles Transfer Hauling Intermediate Processing Waste-to-Energy Compost Other Residues
Residuals Ash; Air Emissions;
Wastewater
Ash; Air Emissions; Wastewater
Financing Revenue Bonds - System Revenue Bonds - System* Cost Allocation Average Cost
Marginal Costs
Average Cost* Marginal Costs
Revenues Blended Rates Blended Rates*
Energy; Recycled Products Rate-payer Classes Multiple - Based on Use Multiple - Based on Use* Encouraged Behavior Energy Conservation
Environmental Protection
Waste Reduction* Recycling
Landfill Preservation Environmental Protection Regulatory Agencies State Utilities Commission
State Environmental Permits
State Utilities Commission* State Environmental Permits* *Kev elements requiring further development for truly integrated activities.
E. Larry Beaumont, “How Can Communities Judge the True Cost of Solid Waste Management?”, Solid Waste & Power. October 1989: 30.
T - 4051 13
Table 2-1 suggests that, to achieve integrated public service agency status, and thus allow the parallel analysis to electrical utilities, a solid waste management agency has the following needs, and to do this analysis, it is necessary to assume that the following can be implemented (7):
1. Consolidation of ownership to a single entity, either public or private. Free enterprise can be protected through franchising, especially for curbside collection services.
2. Control of and responsibility for the entire waste stream.
3. Clear policy direction on the hierarchy of solid waste management tools to be implemented.
4. Blended rates, based on variations in type of customer, level of use, and type of waste management behavior to be encouraged.
5. Equitable cost allocation through State U tilities Commission regulation.
6. Financing structure allowing economically stable implementation of policy-directed alternatives based on total system cost, not stand-alone cost of a single element or potentially competing alternative.
These measures would begin to overcome current inadequacies of solid waste management, as sim ilar measures rehabilitated a sim ilarly troubled electric utility industry.
T - 4051 14
Until recently, it appears that solid waste management costs have been of little concern to the public, even though collection costs receive immediate concern when brought to public attention. However, quantities of waste being landfilled are now approaching the level of crisis that brought energy to the public forefront. Again, what new, creative implications can be uncovered to provide incentives for reducing the generation of garbage?
In conducting this analysis, I propose to use the following operations research solution method:
1. Use econometric and forecasting techniques to develop a model for forecasting electricity consumption before 1970, and to analyze the economic factors effecting energy consumption during the energy crisis, using previously developed models.
2. Use explanatory or quantitative (causal) methods of forecasting, specifically statistical regression analysis, to determine if there is a relationship between electrical energy rates (per kwh), or other factors, and electrical energy consumption (per kwh).
3. Given that relationships exist, use explanatory or causal methods of forecasting and applied statistical methods to understand how these factors influenced reduced consumption, and to examine any economic trends that occurred during the energy crisis of the 1970’s that are related to this.
T - 4051 15
4. Use economic analysis and forecasting to draw a parallel conclusion for municipal solid waste removal rates and solid waste production, for the
“solid waste crisis” of the 1990’s. Introduce the concept that widespread implementation of solid waste “utilities” could lead to reduced amounts of municipal solid waste generated, as parallel economic factors, programs and incentives reduced energy consumption.
The first task of forecasting is to find the cause and effect relationship by observing the output of the system (either through time or by studying a cross section of similar systems) and relating that to the corresponding inputs.
Quantitative forecasting can be applied when three conditions exist:
1. Information about the past is available.
2. This information can be quantified in the form of numerical data.
3. It can be assumed that some aspects of the past pattern will continue into the future.
In this study, these conditions exist. There are some very reliable forecasting models that were formulated during the period from 1971 to 1980, that capture these relationships, and provide good forecasts, given the consumption levels of 1981 through 1988. However, models before 1970 are difficult to find in literature, and were inefficient in any case (8).
T - 4051 16
Lester B. Lave, in a Resources for the Future Research Paper, says the following concerning early forecasting models (9):
Before 1970, the models were rudimentary. While some of the supply m odels were sophisticated, demand m odels were universally crude... Energy models formerly consisted of either a direct link between energy and GNP or a partial equilibrium model with demand a function of energy price, income, and price of substitutes. The implication of these models are predictable: energy use will continue to increase as rapidly in the future as it did in the past and will be affected little by price increases.
As a result, I will formulate a model that reflects the mind-set of both forecasters and public service utilities of that era, to demonstrate the error in underestimating the impact of the cost of services on consumption in general, and on energy in particular, remembering all this time what has been said about the artificially low prices of solid waste disposal services.
Also, I will use the current econometric methodology to construct a more accurate model, to demonstrate the role of the cost of services in reducing the rate of consumption of energy. Since we want to know how much a given independent variable, such as cost per kilowatt hour, effects consumption, we want to examine elasticities. So, we will use a model reflecting the natural logarithms of both the dependent and independent variables, the log-log model. This will give us the elasticities of each variable as the coefficients of the variables in the model.
T - 4051 17
CHAPTER 3
ECONOMIC AND REGRESSION ANALYSIS
This analysis is concerned with electrical energy consumption, and what causes variations in energy consumption. The questions that we want to answer in this this regard, dictate the models that we will use. The combination of our data analysis and economic analysis, as well as an understanding of the historical development of the public utilities, would indicate that we have a need to examine two different regression models, as noted in Chapter 2, covering two different periods, and involving different mind-sets: 1960-1970, before the industry increased rates or experienced the full impact of crisis (historically, models for this period were inadequate); and 1960-1988, after the rates increased, and the adjustm ent to the financial, political, societal, and environmental aspects of the energy crisis were realized and caused the industry to reevaluate the management methodologies. Including the years from 1960 to 1970 in the second model will give us a model that accounts for the impact of energy crisis years.
This chapter is organized as follows. First, I will discuss the "energy crisis" in general terms, and its overall economic effect. Also, I will compare it with the current “solid waste crisis”. Next, I will present an economic analysis of the decline of the electric utility industry and the changes in electricity
T— 4051 18
consumption that corresponded to these changes. This decline refers to problems encountered by the electric utilities after its early success as an industry. Finally, I will present an econometric regression analysis, applying the tools of quantitative (causal) forecasting, to support the conclusions of the economic analysis.
3.1. The Energy Crisis.
In October 1973, the Arabic world placed an embargo on crude oil to pressure the West into turning support from Israel, and instead lend support to the suppliers of the precious commodity, oil.
Rt. Hon. Nigel Lawson M.P., Secretary of State for Energy of the United Kingdom, remarked in retrospect: "Initially the great oil crisis of 1973 was perceived as a problem of an actual physical shortage of energy... pretty soon it was clear that the real problem was something else altogether, namely the quadrupling of the price of oil virtually overnight and this certainly was serious business, presenting the world economy with an appalling adjustment problem
(10)."
According to G. Tyler Miller, Jr., Professor of Human Ecology and Coordinator of Environmental Studies at St. Andrews Presbyterian College, five main factors led to the energy crisis (11):
T - 4051 19
1. Our total and our per capita energy consumption had been continually rising rapidly.
2. The demand for oil and natural gas had outstripped the domestic supply and refining capacity, producing an increased dependence on imports.
3. Because all energy use pollutes to some degree, the increased use of energy had come into direct conflict with our need to preserve the air, water, and land.
4. The lack of a coordinated national energy policy had led to poor long range planning and to conflicting policies on the part of government and the energy industries.
5. Potentially useful energy options such as solar, geothermal, nuclear fusion, wind power, and energy conservation had not been developed.
In 1979, some experts posed an Integrated Energy Plan for the United States as a solution to the crisis. Its scope was long term, incorporating three phases: Short Term (present to 1985), Intermediate (1985 to 2000), and Long Term (2000 to 2020). Some of the elements of the first phase included (with milestone dates omitted): establishment of a National Energy Agency at cabinet level, development of national policy, establishment of a national data bank on all energy resources and use patterns, institution of therm odynam ic bookkeeping for all energy resources and options, declaration of an energy education year to inform the American public of the nature of the crisis,
T - 4051 2 0
reduction of growth rate of energy consumption, breaking up the vertical and horizontal monopolistic structure of energy companies, implementation of an energy conservation program, institution of higher rates for large electricity and natural gas users, provide economic incentives for recycling industries, and greatly increase recycling of paper, aluminum, and steel (60% by 1985) (12).
Two measures that are often overlooked in the integrated energy plan, were the requirement for all new cars to achieve an average of 20 miles per gallon, or be taxed proportionally, and the enactment of legislation requiring all new appliances to meet higher efficiency standards. These were important factors in the reduction of the growth rate of consumption, although more difficult to measure than cost of energy in a statistical analysis. Note that recycling was a factor during the energy crisis, as well as the solid-waste crisis.
A further factor that is difficult to measure quantitatively is the reaction of the American consum er to the panic incited by the crisis, and to their conservation efforts due to education about energy consumption and mass media attention of the crisis. This factor, along with the previous two factors, will be accounted for in our subsequent model using a dummy variable.
If a comparison is made of the factors that caused the “energy crisis” to those that are affecting the “solid waste crisis”, we can easily see similarities (See Table 3-1 on next page). For the purpose of analysis, we will talk about the two crises as if they were the same, due to these similarities.
T - 4051 21
TABLE 3-1
Comparison of Solid Waste and Energy Crises
Energy Crisis
(1) Our total and our per capita energy consumption had been continually rising rapidly.
(2) The demand for oil and natural gas had outstripped the domestic supply and refining capacity, producing an increased dependence on imports.
(3) Because all energy use pollutes to some degree, the increased use of energy had come into direct conflict with our need to preserve the air, water, and land.
(4) The lack of a coordinated national energy policy had led to poor long range planning and to conflicting policies on the part of government and the energy industries.
(5) Potentially useful energy options such as solar, geothermal, nuclear fusion, wind power, and energy conservation had not been developed.
Solid Waste Crisis
(1) Our total per capita of solid waste tonnage is continually increasing.
(2) The demand for disposal sites, i.e., landfills, has outstripped the domestic capacity in many cities and is beginning to outstrip capacity in others.
(3) Because of health hazards, eyesores, and pollution, solid waste disposal is coming into direct conflict with our need to preserve the air, water, and land.
(4) The lack of coordinated state and municipal policy has led to poor long range planning and conflicting policies.
(5) Alternate disposal methods such as recycling and incineration, are not being fully utilized.
T - 4051 2 2
According to econom ic theory, if we exam ine the concept of consumption, we will see that the more we consume, the more we will have to dispose of. Our consumption habits generally follow the same patterns, whether they be the consumption of gas, electricity, food, etc. Solid waste is subjected to many of the discrim inators that typically constrain other consumption issues: more stringent governmental (EPA) standards, increased public awareness through education and mass media, perhaps increased cost of services, and ultimately, reduced available space to put it.
Energy, too, suffered these things: stringent governmental standards, increased public awareness through education and mass media, increased cost of services, and ultimately, no more energy to consume. The energy crisis was like a splash of cold water in the face on Monday morning; it caused us to wake up from our dreamlike life-style, and to face reality again.
However, according to Leonard S. Hyman, the electric utilities were not influenced by the energy crisis alone. In fact, we shall see that there were several events and factors that contributed to the decline of the industry as early as 1965. The energy crisis only added more pressure to an already troublesome situation for the utilities (13).
To properly analyze the events and effects that these events had on energy consumption during the “energy crisis”, one must first be familiar with the organization, operation and financial structure of the electric utilities. It is not readily apparent that cost of service, alone, is not the primary factor in the
T - 4051 23
reduction of the rate of consumption, in the decade of the crisis. An understanding of the financial infrastructure, in general, is necessary. The next section analyzes impact of crisis on this infrastructure in detail.
3.2. The Decline of the Electric Utilities.
Leading up to the energy crisis the electric utilities faced four major events shook the foundations of the industry (14).
1. The Northeast Blackout of 1965 — On November 2, 1965, a broken backup relay on the Ontario Hydro system set loose a series of power
disconnections and surges (15). It took twelve minutes from the time the operational interruption knocked out the relay in a little box at the Sir Adam Beck facility to produce the worst power failure in the age of electricity, engulfing 30 million people over an area 80,000 square miles in one form or another of dark reality.
A fte r that event, the Federal Power Com m ission launched an investigation and instituted new reporting procedures to keep track of power outages. Further investigation showed that minor outages had not been uncommon in the past, and that in the years that followed the blackout, there were several noteworthy power failures. The Northeast blackout shook management and regulators out of their complacency, an attitude caused by years of fairly smooth operations.
T - 4051 24
2. The Arab Oil Embargo of 1973-74 — In the wake of the Yom Kippur War, Middle Eastern oil producers cut off shipments to the United States and the
OPEC nations multiplied the price for oil several-fold (16). In response to that action, Americans reduced their consumption of electricity to a previously unimaginable degree. As the price for fuel rose and was passed on to many customers by means of the fuel adjustment clause, price became a determinant in dampening the demand for electricity. In 1974, sales of electricity dropped from the year-earlier level. That was the first time since 1946 that a year-to-year decline occurred. Furthermore, the pattern of steady, rapid growth ceased. The industry had geared its capital spending and expense budget to automatic sales gains. When those gains did not materialize, the industry faced two severe problems. First, it was caught in a squeeze between high fixed costs and declining base rate revenues that resulted from a drop in sales. Second, the industry was uncertain about what to do with a capital spending program that was based on rapid growth in demand. For a while, utility management and regulators viewed the slowdown in demand as an aberration. To the last, management and regulators felt that the American public would ultimately continue to demand power at the same growth rate as before. As a result, management made commitments to build, and those commitments proved to be not only erroneous but also a financial burden in succeeding years. Finally, many utilities had inadequate fuel adjustment clauses, and the rapid increase in fuel costs squeezed margins. The industry reeled from the financial consequences of increased costs and reduced sales. More important, however,
T - 4051 25
was that the era of rapid growth in sales had ended, but the industry’s reaction was delayed.
3. Consolidated Edison Omits its Common Stock Dividend in April 1974 — Consolidated Edison ran into a financial bind that culminated in the sale of some of its facilities to an agency of the State of New York and the omission of its dividend. Con Edison’s dividend omission hit the industry with the impact of a sledge hammer. It smashed the keystone of faith for investment in utilities: that the dividend was safe and would be paid. Wall Street firms, at the behest of panic-stricken clients, prepared lists that showed which utilities were in bad shape. In April 1974, the price for the average utility stock fell by 18%. By September, prices for utility stocks had fallen by 36%. Utility stocks declined well below book value, making future financing dictionary. Partly because of financial pressures, capital expenditures declined in 1975 for the first time since 1962. It was a new era, but unfortunately some did not (or were unwilling to) adapt to the changes (17, 18).
4. The Nuclear Accident at Three Mile Island on March 28, 1979 — On that day, a cooling system malfunction started the country’s first major, well publicized civilian nuclear accident (19). For days, reports of core meltdown, escape of radiation and potential explosion frightened the population of the Northeast. The nuclear reactor finally went out of service after having incurred several hundred million dollars worth of damage. The Three Mile Island accident destroyed the com placency about nuclear power. Anti-nuclear demonstrations attracted thousands (similar demonstrations are occurring in
T - 4051 26
Europe, particularly in West Germany, today). Many investors made it clear that they did not want to own securities in nuclear-oriented utilities, probably less because of fear of the health and safety hazards of nuclear power, than because of the financial hazards.
In 1945-65, Am erica’s energy consumption moved in line with its economic activity, (for example, with GNP) and demand for electricity grew at roughly twice the rate of the economy (20). This might be contributed to the fast pace of the development of electrical appliances, to the discovery of the convenience and cleanliness of electricity, and to smart marketing by electric utilities. These factors helped to create demand, which in turn allowed utilities to reach for greater economies of scale and operation, which in turn sufficiently lowered the price of power to encourage the development and marketing of new electrical devices. Whether the development of new markets occurred because of the drop in the price for electricity, or vice versa, is left to debate. The reality is that price for electricity declined not only on an absolute basis but also in relation to prices as a whole. And, electricity usage grew far faster than energy usage as a whole.
In 1965-70, the trend toward increased use of electricity continued. The price for electricity remained flat despite a sharp upturn both in the overall cost of living and in the price for oil and coal. Other energy sources, such as fuel oil and natural gas, showed greater increases in price (21). In part, the continuing push toward electricity occurred because electricity prices declined in relation to other prices. In part, according to Hyman, it occurred because of fears that
T - 4051 27
supply of natural gas was inadequate, and because increasing environmental awareness caused some users of energy to push their environmental problems onto the electric utility by switching to central station power (22).
In a way, the inability (or unwillingness) of the electric utility industry to raise prices when costs of operation and capital began to rise (possibly because neither utility management nor regulators realized that a fundamental change in costs was taking place) triggered the deterioration of the industry. M oreover the process of deterioration was accelerated because the uneconomically low price for power induced increased demand, which became increasingly difficult to meet profitably at then current rates. Cost of production had started to rise, but electricity was priced as if costs were still declining.
From 1970 on, the industry began to raise prices. Although the price for electricity did not rise as much as that for competing fuels, it increased more than prices as a whole throughout the economy (23, 24). Hyman shows that, in that period, energy consumption grew at a slower rate than GNP as a whole, while use of electricity continued to to grow faster than GNP, although the relative rate of growth between electricity and GNP was less than in any other postwar periods (25).
&BTHUS LAKES LIBRARY C O L C teD O SCSiOOL of MINES
T - 4051 28
TABLE 3 -2 (26, 27)
Electricity and Other Energy Index 1945 - 1981 (1945 equals 100)
Year Energy Real GNP Consumption in USA Generation of Electricity Price of Electricity Price of Natural Gas Price of No. 2 Fuel Oil Price of Bituminous Coal Cost of Living (CPI) 1945 100 100 100 100 100 100 100 100 1950 108 99 143 105 105 146 155 134 1955 133 122 232 97 118 174 153 149 1960 142 137 311 98 136 180 178 164 1965 171 173 427 92 141 192 174 175 1970 215 200 605 92 145 223 278 215 1975 228 222 738 156 293 470 715 299 1980 245 269 880 252 715 1206 866 457 1985 237 319 950 356 789 1659 1012 597
Relative Rates of Growth
Period Electricity to Electricity to
All Energy Real GNP
1945-50 132 144 1950-55 134 134 1955-60 125 120 1960-65 114 129 1965-70 114 109 1970-75 116 122 1975-80 111 98 1980-85 109 82
As can be seen from the table above, the utility industry after 1965 supplied an increasing percentage of the electricity generated in the United States. Industrial generators produced a decreasing percentage of the total, despite the rising cost of central station power. Two possible reasons were that utility power did not reflect the true cost of production and therefore was a bargain, and that industrial producers were not interested in becoming regulated utilities or dealing with the environm ental roadblocks to the
T - 4051 29
production of electricity. In addition, the investor owned utilities continued to gain market share.
Nineteen sixty-five was a watershed year for the electric utility industry. In that year, electric utility stock prices peaked, rate reductions were at their greatest levels, debt service coverage ratios reached a height not seen since, the Vietnam War began in earnest, and the Northeast Blackout showed that all was not well in the electric utility industry (28).
Capital spending soon became a problem. In November 1965, an equipment failure at Ontario Hydro caused the collapse of the interconnected power pools throughout the Northeast, plunging that region into darkness. The Northeast Blackout forced soul-searching within the industry. Perhaps the individual electric companies had insufficient generating capacity in reserve to meet emergencies. Reserve margins had been falling for several years. Perhaps the system of high voltage interconnections between utilities or regions was inadequate to meet emergencies. Although money had to be spent to improve reliability of service, doing so meant an investment that would not necessarily lower costs nor be autom atically associated with increased revenues — as would have been the case if the money were being spent to meet new demand for service (29, 30).
Capital expenditures rose for other reasons as well. As the environmental movement gained popularity, partly due to the Clean Air Act of 1970, utilities beautified plants, converted generating units to less polluting
T - 4051 30
fuels, and put on line equipment that brought them into compliance with new environmental regulations. None of these moves, however, made plants more efficient or helped the utilities to meet the needs of new customers. Furthermore, environmental opposition to utility activities caused delays and revisions in construction programs, thereby adding to costs (31). Those who ran the companies probably found it difficult to understand and to adjust to the new constraints, with the result that conflicts were frequent. Many in the industry saw the situation in superficial terms. They thought that meeting environmental demands meant beautifying substations, putting power lines underground, and designing esthetic, sky blue towers to carry the transmission lines.
Furthermore, not only did the cost of electric plants rise because of inflation, but also because the industry was building a more expensive kind of power plant. The difficulty in securing gas supplies, discouraged utilities from building low cost gas burning plants. Instead, they turned to fuels that required more elaborate generating units. Environmental protection devices added to the cost of equipment. Construction delays and labor productivity problems surfaced during the overheated Vietnam War economy. In addition, the industry had plunged into the nuclear age, and nuclear generating plants cost more to build per kilowatt of capacity, although the higher capital costs were supposed to be offset by lower fuel costs. The industry, however, was dealing with an unfam iliar technology, and one that was feared and opposed by a vocal segment of the population. As a result of technological and political roadblocks, nuclear generating units took longer to build and were more costly than
T - 4051 31
expected, and in many instances proved to be disappointing performers (32).
Consequently, capital spending accelerated, the rate base rose considerably faster than sales, and a large percentage of the needed funds had to be raised by selling new capital. Unfortunately, the sale of securities occurred as interest rates were rising. Paying out increasingly high interest rates on an increasing am ount of debt when income was not rising proportionately caused the decline of the pretax interest coverage ratio. That meant that the industry’s debt was declining in quality, and that, in turn, required payment of even higher interest rates. In short, not only were interest rates as a whole on a secular uptrend, but interest costs of utilities rose even more because utility bonds were becoming increasingly risky (33).
The way to stop the squeeze on margins was to raise the price for electricity or to reduce costs. The industry’s costs previously had fallen sufficiently fast to maintain profitability levels even after reducing (or only minimally raising) the price for power (34). However, productivity was on a downtrend and could not be relied on as in the past. Neither regulators nor management seems to have caught the trend, and critics of the industry showed as little prescience.
Positive rate relief did not materialize for several years. In the interim, both the pretax interest coverage for debt and the return on stockholder investment dropped. Subsequent rate relief was sufficient to raise the ratios to previous levels. Because bond ratings also fell, the utilities had to pay higher
T - 4051 32
interest charges than they would have otherwise, and during crisis periods in the bond markets, some of the poorly rated utilities had difficulty raising money at all (35).
The common stockholder, the owner of the business, also fared poorly. Return on equity investment tapered off. In reality, the drop in return was greater than the numbers indicated because an increasing proportion of that declining return was derived from a non-cash credit in the income statement — the allowance for funds used during construction (AFUDC), also known as interest during construction (IDC) (36). To make matters worse, numerous companies adopted increasingly liberal accounting procedures in other respects to maintain a pattern of gains in reported earnings. One could argue, therefore, that the overall quality of reported earnings also had fallen and that the decline in return on stockholders’ equity was much greater than was apparent from the bare numbers.
According to Hyman, the common stockholders faced two problems, sensitivity of the stock price to the movement of interest rates, and the inability of the com panies to raise return earned while the return on com petitive investments rose. If we consider the market situation after 1965, the return on bonds continued to rise, but the return earned on the stockholders’ investment in the electric utility continued to fall. Investors sold the stocks, thereby causing prices to decline until the return on stocks was commensurate with returns offered elsewhere (37).
T - 4051 33
The result of that combination of lower return on stockholders’ equity and higher interest rates was to cause stock prices to drop until they were well below book values. Utility companies had to raise money by selling common stock below book value (true of almost all electric companies by the mid 1970’s), thereby diluting the interests of their shareholders, and those companies probably invested the funds for a return unfairly low according to regulatory theory. Investors were discouraged by the level of profitability in the industry. Electric utility shares declined on an absolute basis (halving between 1965 and 1975), did worse than the average industrial share, and fell to prices at which new financing was dilutionary and probably damaging to existing shareholders (38).
The industry ran into problems on all fronts when, after 1965, it continued to do what had served so well before: it added increasingly large generating plants. Heat rate did not improve, however, and the cost of incremental generating capacity rose faster than either the cost of living or the utility construction index. New plants were more expensive but not more efficient than old plants. The apparent drop in cost of new facilities after 1978 is due to the inability to put nuclear power plants into service for a while after the Three Mile Island accident. Power plants scheduled through the mid 1980's had costs per kilowatt several times that shown in 1980 and 1981. Fuel prices rose sharply, especially after the 1973-74 oil embargo. David Hawdon shows that the inability to utilize the fuel efficiency, or to offset the effect of the dwindling importance of hydropower with the addition of low cost nuclear power, also led
T - 4051 34
to a sharp rise in the cost of fuel per kilowatt-hour (39).
The overall trends indicated a rising cost of capital, inadequate rate relief, inability to raise productivity, a declining financial situation, and a general inability on the part of regulators and management to cope with the economic and societal problems at hand.
As the 1980’s began, the electric utility industry was in a weakened financial condition. Demand for power had become unstable, and development of nuclear power had been arrested. Many utilities had excessive capacity, and others depended on fuels that were in short supply or subject to interruption by foreign powers. As a result, the electric utility industry seemed ready for a new direction.
This new direction was achieved, but the harshness of the lessons that brought it to this point, was hard learned. Again, management, and regulators were either reluctant to change, or were not attuned to the demand for change. Yet in the long run, these lessons made for a more flexible and efficient industry. Due to some smart management and marketing, faith in electric utility securities has returned to its once secure status.
Finally, what seems to have actually affected our consumption, as much as any other factor, is the public perception of increasing energy prices. Our exposure to mass media, and especially satellite television, will continue to bring national and world crises into the American home, using the current Persian Gulf crisis as an example. This phenomenon should be exploited to
T - 4051 35
bring solid waste disposal problems to the forefront, in an effort to avoid a decline in the quality of American life analogous to the decline of the electric utility industry. In the case of solid waste, we, the people, are the “management.”
3.3. Solid Waste Parallels.
The same underlying causative factors result in growth or reduction in energy consumption and in growth or reduction of the volumes of solid waste generated. These generally include, population, social patterns, technological changes, and economic changes.
Change in population is one of the most important factors affecting waste generation. It underlies all other factors. As the population of the United States grows, more and more people are purchasing and discarding manufactured materials. Similarly, more and more people are consuming energy.
Franklin Associates, LTD., state that there are basic changes that occur in our society that create changes in purchase and discard habits. One of these factors is growing affluence. By any measure, the average person in the United States has had a significant and steady increase in real purchasing power since World War II (40). For example, purchases of goods have risen from $129 billion in 1945 to $1.5 trillion in 1984, an increase of nearly 1,100 percent (41). Likewise, growing affluence causes more people to consume more energy
T - 4051 36
through the purchase of more products that use energy; for example, a family of two adults and two teenagers, might have four televisions, three stereos, and four automobiles.
Other important social factors include the changing perceptions of roles and composition of the work force, a change that has caused significant alterations in lifestyles in the family home. In those homes with two incomes, affluence is a factor in the purchase of more goods. Also, when both adult members of a typical married couple work, there is less time to prepare meals and perform cleanup chores, often resulting in the purchase of convenience foods and disposable items to lighten their chore loads.
Ironically, technological changes affect the reduction and increase in waste generation. Technological advances give us the means to more efficiently dispose of waste, and simultaneously affect work and leisure habits of disposal, as well as the nature of materials disposed. Perhaps the most evident example of technological change is in the advent of computers. In just six years, 1980 to 1985, the total number of computers installed in the United States grew from 1.4 million to 24.2 million, an increase of over 1,600 percent, and computer installations are still growing at over 30 percent per year (42). This was once labeled as a change that would reduce discards of paper, instead it has lead to large increases in the use of computer printers that generate paper to be discarded. Another technological change that alters the volume and composition of discards is microwave cooking.
T - 4051 37
Due to technological advances, energy consuming products become increasingly efficient; however, this efficiency is offset, by the increased use of such products due to growing population and growing affluence.
In simple terms, waste generation in our era is increasing linearly in a sim ilar fashion to energy consumption before the 1970’s, due to sim ilar reasons. (This linear growth can be seen in Figure 3-2 of the next section.) As noted earlier, the cost of waste removal to the consumer is often artificially low, as electric rates were once artificially low. Additionally, environmental and economical issues revolving around solid waste generation and disposal are beginning to receive the same level of attention that energy generation and consumption received at the height of the energy crisis.
Therefore, before beginning the statistical analysis, I conclude that there are parallels between the “energy crisis” of the 1970’s and the current “solid waste crisis.” Likewise, there are parallels between electric utilities management and integrated solid waste management.
3.4. Statistical Regression Analysis.
This analysis is concerned with electrical energy consumption, and what effects this energy consumption. It is our contention, that similar relationships exist in solid waste disposal. Therefore, we wish to estimate the potential reduction in the rate of solid waste generation, based on what we have learned