A KMS Success Model
- Investigating a Consulting Company’s Knowledge Management System
and the Influence of Personalization and Codification-
Bachelor’s thesis within Business Administration Author: Christoffer Lumsden
Emil Backlund Oliver Ihloff
Bachelor’s Thesis in Business Administration
Title: A KMS Success Model: Investigating a Swedish consulting company’s
Knowledge Management System and the Influence of Personalization and Codification
Author: Christoffer Lumsden
Emil Backlund Oliver Ihloff
Tutor: Olga Sasinovskaya
Date: May, 2010
Subject terms: Knowledge Management, Knowledge Management System,
Consulting Company, Codification, Personalization
Abstract
Purpose – The purpose of this paper is to investigate the success of a consulting agency’s KMS, examine the relationships between the factors constituting to its suc-cess, and explore possible effects of the knowledge management strategies codifica-tion and personalizacodifica-tion on these correlacodifica-tions.
Design/methodology/approach – This paper is a case study researching a Swed-ish consulting company’s KMS success using a KMS success model by Wu & Wang (2006). The survey’s results were interpreted using standard multiple regression analysis, which helped to investigate and interpret the correlations between the di-mensions constituting KMS success.
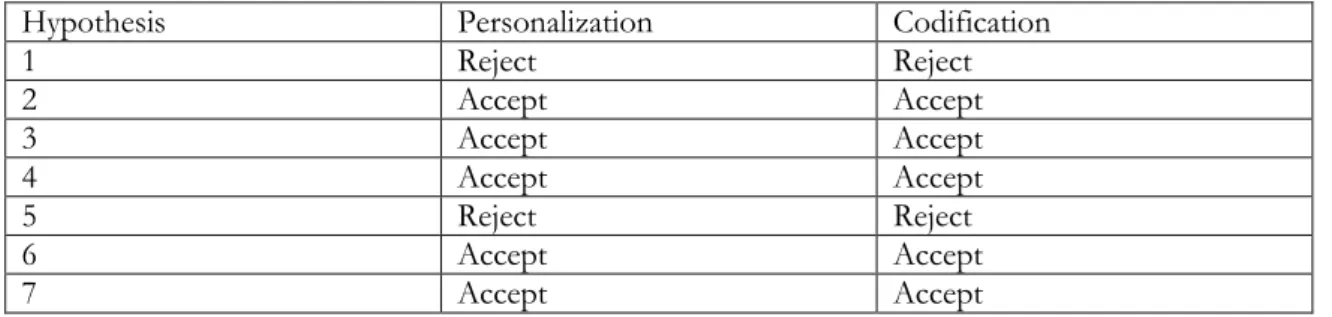
Findings – The findings in this paper suggest that personalization and codification have an influence on the quality of the correlations between the KMS success dimen-sions leaving the overall structure intact. Additionally the influence of System Quality on Perceived KMS Benefits and User Satisfaction on System Use were not found significant.
Research limitations/implications – This study ‘s main limitiation is a sample size and the case study approach, which limit the generalizability of the results to other contexts.
Practical implications – The most important implication of this research is the im-portance of the user for KMS success. A company needs to focus on improving the benefits a user receives from a KMS, which can mainly be achieved by improving the knowledge made available through the KMS, and by providing a proper basis for the KMS, in order to ensure a minimum level of System Quality. Other factors influen-cing the success of a KMS are incentives, which can help to increase system use and the quality of system use.
Originality/value – The paper shows that when researching KMS success one should take the structure of the company’s knowledge management strategy into consideration. It further proves the applicability of the model in different contexts and its validity for accurately measuring KMS success.
Table of Contents
1
Introduction ... 1
1.1 Background ... 1 1.2 Problem Discussion ... 3 1.3 Purpose ... 4 1.4 Research limitations ... 42
Conceptual Framework ... 5
2.1 Knowledge Management ... 52.2 Knowledge Management Systems ... 5
2.3 An Approach to KMS Success ... 9
2.3.1 DeLone & McLean’s IS Success Model ... 9
2.3.2 A KMS Success Model ... 12
2.4 Knowledge Management Strategies ... 15
3
Method ... 17
3.1 Research Approach & Study Design ... 17
3.2 The case study approach ... 18
3.3 Data collection ... 19
3.3.1 Sampling ... 19
3.3.2 Survey Design & Distribution ... 20
3.4 Reliability and Validity ... 21
3.4.1 Reliability ... 21
3.4.2 Validity ... 23
4
Results & Data Analysis ... 28
4.1 Pre-Survey Interview ... 28
4.2 Descriptive statistics ... 29
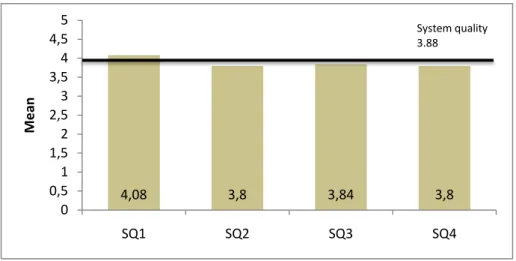
4.2.1 System Quality ... 29
4.2.2 Knowledge or Information Quality ... 30
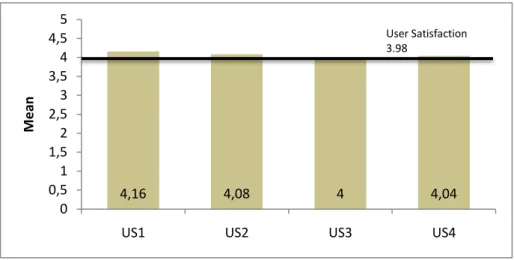
4.2.3 User Satisfaction ... 31
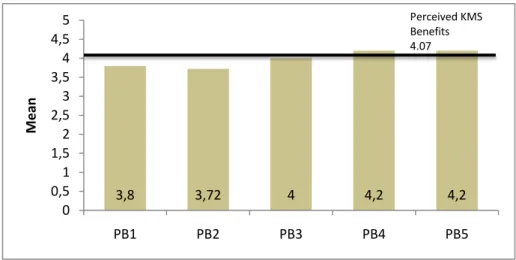
4.2.4 Perceived KMS Benefits ... 32
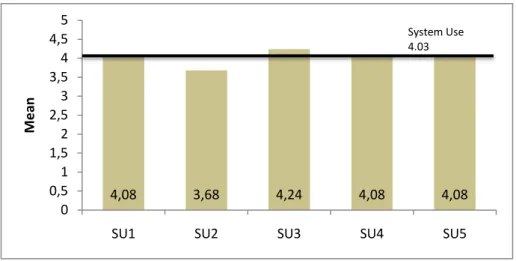
4.2.5 System Use ... 33
4.2.6 Discussion ... 34
4.3 Standard Multiple Regression ... 35
4.3.1 Results ... 35
5
Discussion ... 41
6
Conclusions ... 44
7
Implications & Future Research ... 45
Figures
Figure 2-1 (DeLone & McLean, 1992) ... 9
Figure 2-2 (DeLone & McLean, 2003) ... 11
Figure 2-3 (Wu & Wang, 2006) ... 12
Figure 4-1 System Quality (Personalization) ... 30
Figure 4-2 System Quality (Codification) ... 30
Figure 4-3 Knowledge or Information Quality (Personalization) ... 31
Figure 4-4 Knowledge or Information Quality (Codification) ... 31
Figure 4-5 User Satisfaction (Personalization) ... 32
Figure 4-6 User Satisfaction (Codification) ... 32
Figure 4-7 Perceived KMS Benefits (Personalization) ... 33
Figure 4-8 Perceived KMS Benefits (Codification) ... 33
Figure 4-9 System Use (Personalization) ... 34
Figure 4-10 System Use (Codification) ... 34
Figure 4-11 KMS Success Model (Codification) ... 41
Figure 4-12 KMS Success Model (Personalization) ... 41
Tables
Table 2-1 Codification & Personalization Tools ... 7Table 3-1 Cronbach's Alpha US2 deleted (Personalization) ... 22
Table 3-2 Cronbach's Alpha US2 deleted (Codification) ... 22
Table 3-3 Inter-Item Correlation for System Use (Personalization) ... 22
Table 3-4 Inter-Item Correlation for System Use (Codification) ... 23
Table 3-5 Item-Total Statistics (Codification) ... 23
Table 4-1 Correlations (Personalization) ... 37
Table 4-2 Model Evaluation (Personalization) ... 37
Table 4-3 Correlations (Codification) ... 37
Table 4-4 Model Evaluation (Codification) ... 37
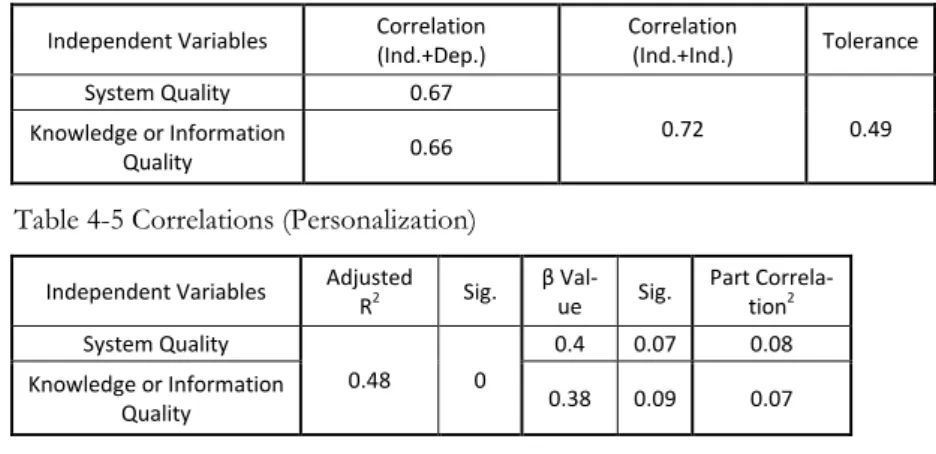
Table 4-5 Correlations (Personalization) ... 38
Table 4-6 Model Evaluation (Personalization) ... 38
Table 4-7 Correlations (Codification) ... 38
Table 4-8 Model Evaluation (Codification) ... 38
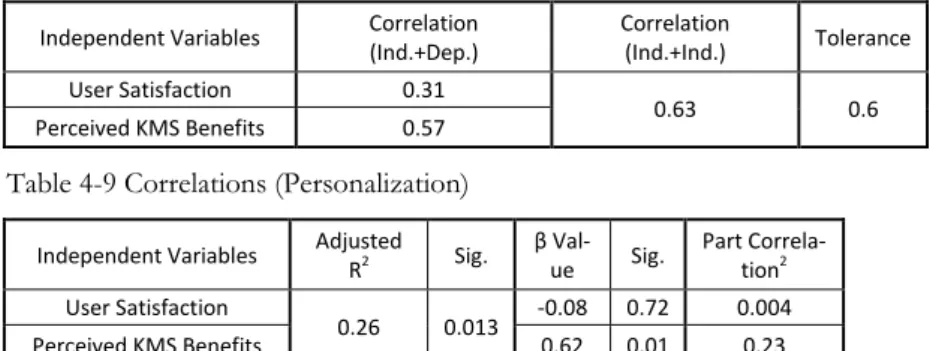
Table 4-9 Correlations (Personalization) ... 39
Table 4-10 Model Evaluation (Personalization) ... 39
Table 4-11 Correlations (Codification) ... 40
Table 4-12 Model Evaluation (Codification) ... 40
Table 4-13 Hypotheses Results ... 40
Appendix
Appendix 1 - Questionnaire – Measuring Knowledge Management System success51 Appendix 2 - Reliability Analysis ... 57Appendix 3 – Demographics ... 60
1
Introduction
As far back as the ancient civilizations of Mesopotamia and Egypt can we trace the creation and management of knowledge, which has been able to propel humans into a modern technological civilization, with marvellous innovations that make our life easier and safer. It is crucial these days for organizations to manage their knowledge in order to remain com-petitive (Teece, 1998; Vorakulpipat & Rezgui, 2008; Ruggles, 1998; Nonaka 1991; Hansen, Nohria & Tierney, 1999; Krogh, Nonaka & Aben, 2001; Huber, 1999). Companies need to be innovative and organizations need to improve their efficiency to gain the most out of the resources available to them. Additionally the service sector’s importance on the econ-omy has increased tremendously over time (Soubbotina, 2000), which marks a shift away to companies, which rely on knowledge as their main resource. According to many research-ers managing knowledge is now the key to keeping organizations and companies innovative and viable in the future (Dyer & Nobeoka, 2000; Brown & Duguid, 1998; Krogh, Nonaka & Aben, 2001; Nonaka, 1991; Ruggles, 1998; Teece, 1998). Nonaka (1991) suggests that we augment our old assumptions of a resource based view of a company (Wernerfelt, 1984 & 1995) towards the knowledge-creating company instead. As the need for innovation and self-renewal increases for an organization so does the value of knowledge as a resource. Now knowledge can create a hard to imitate competitive advantage (Teece, 1998; Grover & Davenport, 2001). As a result many researchers as well as managers have turned their focus to creating ways to optimize how knowledge is managed in organizations (Alavi & Leidner, 2001; Ruggles, 1998; Grover & Davenport, 2001).
1.1
Background
Knowledge Management became particularly prominent with Nonaka’s (1991) definition of the ‘knowledge-creating company’. He states that knowledge is the main source of a pany’s competitive advantage, and the management of this resource is the key for a com-pany’s success. Since then other researchers have joined the research into Knowledge Man-agement and investigate how companies manage their knowledge and how successful dif-ferent strategies are (Hall, 2006; Gammelgaard & Ritter, 2005; Edge, 2005; Assudani, 2009; Ambos, 2009; Greiner, Böhmann & Krcmar, 2007; Hahn & Wang, 2009). Nonaka (1991) furthermore divided knowledge into two different types: tacit and explicit. Tacit knowledge is comparable to know-how and explicit knowledge is the equivalent to know-what (Nonaka, 1991; Brown & Duguid, 1998). Both types have different characteristics, whereas tacit knowledge is very context-specific and consequently hard to disseminate, explicit knowledge is codifiable and therefore easier to communicate (Nonaka, 1991). Hansen et al. (1999) describe two knowledge management strategies, which correspond to the two types of knowledge: codification and personalization.
Codification describes a strategy of collecting knowledge, codifying it and then storing it in some form of a repository, to allow others easy access to knowledge. It is a people-to-document approach, which relies on the transcription of knowledge/information (Hansen, Nohria & Tierney, 1999). This approach is most effectively used with explicit knowledge, for example through the use of searchable databases, reports, value propositions, and case studies.
Personalization tries to encourage knowledge dissemination by enabling direct communica-tion between people, consequently creating and supporting social networks. It is therefore a person-to-person approach, which heavily depends on social interactions to transfer knowledge. This approach is best for managing tacit knowledge, which cannot simply be written down. Presentations, monthly meetings, communities of practice (Gammelgaard & Ritter, 2005; Bosua & Scheepers, 2007; Zboralski, 2009), and communications with know-ledge experts are personalization tools used for managing knowknow-ledge.
What makes knowledge difficult to manage is its bond to the individual or collective from which it was generated (Nonaka, 1991; Fahey & Prusak, 1998; Alavi & Leidner, 2001), as a consequence knowledge is highly personal and hard to formalize (Nonaka, 1991). This makes it necessary to create a shared context and understanding to share knowledge among parties (Alavi & Leidner 2001; Fahey & Prusak, 1998). These obstacles are what knowledge management systems (KMS) are used to overcome, to enable knowledge to flow freely. Knowledge management systems are a particular type of Information System (IS), ‘devel-oped to support and enhance the organizational processes of knowledge creation, stor-age/retrieval, transfer, and application.’ (Alavi & Leidner, 2001, p.114) This is done with the help of tools such as online directories, databases, and many forms of information rich communication channels (Alavi & Leidner, 2001). Knowledge systems can be used to find knowledge, which has been input by other members with access to the system, and it can help to connect people. This is especially important when there is a need to find a person, who generated a certain piece of knowledge, as they have background knowledge. KMS are ultimately there to support users in making decisions and finding solutions to problems (Halawi, McCarthy & Aronson, 2007/2008).
For this study we decided to look at a consulting company, since their purpose is to effec-tively manage their own and their clients’ knowledge. The company is one of the largest professional services firms in the world. The importance of a successful Knowledge Man-agement System is essential for it, as it provides services to other organizations dealing with knowledge management. The company was founded in 1998 through a merger between two large consulting agencies, which created one of the largest consulting firms in the world. Today it has more than 160,000 employees in 151 countries. It serves 26 industries and is focused on assurance, tax, human resources, transactions, performance improve-ment and crisis manageimprove-ment. Since 1933, it has also been active in Sweden and today it claims the market leadership, employing 3,600 employees in 125 locations around Sweden. The focus for this study was on two offices, since they were able to help with the process of distributing and collecting the survey. The Jönköping and Gothenburg office combined have around 330 employees, who aim to help businesses in becoming more secure, effi-cient and profitable. The main tasks involve auditing, risk assessment, corporate finance, and tax advisory.
There are two main factors that make knowledge management and the knowledge man-agement system extra important at the investigated consulting agency, the first factor is the size of the company. There needs to be a well functioning system for knowledge sharing, to be able to coordinate 160,000 employees, all of which generating knowledge. The fact that many of these employees serve the same types of industry, and thus face similar issues, but in different locations highlights this issue. The second factor is the client and employee turnover, since an employee can work with several clients and needs to quickly access knowledge about a multitude of companies, industries, and regions.
The consulting agency identifies the following five competences as their factors of success: 1. Broad competence accessible locally
2. Understanding of the clients culture and business 3. Proactive and professional activities
4. Personal commitment and trust 5. Focus on quality and professionalism
All of these factors involve the communication of knowledge, again highlighting the impor-tance of knowledge management. The company has always had knowledge management in-tegrated in their business, but has only recently started to focus on knowledge management as a business function. There is no dedicated KM manager at the Jönköping office. The company’s knowledge management is instead addressed on a national level by the know-ledge management section at the Stockholm office. The section was set up in the beginning of 2010 as the KM initiative effort in Sweden and comprises 30 employees .
1.2
Problem Discussion
Companies have realized that they cannot afford to let knowledge go to waste, therefore knowledge management has become focus area for management in many organizations. As a result organizations have started creating knowledge management systems (KMS), which help them manage knowledge activities. Many knowledge management system tools like the telephone, archives, and email have been used for a long time in companies, but the emergence of information technology (IT) has created new opportunities to optimize knowledge management (Gammelgaard & Ritter, 2007; Kim & Trimi, 2007; McDermott, 1999). Groupware, intranets, and company-wide databases are just a few examples of ways to reap the benefits of IT. But implementing a new or improved KMS can be challenging for any organization. It has to be adopted by the intended users, it should improve upon past processes and procedures, and in the end give a return higher than its cost. However, just like knowledge itself, it is hard to measure the actual benefits of implementing a KMS (Wu & Wang, 2006; Petter, DeLone & Mclean, 2008; Fahey & Prusak, 1998). There is no way to measure a direct effect on the bottom line of a company (Fahey & Prusak, 1998). The effect a KMS has on innovativeness and competitiveness of a company is a hard-to-measure concept, but it is these benefits received from a KMS that determine its success for a company. How then can a company measure the success from its KMS and which factors determine it? One model by Wu & Wang (2006) derived from DeLone & Mclean’s (1992; 2003) IS success model offers companies a way to measure the success of a KMS by looking at its impact on the work of employees and identifying the areas which are impor-tant to consider when trying to create/implement a good KMS. It also offers a quantitative way to measure the success, resulting in an overview of different areas an organization can focus on when looking at their KMS in detail. Measuring general acceptance, usage and perceived benefits of a KMS can then be used to suggest further improvements of the KMS or reveal problems in particular functions or processes of the KMS, and since the model is using the employees’ perspective it helps management to see what employees need in order to make maximize the KMS usefulness for employees.
1.3
Purpose
The purpose of this paper is to investigate the success of the consulting agency’s KMS, ex-amine the relationships between the factors constituting its success and explore possible ef-fects of the knowledge management strategies codification and personalization on these correlations.
1.4
Research limitations
This study ‘s main limitiation is the sample size of only 25 valid responses, which is lower than the 75 recommended by Stevens (1996) (cited in Pallant, 2001). In order to increase the statistical power of the study’s results it helped to use measures which adjust the results for a smaller sample size, like the adjusted R2 value (Pallant, 2001).
Generalizability is further decreased as this research is following a case study approach (Marczyk, DeMatteo & Festinger, 2005, p.149). On the other hand, the case study ap-proach helped to focus the study on a typical consulting company, and further case studies in other industries could help to compare the relationships of the KMS success dimensions for different industries. This could result in adjusted models for each industry and improve the KMS success models’ value to companies. Furthermore, it would improve the review of models based on DeLone & McLean’s (1992, 2003) IS success model.
This is another limitation of this study. It is based on the model developed by Wu & Wang (2006) which has not been extensively peer reviewed, generally it can be said that no KMS success model was reviewed much by the research community, it seems every researcher always goes back to the model of DeLone & McLean (1992, 2003). Thus it is necessary to find and agree on a KMS success model derived from the IS success model. This model could then be improved, instead of creating new KMS success models.
Further improvements to this and other studies related to KMS success could come from a thoroughly researched and peer reviewed measurement scale for the KMS success dimen-sions. This study employed the same scales as Wu & Wang (2006) did, but currently differ-ent studies use differdiffer-ent measuremdiffer-ent items for the same KMS success dimensions (Wu & Wang, 2006; Halawi, McCarthy & Aronson, 2007/2008; Kulkarni, Ravindran & Freeze, 2006). This is a big issue as the results are not comparable when they measure different things, and since surveys are the basis for KMS success models, a unified approach would boost the value and comparability of models tremendously.
2
Conceptual Framework
2.1
Knowledge Management
Knowledge management deals with controlling the processes of knowledge transfer and creation, which in turn assists companies in attaining a higher efficiency and innovativeness (Grover & Davenport, 2001). It should be a part of the different business processes and over time completely mesh together with the organization according to Grover & Daven-port (2001), so that it cannot be noticed as a specific business process separate from others. The activities of knowledge management can be classified by the following three processes:
Knowledge generation Knowledge codification
Knowledge transfer/realization
(Grover & Davenport, 2001)
Knowledge generation comprises processes involving the ‘acquisition and development of knowledge’ (Grover & Davenport, 2001, p.7). Knowledge codification is the ‘conversion of knowledge into accessible and applicable formats’ (Grover & Davenport, 2001, p.7), and knowledge transfer/realization represents the movement of knowledge to its point of use (Grover & Davenport, 2001). Depending on how a company manages these processes it can leverage its knowledge more effectively (Greiner et al, 2007). Companies realized that value can be extracted from managing knowledge and trying to build and implement a KMS, which aids the activities of knowledge management in an organization.
2.2
Knowledge Management Systems
Knowledge management systems (KMS) are the means by which to put the knowledge management strategy into effect. There always have been personal knowledge management systems for the individual, as they would just reach out for help from somebody they know, who has the knowledge to help solve a problem (McLure-Wasko, 1999). More than ever companies need to locate and map knowledge residing in the company, and extract it to remain competitive and innovative. The advances in information technology (IT) and the creation of information systems (IS) have helped a great deal with these knowledge man-agement processes. ISs consist of three parts: application programs, information resources and/or knowledge bases, and user interfaces, which are used support business processes (Guarino, 1998), essentially any information technology used to help people get specific tasks done. Knowledge management systems are a particular type of IS, which are ‘devel-oped to support and enhance the organizational processes of knowledge creation, stor-age/retrieval, transfer, and application.’ (Alavi & Leidner, 2001, p.114) This is done with the help of tools like, online directories, databases, and many forms of information rich communication channels (Alavi & Leidner, 2001). Unlike an IS, a knowledge management system does not only deal with information though, but it focuses on knowledge and how users across an organization can gain access to knowledge, or the person from who the knowledge originated (Alavi and Leidner, 2001; Gray, 2000; Wu & Wang, 2006; and McLure-Wasko, 1999). Another important difference pointed out by McLure-Wasko (1999) is the ownership of knowledge in a KMS.
A traditional IS’s information belong to the organization, a KMS however manages knowl-edge owned by individuals or communities of an organization. This distinction is very im-portant, as not all knowledge by members of an organization can be codified, and conse-quently might be lost to the organization. If the organization can gain access to an individ-ual’s knowledge and encourage people to share their knowledge, then value can be ex-tracted from an otherwise hard to access source (McLure-Wasko, 1999).
Three common functions of a KMS are:
1) Coding and sharing of best practices
2) Creation of corporate knowledge directories 3) Creation of knowledge networks
(Alavi & Leidner, 2001)
The first point might be the most common and widely used application of KMS (Alavi & Leidner, 2001), which entails the use of repositories to ‘provide information or knowledge to support operations, management, analysis and decision-making.’ (Wu & Wang, 2006, p.729) The second and third functions of a KMS are also very important. The second func-tion basically refers to the creafunc-tion of knowledge maps (Wu & Wang, 2006; & Alavi & Leidner, 2001) to depict who knows what in the company, and how they can be contacted. The creation of knowledge networks refers to the development of communities, which cooper-ate and bring together different specialists, some of these communities can also be referred to as communities of practice (CoP) (Vorakulpipat & Rozgui, 2008; Ruggles, 1998; & McDer-mott 1999).
KMS are an important part to an organization’s knowledge management strategy, because members with access to the KMS can acquire a large amount of information, which can help them solve problems, or get in touch with the right knower. But KMS need to be ‘ap-propriate, accurate and accessible’ (Karlsen & Gottschalk, 2004, p.4) in order to be valued by and successful among its targeted users. Organizations need to create ‘systems, methods and procedures’ (Karlsen & Gottschalk, 2004, p.4), which foster the use of KMS and make it user-friendly. The overreliance on IT can be detrimental to the success of a KMS as well (McDermott, 1999; Davenport & Prusak, 2000), as it misses the management of knowledge, and just becomes another IS. It is therefore crucial to consider the type of knowledge a KMS will manage in a given situation and adapt it accordingly to achieve the best possible user experience (Alavi & Leidner, 2001). It also needs to be aligned with other KM activi-ties and strategies of an organization to be successful. Otherwise, the lack of support might lead to a low acceptance among organization members and ultimately to a useful but empty KMS without users (Alavi & Leidner, 2001)
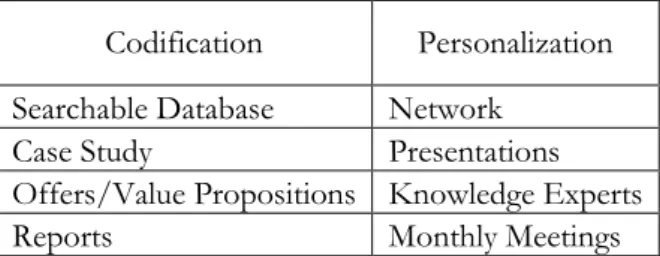
The main knowledge management tools in use at the consulting agency were extracted from an interview with Mattias Eklund, the manager responsible for the company’s KMS in Sweden and listed in table 2-1.
Codification Personalization
Searchable Database Network
Case Study Presentations
Offers/Value Propositions Knowledge Experts
Reports Monthly Meetings
Table 2-1 Codification & Personalization Tools
The KMS tools are explained in detail below, with additional information from KM re-search on each one:
Searchable Database
Searchable databases are used to store many different kinds of documents. Their main function is to simplify the sharing and locating of knowledge. The tool creates an index for other Knowledge Management functions, both personalized and codified. You can through the database find documents about regions, industries and companies, but it also enables you to locate tacit knowledge such as networks and knowledge experts.
Case Study
You can as an employee at the consulting company find reference Case Studies through the searchable databases. This can provide you with a framework for projects and tasks. You will find knowledge about general challenges, solutions and positions with regards to a sce-nario similar to the Case study.
Offers/Value Propositions
You are able to find already established packets of value propositions for services through the searchable database. These value propositions includes estimations of prices, payment conditions, delivery terms and timeframes. This provides knowledge to employees and clients at an early stage.
Reports
The most common use of the searchable databases is to find and upload reports. Every-thing from internal industry reports, client history and financial assessments can be found through the databases. The consulting company has no formal incentive system for en-couraging sharing and retrieving reports. The usage of the system will however contribute to your personal development and advancement in the company
Network
A lot of the tacit knowledge available in a company is hard to transfer. The consulting company works actively to enable the transfer of tacit knowledge by incorporating sharing and searching knowledge into the business culture. Networks are an important tool in or-der to successfully do this. At the consulting company they have established Communities of Practice and what they call Centers of Excellence. These networks are a center to share knowledge and are not limited to departments or countries.
Presentations
Presentations are another way to share the tacit knowledge. The benefit of presentations is that you can more easily communicate tacit knowledge, thus sharing it among individuals. Presentations are also used to inspire feedback and ensure an ongoing discussion.
Knowledge Experts
One method that the consulting company uses to incorporate knowledge sharing in to the business culture is by identifying and using what they call Knowledge Experts. These are individuals within the company that possess unique knowledge within an area. The Know-ledge Experts can then be sent to educate and create networks among targeted divisions that are seen to benefit from the expertise.
Monthly Meetings
Monthly Meetings is a way to share tacit knowledge within divisions, networks and offices. The meetings are set up in order for everyone to be routinely share new knowledge that is generated throughout the company. This provides a basis for discovering and applying new methods and solutions through knowledge sharing.
2.3
An Approach to KMS Success
2.3.1 DeLone & McLean’s IS Success Model
It is not easy to measure the success of KMS directly (Fahey & Prusak, 1998), as some benefits from a KMS, such as improved knowledge flow and innovativeness are hard to measure. Despite this issue research has been rather limited on models measuring the suc-cess of a KMS (Wu & Wang, 2006; Halawi et al, 2007/2008; Kulkarni, Ravindrani & Freeze, 2006). Since KMS is a kind of IS (Alavi & Leidner, 2001) a model that can measure the success of an IS might also be appropriate for measuring a KMS’s success (Wu & Wang, 2006; Petter, DeLone & McLean, 2008). A model that can and has been used exten-sively to measure IS success, is the D&M IS success model (Seddon, 1997), which has been used and adapted in different studies to measure KMS’s success (DeLone & McLean, 2003), therefore it is important to understand its conception.
After reviewing conceptual and empirical studies regarding IS’s success DeLone & McLean (1992, 2003) came up with six dimensions that reflect IS success:
System Quality Information Quality Use User Satisfaction Individual Impact Organizational Impact
DeLone & McLean (1992) combined a temporal process model with a causal model, to de-scribe the process of an IS and understand how each dimension was connected and how they impacted the IS’s success.
Figure 2-1 (DeLone & McLean, 1992)
Their model (figure 2-1) was based on communications research by Shannon and Weaver (1949) and the information influence theory of Mason (1978). Shannon and Weaver (1949) iden-tified three levels in communications: a technical level, a semantic level and an effectiveness level.
The technical level represented the accuracy and efficiency of a communication system, which produces information, the semantic level describes how efficient the communication system is at conveying the meaning of a message, and the effectiveness level illustrated the effect of the message on the recipient (Shannon & Weaver, 1949).
Each of these levels is represented in the D&M (DeLone & McLean, 2003), and measuring how an IS succeeds at each of these levels is the basis for its overall success. Semantic suc-cess was measured through information quality, and use, user satisfaction, individual impacts and or-ganizational impacts are used to measure the success of the effectiveness level.
As can be seen in their model the dimensions were interrelated and therefore close atten-tion was necessary, when defining the dependent variable and trying to measure an IS’s success (DeLone & McLean, 1992). DeLone and McLean (1992, p.88) suggested the model ‘needs further development and validation before it could serve as a basis for the selection of appropriate IS measures.’ After 10 years they re-evaluated their model (DeLone & McLean, 2003) in order to adopt it to the findings regarding this model and address critics. In the research following the proposal of the model in 1992 the links between system use and individual impacts, system quality and individual impacts, information quality and indi-vidual impacts had the strongest empirical support. (DeLone & McLean, 2003) Significant and important determinants for measuring each dimension extracted from the studies are as follows:
System Use: frequency of use, time of use, number of accesses, usage pattern, dependency
System Quality: ease-of-use, functionality, reliability, flexibility, data quality, portability, integration, importance
Information Quality: accuracy, timeliness, completeness, relevance, consistency Individual Impacts: job performance, decision-making performance, quality of
work environment, quality of work
(DeLone & McLean, 2003) All other links between the IS success dimensions were validated by the studies as well, and thus give the model a significant empirical support (DeLone & McLean, 2003).
There was also criticism of the model, DeLone & McLean (2003) addressed the most im-portant ones and adapted their model accordingly or defended it against the critic. One cri-tique was the use of causal as well as process model in one descriptive model (Seddon, 1997). He argued that this can cause confusion as to what arrows in the model mean, since they can refer to a process or influence (Seddon, 1997). DeLone & McLean (2003) admit that it could lead to confusion, but in order to understand IS success as a construct of the different dimension the use of both models is helpful. The process model only consists of three parts: the creation, the use, and the consequences of a system. Every one of these parts ‘is a necessary, but not sufficient, condition for the resultant outcome.’ (DeLone & McLean, 2003, p.16) As an example you can look at system quality and information quality, without the two nobody would use the system, and nobody would know if or not they are satisfied, since the system does not exist. Moreover, as a logical conclusion without any sys-tem that can be used, there is no individual impact, and consequently no organizational im-pact, therefore it makes sense to include a process model.
DeLone & McLean (1992) also wanted to show the relevance each of their dimensions had for IS success, that is why a causal model was useful as well, since it can show how the di-mensions impact IS success.
Another critique that was brought against the model, was the usage of system use as a suc-cess variable (Seddon, 1997), since it describes a behaviour and does not affect benefits. As DeLone & McLean (2003) point out, it is important to consider the nature, quality, and ex-tent of use. When you look at use with in-depth criteria you can extract information about how it is used, and compare it to its intended use, as well as investigate the influence of the how on the other dimensions.
Two advices by DeLone & McLean (2003) were very important for addressing critics. First it is important to consider the research context one is using the model in, the dimensions and measurements have to be adjusted depending on the setting. And here DeLone & McLean (2003) propose the use of established measures, since that adds validity to research and makes it more comparable to other researches using the D&M IS success model. Other researchers need to make sure they know what their dependent variable is, the di-mensions DeLone & McLean (1992 & 1993) have suggested are all a part of success and thus dependent, but variables that cause success rather than reflecting success are inde-pendent. This can possibly lead to confusion and faulty decisions on IS efforts.
DeLone & McLean (2003)enhanced their model and made these three major changes to improve their model’s reflection of IS’s success (Wu & Wang, 2006):
Service Quality was added as a dimension, to reflect the importance of service and support in successful e-commerce systems
Intention to Use was added as a measure of attitude towards an IS, which is influenced by the quality of the IS as well as user satisfaction
Individual Impact and Organizational Impact were combined in the new dimen-sion Net Benefits
The updated model can be seen in figure 2-2.
2.3.2 A KMS Success Model
The resulting model of DeLone & McLean (2003) is a good start to analyze and measure the success of an IS, but needs to be slightly adjusted in order to apply it for a KMS. This chapter takes a closer look at a KMS success model by Wu & Wang (2006), with slightly adjusted dimensions accounting for the differences between IS and KMS. (see Figure 2-3)
Figure 2-3 (Wu & Wang, 2006)
One difference from DeLone & McLean’s model is the changed dependent variable used to judging success, Wu & Wang (2006) use Perceived KMS Benefits for this. They additionally exclude the influence of a direct connection between System Use and the two quality dimen-sions of the system. Wu & Wang (2006) argue that user satisfaction is not caused by using a system, but rather by the quality of the system and its perceived benefits. This distances their model from the process model, where use is a requirement for satisfaction to occur (DeLone & McLean, 2003). Another change is the removal of the service quality dimension, which Wu & Wang (2006) deemed necessary, seeing how Service Quality is not a part of a KMS, but rather an external factor. In short, service quality is a necessity for a good KMS to succeed, but it will not be able to improve a bad KMS. Wu &Wang (2006) decided to drop the Intention to Use dimension as well, since it is only relevant in a setting where the access to the KMS is non-permissible. Under normal circumstances its impact on other factors should be linear with the one of System Use, it is therefore implicitly included in the dimension System Use. A further change was the revision of Net Benefits into Perceived KMS Benefits, which stems from the fact that Net Benefits can be hard to define (Wu & Wang, 2006) and as mentioned by DeLone & McLean (2003) dimensions need to be adjusted for specific research contexts. In this case the context is a KMS and most benefits from it, cannot easily be measured with numerical values, but the ’soft’ benefits described by Per-ceived KMS Benefits are a way to assess the success of a KMS (Fahey & Prusak, 1998).
The model with its adjustments for KMS success can be used to measure the success of the technological dimensions of a KMS from the users’ perspective. In the model System Quality and Information Quality represent the technological dimension, which is the direct overall quality of the KMS. A human dimension is represented through User Satisfaction, Perceived KMS Benefits, and System Use, which represent the effect of the KMS on the users (Wu & Wang, 2006). This approach makes the model very suitable for this paper’s purpose and was used to measure the KMS success at the consulting company. In order to make propo-sitions about the correlations between the different dimensions of KMS success, it is im-portant to look at the dimensions of Wu & Wang’s (2006) KMS success model and pro-pose possible correlations based on a theoretical approach, which can then be tested for through a survey.
System Quality
‘System quality depends on the intended operational characteristics. It is concerned with whether there are errors in the system, its ease of use, response time, flexibility, and stabili-ty. System quality measures the reliability and predictability of the system independent of the knowledge it contains.’ (Wu & Wang, 2006, p.731) This measure is very important for a KMS’s success, as studies have proven that a KMS, which is not user-friendly and opti-mized for its purpose will most likely result in low adaptation and lower benefits (Ajmal, Helo & Kekäle, 2010; Alavi & Leidner, 2001; Hahn & Wang, 2009; McDermott, 1999; De-Lone & McLean, 2003; Rhodes, Hung, Lok, Lien & Wu, 2008; Peel & Rowley, 2010; Xu & Quaddus, 2005; Staples, Wong & Seddon, 2002). As a result it is a dimension crucial to the efficacy of a KMS and therefore a necessary part of any framework aiming to measure a KMS’s overall success. Additionally, the manager responsible for the KMS at the consult-ing company pointed out the importance of a system, which lets users find information fast, and encourages them to share knowledge. Therefore we hypothesize that System Quality has a considerable influence on the Perceived KMS Benefits and User Satisfaction of the KMS at the consulting company.
H1: System Quality has a positive impact on Perceived KMS Benefits. H2 System Quality has a positive impact on User Satisfaction.
Knowledge or Information Quality
‘Information quality has been used as a success measure for traditional IS. In the KMS con-text, the distinction between knowledge and information depends on context and the user.’ (Wu & Wang, 2006, p.731) The information that a KMS supplies to its user needs to be of quality in order to be useful (Rao & Osei-Bryson, 2006; DeLone & McLean, 2003; Staples, Wong & Seddon, 2002). If the users of a KMS find the information useful and of quality they obviously find the KMS more useful, therefore we think that it is an important dimen-sion in a KMS success model. Particularly in for supporting employees in the consulting company it is important to receive useful information, which can aid in problem solving and decision-making processes, thus improving Perceived KMS Benefits and User Satisfaction. H3: Knowledge or Information Quality has a positive impact on Perceived KMS Benefits.
User Satisfaction
‘User satisfaction is one of the most frequently measured aspects of IS success. In addition, it is hard to deny the success of a system which users say they like; thus, user satisfaction is also a good measurement for KMS success.’ (Wu & Wang, 2006, p.731) As KMS is a sys-tem, which intends to improve the management of knowledge in an organization, it relies on its users. If users do not like the system and are very dissatisfied they will stop using the system or only reluctantly engage it for knowledge related processes (Ajmal, Helo & Kekäle, 2010; DeLone & McLean, 2003; Peel & Rowley, 2010; Xu & Quaddus, 2005; Staples, Wong & Seddon, 2002). This makes User Satisfaction an important factor for a KMS’s suc-cess, because only when users of the KMS are satisfied with it, will they be willing to use the KMS and engage in knowledge sharing.
H5: User Satisfaction has a positive impact on System Use.
System Use
System use is a necessity for getting net benefits from a KMS (DeLone & McLean, 2003). The right part of Wu & Wang’s (2006) model would become obsolete without System Use. Just like Perceived KMS Benefits and User Satisfaction it is a requirement for a KMS to be used, if one of these components ceases to exist then users would stop utilizing the KMS. Mak-ing the use of the KMS mandatory could however lead to a diminished usefulness of mea-suring ‘System Use’ as part of KMS success (Seddon, 1997). That is why ‘System Use’ needs to be employed correctly, and in Wu & Wang’s (2006) model focuses on ‘the nature, extent, quality, and appropriateness of the system use’ (DeLone & McLean, 2003, p.16) ra-ther than only the time spent with it. This qualitative definition of System Use makes it an appropriate dimension for measuring KMS success. Wu & Wang (2006) argued that as the quality of system use increases, so should Perceived KMS Benefits, since only when a sys-tem is used to its full potential can a user realize the syssys-tem’s full benefits However, this cannot be tested during this paper, as it requires structural equation modeling to investigate non-recursive models.
Perceived KMS Benefits
‘Perceived system benefit is the degree to which a user believes that use of the system re-sults in benefits to the user or the organization, often assuming that this rere-sults in an in-crease in job performance and productivity.’ (Wu & Wang, 2006, p.731) System benefits are the result of other factors influencing the success of a KMS, such as effectiveness (Wu & Wang, 2006). They can therefore be considered a dependent variable, and are consequently used as the main measure for KMS success in Wu & Wang’s (2006) model. Their model represents the gains users perceive to achieve through the KMS. There should also be a correlation to System Use and User Satisfaction. It is only logical that users will try to use a sys-tem more, which is beneficial, and that they are more satisfied with a KMS, which helps them a great deal.
H6: Perceived KMS Benefits have a strong correlation with User Satisfaction. H7: Perceived KMS Benefits has a positive impact on System Use.
2.4
Knowledge Management Strategies
This study also investigates how the two knowledge management strategies codification and personalization influence the correlations between the dimensions of Wu & Wang’s (2006) framework for KMS success. As a part of this these two strategies need to be defined first. Attention was brought to codification and personalization by Hansen et al (1999), with subsequent research focusing on using them to explain knowledge management in organi-zations (Hall, 2006; Gammelgaard, 2005; Greiner et al, 2007; Merono-Cerdan, Lopez-Nicolas & Sabater, 2007; Saito, Umemoto & Ikeda, 2007).
Codification describes a strategy of collecting knowledge, codifying it and then storing it in some form of repository, to allow individuals or collectives access to it without having been part of its creation (Hansen et al, 1999; Greiner et al, 2007; Hall, 2006; Grover & Daven-port, 2001). It is a people-to-document approach (Merono-Cerdan et al, 2007), which tries to separate knowledge and knower, thus allowing an easier transfer of knowledge. An advan-tage of this approach is the development of economies of scale regarding to knowledge, since knowledge can be reused multiple times after it has been created once, and it could theoretically keep on returning value to the company infinitely (Hansen et al, 1999). On the other hand, this approach can be problematic as it can miss certain nuances of knowledge, which cannot be captured in a codified form. Knowledge has barriers to sharing even when already codified. The one trying to retrieve knowledge will still need to be able to codify the knowledge and have an understanding of the context the knowledge was/is embedded in for it to be useful (Gammelgaard, 2005; Hall, 2006).
Personalization focuses on a social approach to knowledge management (Hansen et al 1999). Under this strategy an organization tries to encourage knowledge dissemination by enabling direct communication between people, consequently creating and supporting social net-works (Hansen et al, 1999; Merono-Cerdan et al, 2007; Grover & Davenport, 2001). The communication between people can be face-to-face as well as electronic, especially today the event of online social networks, intranets and other electronic communication methods made it easier to initiate personal exchanges. The downside to this strategy is the high cost and the amount of time required to facilitate such communication between individuals (Hansen et al 1999).
Each strategy has their respective areas at which it excels, codification can be utilized in set-tings where knowledge can be reused and still gives high returns, whereas personalization is efficient for fostering innovativeness and the creation of very specific problem solutions (Greiner et al 2007). Even though a company can favor on strategy over the other, they will always have both parallel (Saito et al, 2007; Hansen et al, 1999; Grover & Davenport, 2001). In this case study the consulting company has a focus on a pluralistic approach with codifi-cation as the primary knowledge management strategy and personificodifi-cation in a supportive role (M. Eklund, 2010-04-01). This is in line with Hansen (1999), Saito et al (2007), Grover and Davenport (2001), and Gammelgaard et al’s (2005) suggestion that both strategies are interrelated and should be supported by a company in order to maximize the positive ef-fects of knowledge management. However the choice of which strategy to follow depends on what kind of services a company is offering, a more custom-tailored solution approach, or a fast, proven, and reliable solution one (Hansen et al 1999; Kim & Trimi, 2007). Since both strategies are different and encompass different sets of tools, and different approach-es to knowledge management, Kulkarni et al (2006) suggapproach-ested that there might be differ-ences between the correlations of the dimensions of KMS success for codification and per-sonalization. This is important considering that a company might have to initiate different measures to improve the overall success of their KMS.
Consequently this paper looks at the KMS success dimensions for each knowledge man-agement strategy respectively and compares the correlations under both.
H8: The correlations between System Quality, Knowledge or Information Quality, Perceived KMS Benefits, User Satisfaction, and System Use are not the same for personalization and codification respectively.
3
Method
3.1
Research Approach & Study Design
The two research approaches involved when gathering data, are the inductive approach and the deductive approach. The fundamental difference between an inductive and a deductive approach is that the inductive approach aims to create a theory of its own once the data has been analyzed, whereas the deductive approach develops a theory from a hypothesis which then is tested (Saunders, Lewis, & Thornhill, 2007). This research paper uses a deductive approach at first proposing nine hypotheses, which were created following a thorough KM literature review, with particular focus on Wu and Wang´s (2006) respecification of the Delone and McLean´s (1992) IS success model. These hypotheses are tested using Wu & Wang’s (2006) model’s dimensions on data gathered with a survey at a Swedish consulting company. As a result the first part of the paper follows a quantitative research design in form of a case study. The quantitative approach was the most applicable for testing the hy-pothesis, by collecting data and using statistical modelling (Marczyk, DeMatteo & Festinger, 2005). However there are disadvantages to a quantitative approach. The researcher might not gain enough knowledge and understanding of the context in order to draw valid con-clusions (Punch, 2005), but where quantitative research focuses on collecting and evaluat-ing numbers, qualitative studies analyzes data collected in words, helpevaluat-ing to reach an in-depth understanding about an issue (Saunders et al., 2007; Marczyk, DeMatteo & Festinger, 2005). Therefore the second part of this paper follows a qualitative and inductive approach. This dualistic design helps to exploit the strengths of quantitative and qualitative research approaches and helps to minimize the downsides of both (Neuman, 2006). The most common way to conduct a qualitative study is through unstructured or structured inter-views (Sekaran, 2003). For this study it was important to conduct two semi structured in-terviews with the manager responsible for KM at the consulting company. The first inter-view helped to formulate the introduction of the questionnaire and understand the KMS and KM efforts undertaken at the company. A more structured second interview was con-ducted after the survey data was analyzed, in order to make sense of the statistical analysis’ results.
In summary the individual properties connected to the different methods, made us come to the conclusion that our research would benefit the most from a combination of two differ-ent research approaches. The quantitative method using a questionnaire allowed us to use formal measurements and have many observations. The major advantage of using formal measurements is a stricter mathematical interpretation, which initially helps to see patterns over a larger scale (Firestone, 1987). The quantitative method additionally helps to stay ob-jective, and the data is easier to communicate. Additionally the numbers create the oppor-tunity to conduct statistical estimations (Davidsson, 1997). The Qualitative research ap-proach in the form of two expert interviews provided us with knowledge about the context our study was conducted in and helped to understand how the statistical results can be in-terpreted, to make sense when applied to the KM context at the consulting company.
3.2
The case study approach
There are many different ways to conduct a case study and even more definitions to be found in existing literature. However, a common definition of a case study has been pro-posed by Stake (1995). He defines a case study as ‘the study of the particularity and com-plexity of a single case, coming to understand its activity within important circumstances.’ (Stake, 1995, p. xi) For the purpose of this paper it was important to find a company that has KM as a key component of their business, otherwise it would have been impractical to investigate the success of a KMS without one present. The companies within the consult-ing industry rely heavily on knowledge, and in order to deal with the massive flows of knowledge they have developed extensive Knowledge Management Systems (Hansen et al, 1999). Therefore we considered most of the leading consulting firms with activities in Swe-den for our case study, and purposely chose one based in Jönköping, because they were willing to support our research effort. The company is in the service sector with a heavy focus on managing knowledge, it furthermore is one of the most respected consulting firms in Sweden. Through an acquaintance in the Jönköping office, we established contact with Daniel Janson, who was responsible for students cooperating with the company at that time, and who aided us in the initial design of the questionnaire and its distribution. The well established use of KM in the consulting company allowed us to investigate its KMS’s success as a typical case study for a KMS in a company very reliant on KM. Seawright and Gerring (2008) describe a typical case study as a case that is a typical example of some cross-case relations. Observing how the model works within the consulting company for our case allows us to make limited generalizations for other companies with similar KMS and KM approach, mainly other consulting agencies.
Yin (2003) compares the design of the case research to a blueprint that needs to be care-fully constructed in order to be able to achieve the goal of your research. It is necessary to have an unambiguous and transparent case study design before collecting data, in order to achieve high validity for a case study. Yin (2003) identified five components that are espe-cially important to consider when conducting a case study. Yin’s (2003) components creat-ing the foundation of this case study are the followcreat-ing:
The study questions & propositions
Our study questions and propositions are closely related, the main question is the purpose, but at the same time the presented hypotheses act as questions and propositions simultaneously. The case study was the direct result of the need to ful-fil the purpose and test the hypotheses in a meaningful manner, furthermore the purpose and hypotheses guided the design of the survey and data analysis.
The unit(s) of analysis
In order to be able to fill out the questionnaire and contribute to this research the unit of analysis needed to be in contact with a KMS. Consequently in this case study the employees of the consulting company, who worked with the company’s KMS were found the most useful unit of analysis.
The logic links between the data and propositions
This logic link is fulfilled by the employees contact with the company’s KMS, and in order to make sure the data really measured KMS success. The literature review delivered the theoretical foundation of the survey and aided in the processes of analyzing the data and drawing conclusions from the results.
The criteria for interpreting the findings
The criteria for interpreting the findings are based on scientific articles in the knowledge management field, with an emphasis on DeLone & McLean’s (1992, 2003) IS success model and Wu & Wang’s (2006) model for KMS success.
3.3
Data collection
With the framework for the case study established, the next step was to collect data. In or-der to find out about the success of the consulting company’s KMS we needed to collect primary data by asking the employees questions regarding their perception of the KMS. The most suitable and common way to do this when pursuing a quantitative approach is to conduct a survey (Davidsson, 1997; Sekaran, 2003). Since there we decided to use the same dimensions as Wu & Wang’s (2006) model it was deemed necessary to replicate their method of data collection, to investigate the correlations between the dimensions. The logical conclusion was the adoption of Wu & Wang’s (2006) survey’s questions, in order to achieve a certain comparability and improve this study’s validity with tested measures. The survey was distributed among the employees at the consulting company’s Jönköping office by the student coordinator David. During the process of conducting this survey we ad-hered to the 14 stages mentioned by Thomas (2004) (see Figure 3-1) to improve the quality of our data.
1) Define population
2) Obtain/construct sampling frame 3) Decide sample size
4) Choose sampling method 5) Define survey content 6) Decide method(s) of delivery 7) Design survey instruments 8) Design incentives
9) Conduct pilot study 10) Amend survey methods 11) Deliver survey
12) Edit responses
13) Analyse and interpret results 14) Prepare presentation and feedback
3.3.1 Sampling
The sample and population was directly derived from the circumstances and purpose of this study, resulting in the use of a purposive sampling method (Sekaran, 2003). This means that the case study approach limited the population to the employees at the consulting company, who were using the KMS, because only they can answer questions related to the KMS utilized at the consulting company. Therefore the elements, single member of the population (Sekaran, 2003), in our study are all the employees, who are using the compa-ny’s KMS. Three employees, two at the Jönköping office and another one at an office in Gothenburg were responsible for the distribution and collection of the survey at the con-sulting company. The creation of the population frame, was left up to them, since they could make educated guesses, which employees had relevant contact with the KMS, and the time to answer the survey.
Out of the 30 responses forwarded to us, five had to be dropped because of missing values, which left a final sample size of 25 responses out of a total workforce of more than 330 employees (specific number was not obtainable), which results in a response rate lower than 10%, this is below the recommended value of 30% (Neuman, 2006, p. 162), however he also mentions that it depends on the accuracy required and the degree of heterogeneity in the population, and all subjects use the same KMS in a similar environment, facing simi-lar problems the small sample can still be used to investigate trends. Additionally the model used for the analysis is based on established research findings, which diminishes the need for a large sample to do a factor analysis to create a model, but rather allows to explore the correlations between the different KMS success dimensions of Wu & Wang’s (2006) model in a smaller sample.
3.3.2 Survey Design & Distribution
A questionnaire is a very effective method to collect data, when the variables and the area of interest are already known and defined by the researcher (Sekaran, 2003). Hence a ques-tionnaire was the best way to collect data for this case study, Wu & Wang (2006) used a questionnaire in their research, which made a survey the imperative in order to create a comparable study. The design of this survey is trying to explore the correlations between the dimensions of Wu & Wang’s (2006) model at a consulting company in Sweden, there-fore it is an inferential survey (Easterby-Smith, Thorpe & Jackson, 2008). When designing the survey it was important to make sure it could measure the right dimensions separately and allow a subsequent analysis of the correlation between the measured dimensions. In order to ensure proper measurement we relied on the approach of Wu & Wang (2006) and used the same questions as their survey, thus the following description of the measurement items used in Wu & Wang’s (2006) survey is also true for the survey employed for this study, with the difference that the items were used twice to measure KMS success for per-sonalization as well as codification tools.
1. Independent variables
The independent variables describe the left/technological side of Wu & Wang’s (2006) model. Their measurement builds on research assessing the validity of IS success models by Rai, Lang, & Welker (2002) (cited in Wu & Wang, 2006, p. 732) and an 11-item instrument for measuring the context and linkage quality of a KMS developed by Wu & Wang (2006). In summary the instrument looks at the technical qualities of the KMS by investigating Sys-tem Quality and Knowledge or Information Quality. All the iSys-tems of these measures are shown in Appendix 1.
2. Dependent variables
The right/human side of Wu & Wang’s (2006) model consists of the three dimensions Per-ceived KMS Benefits, User Satisfaction, & System Use, which were adopted for the use in this re-search’s survey. User Satisfaction is based on a four-item instrument conceived by Seddon & Kiew (1994). Perceived KMS Benefits is based on five items developed by Wu & Wang (2006) measuring soft and non-financial indicators of KMS benefits for the system’s users. The last dimension to measure is System Use, which measures passive use, which corresponds to knowledge retrieval, as well as active use of a KMS, which corresponds to knowledge shar-ing (Wu & Wang, 2006). Durshar-ing a confirmatory factor analysis Wu & Wang (2006) found these two measures to collapse into one, which consists of five items based on Doll & Torkzadeh’s (1988) research. The specific measurement items can be seen in Appendix 1.
Other measures included in the survey were gender, age, and tenure of the respondents, this was done for descriptive statistics purposes. Additionally almost a full page was used to explain the survey’s purpose, structure, and clarify the two different knowledge manage-ment strategies. It proved to be a crucial addition to the survey, as an initial pilot test of the interview and communications with Daniel showed that codification and personalization were not widely known or used terms. The survey was first drafted in English and tested for its perspicuity by a contact at Earnest & Young, Stockholm. After slight adjustments to the questions the survey was forwarded to Daniel at the consulting company’s office in Jönköping. He helped to refine the survey and improve its comprehensibility, furthermore he recommended to translate the description of the survey into Swedish to avoid any con-fusion. In accordance with his criticism the survey’s introduction was translated and the fi-nal survey drafted.
The final survey used a self-completion approach (Thomas, 2004), relied on the design of our questionnaire for a high understandibility and the on-location availability of Daniel, Jessica Hermansson, and Malin Lyckert to maximize the response rate. All three are repre-sentatives for students, responsible for the communication with students to improve the cooperation between the consulting company and students. It is however not their sole job function, but rather a 2nd responsibility assigned to relatively new employees besides their
main job, for example accountant. This ‘insider administration’ of the survey helped to in-troduce the survey and purpose as well as relevance and meaning of it to the employees, and increases its relevance for the respondents. It also allowed respondents to ask for clari-fications on items of the questionnaire in case of problems in understanding, lastly the timely collection of the questionnaires was another advantage (Sekaran, 2003). The three student coordinators were contacted in person and informed of our thesis and the survey’s purpose, it was clarified that only employees, who deal with the company’s KMS are of in-terest to our survey. Consequently the questionnaire was distributed to staff which uses the company’s KMS. This more focused distribution improved the validity of our data and en-sured the reliability of the responses.
3.4
Reliability and Validity
3.4.1 Reliability
Reliability indicates the occurrence of random errors in a scale (Pallant, 2001). There are two indicators used for measuring reliability of a scale, the test-retest reliability and internal consistency (Pallant, 2001). The retest reliability checks the results of a scale after test-ing it on the same person on two different occasions (Pallant, 2001). This is impractical for our test though, as there will not be another occasion to distribute our questionnaire at the consulting company.
The second reliability indicator is internal consistency, which examines how well ‘the items that make up the scale are all measuring the same underlying attribute.’ (Pallant, 2001, p. 6) The most prevalent statistic used for this indicator is Cronbach’s coefficient alpha, which calculates the average correlation between all items that make up a scale. It ranges from 0 to 1, with values closer to 1 signifying higher reliability. According to Nunnally (1978) a Cronbach alpha value above .7 indicates a reliable scale, with higher values being even bet-ter (cited in Pallant, 2001). Since the data is split into two sets, one for personalization and another for codification, the Cronbach’s alpha for each dimension was examined separately.
Every dimension’s Cronbach’s alpha except for System Use’s exceeded 0.7, thus exhibiting internal reliability, but for User Satisfaction we had to check the Cronbach’s alpha without the item ‘US2’ since it was dropped by Wu & Wang (2006). Despite Cronbach’s alpha be-ing sufficient for User Satisfaction in this study, the item was dropped for comparability during the analysis of the data. This did not let User Satisfaction’s Cronbach’s alpha value drop below 0.7 though, and confirmed a remaining internal reliability of the scale (see table.
Item-Total Statistics
Scale Mean if Item Deleted Scale Variance if Item Deleted Corrected Item-Total Correlation Squared Multiple Correlation Cronbach's Alpha if Item Deleted US2 12,2000 3,417 ,821 ,738 ,836
Table 3-1 Cronbach's Alpha US2 deleted (Personalization)
Item-Total Statistics
Scale Mean if Item Deleted Scale Variance if Item Deleted Corrected Item-Total Correlation Squared Multiple Correlation Cronbach's Alpha if Item Deleted US2 11,4000 2,500 ,849 ,771 ,806
Table 3-2 Cronbach's Alpha US2 deleted (Codification)
System Use’s Cronbach’s alpha value however neither under codification nor personaliza-tion exceeds 0.7. Pallant (2001, p.98) menpersonaliza-tions the mean inter-item correlapersonaliza-tion value as an-other measure, which can be used to judge a scale’s reliability for scales with less than 10 items, which fail to pass the 0.7 mark in Cronbach’s alpha. Since System Use consists of only five items we looked at the mean inter-item correlation for System Use under codifica-tion and personalizacodifica-tion. The mean inter-item correlacodifica-tion should lie between .2 and .4 for a good scale (Briggs & Cheek, 1986), under personalization the value is 0.34 (see table 3-3) and thus acceptable, but under codification it only reached 0.285 (see table 3-4).
Summary Item Statistics
Mean Minimum Maximum Range Maximum / Minimum Variance N of Items
Inter-Item Correlations ,340 -,005 ,898 ,903 -175,473 ,067 5
Summary Item Statistics
Mean Minimum Maximum Range Maximum / Minimum Variance N of Items
Inter-Item Correlations ,250 -,041 ,735 ,776 -18,123 ,067 5
Table 3-4 Inter-Item Correlation for System Use (Codification)
For this case one can use the item-total correlation to check, which items correlate only weakly with the overall dimension, value less than 0.3 are considered low and ‘indicate that the item is measuring something different from the scale as a whole.’ (Pallant, 2001, p.98) It becomes clear that SU1 as well as SU2, which are the first and second question in the ques-tionnaire under the heading System Use, do not correlate well with the other items of Sys-tem Use (see table 3-5). However because the Cronbach’s alpha value was more than 0.6 George & Mallery (2003, p.231) would consider it ‘questionable’, which means it should be investigated but could possibly still be used, in this case since the survey was based on Wu & Wang’s (2006) items and for the purpose of comparability we decided to keep the item. Based on the item-total correlation values SU1 and SU2’s fit with the System Use dimen-sion should be investigated further in future studies.
Item-Total Statistics
Scale Mean if Item Deleted Scale Variance if Item Deleted Corrected Item-Total Correlation Squared Multiple Correlation Cronbach's Alpha if Item Deleted SU1 14,2800 5,293 ,129 ,059 ,701 SU2 14,0800 5,577 ,110 ,093 ,693 SU3 14,4000 3,917 ,512 ,425 ,511 SU4 14,4800 3,677 ,671 ,638 ,423 SU5 14,2800 4,043 ,591 ,544 ,478
Table 3-5 Item-Total Statistics (Codification)
3.4.2 Validity
Validity is a very important aspect of a scientific paper. If the research does not have a suf-ficient validity its scientific value is diminished (Thomas, 2004; Marczyk, DeMatteo, & Festinger, 2005). Furthermore a higher validity increases the accuracy of a study by mini-mizing the effects of outside factors (Marczyk, DeMatteo, & Festinger, 2005). The four kinds of validity are internal, external, construct and statistical validity, which have to be considered for a scientifically sound study (Marczyk, DeMatteo, & Festinger, 2005). The following section is looking at the threats to validity of this paper and how they were minimized.