A study of Swedish listed companies to determine
if their goodwill impairment disclosures comply
with the requirements in IAS 36
Master thesis within Business Administration
Author: El Farran Mirvat, 19921115-1221 Grannas Braf Linnea, 19920828-0280
Master Thesis in Business Administration – Accounting
Title: A study of Swedish listed companies to determine if their goodwill
impairment disclosures comply with the requirements in IAS 36
Author: El Farran Mirvat, 19921115-1221
Grannas Braf Linnea, 19920828-0280
Tutor: Gunnar Rimmel
Date: 2015-05-11
Subject terms: IAS 36, Impairment test, Goodwill, Disclosure and Compliance
Abstract
Purpose – The purpose of this study is to investigate to what extent Swedish listed
companies comply with the disclosure requirements in IAS 36, paragraph 134. The study also aims at assessing whether certain company-specific characteristics could impact companies´ disclosure levels. A greater consideration is given to size (list) variable, among all characteristics.
Method – The study was conducted using a quantitative approach, with a deductive
nature. The data was collected from companies´ annual reports, which were retrieved from the database Retriever Business or directly from the entities´ websites. IAS 36, paragraph 134, was interpreted and transformed into a disclosure checklist, which was used in the assessment of the goodwill impairment notes in companies´ financial reports.The collected data was transferred into scoreboards, which made it possible to assess the compliance level. The research questions were answered through charts and tables and to confirm the findings, a regression analysis was performed.
Empirical findings – The results of this research showed that Swedish listed
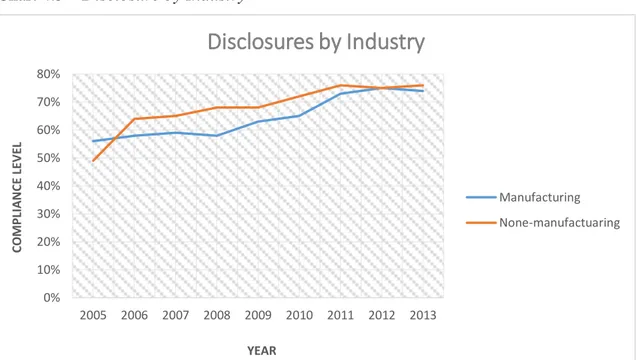
compa-nies do not fully comply with the disclosure requirements in IAS 36. However, mod-est improvements were found over a nine-year period. The greatmod-est increase in com-pliance was shown between the years 2005-2006. It was evident that the highest compliance levels were related to the fundamental criteria and that the more specific criteria contained lower compliance levels. The size (list) and the industry-type turned out to be the only influential variables in this study.
Contribution – The existence of non-compliance stresses the necessity of becoming
conscious of this issue. By emphasizing the issue on non-optimal disclosures, differ-ent parties become aware of it, hence, have a better opportunity to counter the prob-lem.
Originality/value – This study is considered to be unique since it uses a combination
of two approaches in the assessment of certain variables´ impacts on the compliance. The study further takes an extensive time perspective as it observes the disclosure behavior over a nine-year period. The subject is not completely new within the goodwill field since the topic has been debated for many years. However, previous studies have taken a shorter time perspective and have been conducted in different contexts. Statistical testing has been applied in the studies since they usually use a greater number of variables when explaining the compliance levels.
Acknowledgment
The authors want to thank the supervisor Gunnar Rimmel for valuable advices, feed-backs and guidance throughout the whole study. The authors would also like to ex-press their gratitude to the people whose contributions have enabled this study, in particular the opponents. Your enthusiasm and openness has been inspiring and mo-tivating throughout the entire process. All the critique has been important for the de-velopment and improvement of the thesis.
11 May 2015
Jönköping International Business School
______________ _________________
Table of Contents
1
Introduction ... 1
1.1 Background ... 1 1.2 Problem Discussion ... 2 1.3 Research Questions ... 4 1.4 Purpose ... 5 1.5 Delimitations ... 5 1.6 Thesis Outline ... 62
Frame of References ... 7
2.1 Characteristics of an Asset ... 7 2.2 Goodwill ... 82.2.1 Accounting Treatment of Goodwill ... 8
2.2.2 Disclosure of Goodwill Impairment ... 10
2.3 Qualitative Characteristics of Accounting ... 11
2.3.1 Fundamental Qualitative Characteristics ... 12
2.3.2 Enhancing Qualitative Characteristics ... 12
2.4 Previous Research... 13 2.5 Disclosure Theory... 16
3
Methodology ... 18
3.1 Research Strategy ... 18 3.2 Research Method ... 19 3.2.1 Sample Selection ... 193.2.2 Collection of Data for the Main Research Question ... 20
3.2.3 Collection of Data for the Sub-questions ... 23
3.2.4 An Interpretation of IAS 36, paragraph 134 ... 24
3.3 Quality of Method ... 27 3.3.1 Reliability ... 27 3.3.2 Validity ... 28 3.3.3 Critique of References ... 28 3.3.4 Critique of Method ... 29
4
Empirical Findings ... 30
4.1 The Findings of the Swedish Companies´ Compliance Levels ... 30
4.2 The Impact of Company Characteristics on the Compliance ... 33
4.2.1 Size ... 33
4.2.2 Age, Audit Firm and Industry ... 34
4.3 Statistical Confirmation ... 37
5
Analysis ... 39
5.1 Compliance with the Standard ... 39
5.1.1 The Disclosure Trend over Time ... 39
5.1.2 Compliance Level by Disclosure Requirement ... 40
5.2 Reasons for Non-Compliance ... 44
5.3 Company Characteristics that Influences the Compliance Level ... 46
5.3.1 Size ... 46
6.1 Conclusion ... 52
6.2 Discussion ... 53
6.2.1 Contribution of the Study ... 54
6.2.2 Suggestions for Further Research ... 55
List of references ... 57
Charts and Tables
Table 3.1 Sample of the Study ... 20Table 4.1 Descriptive Statistics ... 30
Chart 4.1 Compliance with IAS 36 ... 31
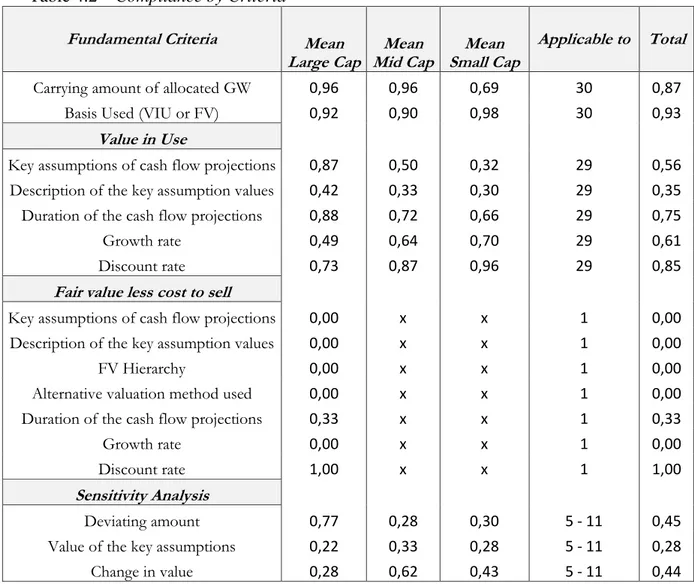
Table 4.2 Compliance by Criteria ... 32
Chart 4.2 Disclosure levels of the three lists ... 33
Table 4.3 Descriptive Statistics: Large Cap ... 34
Table 4.4 Descriptive Statistics: Mid Cap ... 34
Table 4.5 Descriptive Statistics: Small Cap... 34
Chart 4.3 Disclosure levels of the Different Age Groups ... 35
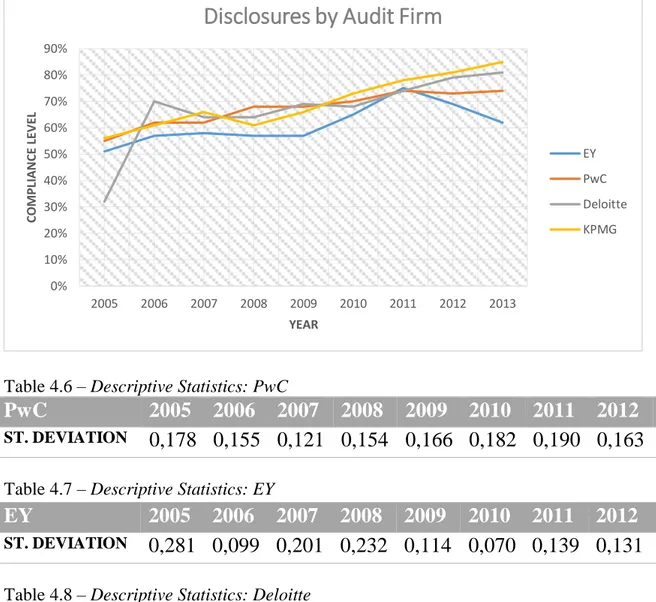
Chart 4.4 Disclosure level by Audit Firm ... 36
Table 4.6 Descriptive Statistics: PwC ... 36
Table 4.7 Descriptive Statistics: EY ... 36
Table 4.8 Descriptive Statistics: Deloitte ... 36
Table 4.9 Descriptive Statistics: KPMG ... 36
Chart 4.5 Disclosure by Industry ... 37
Table 4.10 The Model´s Usefulness ... 38
Table 4.11 Significance of the Model ... 38
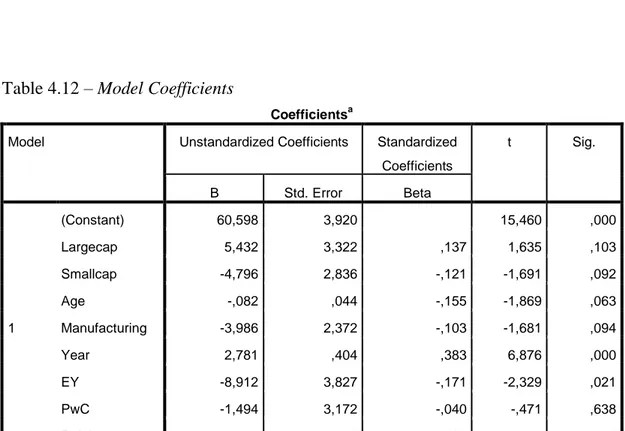
Table 4.12 Model Coefficients ... 38
Appendices
Appendix 1 ... 64 Appendix 2 ... 66 Appendix 3 ... 68 Appendix 4 ... 70 Appendix 5 ... 72 Appendix 6 ... 74 Appendix 7 ... 76 Appendix 8 ... 78 Appendix 9 ... 80Definitions
IASB – International Accounting Standard Board IFRS – International Financial Reporting Standard IASC – International Accounting Standard Committee IAS – International Accounting Standard
NASDAQ OMX Stockholm – The stock market in Sweden
Large cap – A list for large companies listed on the Swedish stock market
Mid cap – A list for medium sized companies listed on the Swedish stock market Small cap – A list for small companies listed on the Swedish stock market CGU – Cash Generation Unit
RR – Redovisnings Rådet
Big Four – The four largest auditing firms: PwC, Deloitte, KPMG and EY
1
Introduction
1.1
Background
International Accounting Standard Board (IASB) is an independent standard-setting or-ganization that issues globally accepted standards, known as the International Financial Reporting Standards (IASB, 2015). The organization was formed in 2001 in London, UK, emerging from a reconstruction of International Accounting Standard Committee (IASC), which was established 1973 (Ball, 2006). Today the framework of International Financial Reporting Standards (IFRS) is applied by at least 120 countries around the world (IASB, 2015).
Since year 2005, publicly traded companies in the European Union are required to re-port in accordance with the framework of IFRS. The purpose with implementation of IFRS was to ensure a more harmonized and comparable financial reporting framework across Europe (European Parliament, EC Regulation, No 1606/2002). The transition to IFRS caused different accounting areas to change in several countries, the accounting of goodwill was one of these changing areas (Chalmers, Godfrey & Webster, 2011). Goodwill is defined as an asset that reflects the future economic benefits generated by other assets acquired in a business combination. Furthermore, the asset can neither be identified individually nor recognized separately (European Commission, IFRS 3, 2011).
The issue of goodwill treatment has passed through several phases over time (Seetha-raman, Sreenivasan, Sudha & Yee, 2006). The adoption of IFRS in 2005 implied that goodwill and other intangible assets with an indefinite useful life was no longer depre-ciated on a straight-line basis. These intangibles shall instead be tested for impairment on an annual basis. Provisions on the disclosure of the goodwill impairment test are stated in IAS 36 (Busiman, 2006). Companies are required to disclose an impairment loss if the carrying amount of the goodwill exceeds its´ recoverable amount. The recov-erable amount reflects the highest of the fair value less cost to sell and the value in use (European Commission, IAS 36, 2010). The impairment tests are usually based upon discounted cash flows, which involves subjective judgments.The requirements in IAS
Committee of European Securities Regulators (CESR) conducted a study to investigate the compliance level with IFRS and concluded that the most problematic areas con-cerned the goodwill impairment test as well as the reporting of business combinations (Glaum, Schmidt, Street & Vogel, 2013). European Security and Markets Authority (ESMA) also reported various concerns associated with goodwill impairment, these in-volved the reliability of the impairment tests, poor disclosure of the underlying assump-tions for the tests as well as disclosures of boilerplate nature. The chairman of IASB, Hans Hoogervorst, further stated that companies tend to recognize goodwill impairment losses too late in time during periods of economic uncertainty (ESMA, 2013).
Duff & Phelps (2014) presented that the European companies during year 2013 reported impairments of goodwill corresponding to an amount of 49, 6 billion, which equals a percentage of 31, 3. In this year, 87, 6 % of the companies in the study had a goodwill item in their balance sheet. One of the industries with the highest goodwill/total asset - ratio in year 2013 turned out to be the information technology sector, were goodwill ac-counted for an average of 23, 6% of the total assets. Duff & Phelps (2014) further states that the possibility of impaired assets increases in periods where the economy experi-ences uncertainties, hence, the expectations of the cash inflows decreases. When the market capitalization of the company falls below its´ book value, the entity should con-sider testing the goodwill item, since it is an indication of the asset to possibly be im-paired. This partially explains why standard-setters and other influential bodies have in recent years put a great focus on goodwill impairment, as well as goodwill in general (Duff & Phelps, 2014).
1.2
Problem Discussion
Reporting in accordance with IFRS has been identified as one of the most difficult areas in practice and the understandability of the disclosures may suffer as a consequence of the complexity of the standards (Hoogendoorn, 2006). Goodwill has over a long time been a controversial topic (Carlin & Finch, 2009). The topic has generated debate for several decades, focusing on the treatment of goodwill and whether it should be recog-nized as an asset in the balance sheet. Moreover, the discussions have focused whether the capitalized amount of goodwill should be subject to amortization or impairment, in
subject to impairment testing as it better presents the economic value of goodwill (Chalmers et al., 2011).
Goodwill emerges from a business combination and the asset can therefore neither be purchased separately nor recognized without an acquisition to take place (Seetharaman et al., 2006). Mergers and acquisitions are seen as the largest investment activities that companies undertakes (Shalev, 2009). Both IFRS 3, which regulates business combina-tions and IAS 36, which treats impairment of assets, states that acquired assets and lia-bilities should be recognized at a fair value. The transition to fair value accounting in 2005 implied a greater scope of managerial judgments in the assessment of the intangi-ble assets´ fair value(Lhaopadchan, 2010).
Phelps & Duff (2014) reported that the amount of goodwill in relation to total assets for some industries accounted for a number as high as approximately 20 %. With an in-creasing importance of intangible assets and a growing proportion of intangibles in rela-tion to total assets, the disclosure towards the public becomes even more essential since it enables the users to assess and evaluate the acquisition.The level of disclosures tends to increase when the management expects the acquisition to be successful in adding value to the company and decreases when the valueis uncertain (Shalev, 2009).
Disclosures of the impairment test are highly associated with management discretion, hence, could fail in providing valuable information to the users (Bepari, Rahman & Mollik, 2014). Goodwill has an intangible nature, which implies that the definition and recognition in the financial reports are highly dependent on how the management has treated the impairment of goodwill (Seetharaman et al., 2006). The estimations of the impairment test lies within the control of the management and the incentive to manipu-late the numbers, when necessary, are present for the companies (Lhaopadchan, 2010). The room for manipulation gives the management an opportunity to decide upon what information to disclose (Charlin & Finch, 2009). This stresses the importance of trans-parent disclosures as it gives the users an opportunity to assess the reliability of the as-sumptions in the test(Glaum et al., 2013).
port delayed impairment losses and, if possible, they completely ignored to report about the loss. With an insufficient disclosure level, users faces difficulties in assessing the re-liability of the underlying key assumptions in the impairment tests (ESMA, 2013). Disclosure of information is seen as an essential tool for the capital market to work at its full potential (Healy & Palepu, 2001). The major source to financial information is con-sidered to be companies´ financial statements and the information that is revealed forms the basis for the decisions taken by the investors (Devalle & Rizatto, 2013). Reporting and disclosure of information serves as a communication channel between the manage-ment and the public regarding the behavior of the company (Healy & Palepu, 2001). Although the standard of IAS 36 requires certain information to be disclosed, compa-nies may consider to not revealing information that would serve them as a competitive disadvantage (Clinch & Verreccia, 1997). Carlin & Finch (2009) further stated that the level of disclosure in practice deviate significantly from the level of information re-quired by IAS 36. Hoogendoorn (2006) supports this statement by classifying impair-ment testing and the activity of revealing information as two of the most complex issues in practice. This implies that the disclosure issue is still in need of improvement (Busiman, 2006).
In a study of Swedish listed companies, it was found that goodwill corresponded to an average of 52 % of the purchasing price of the acquisitions (Gauffin & Nilsson, 2006). The research showed that goodwill represents an undeniably large portion of the pur-chase price, which is subject to annual impairment testing. The interest of the topic aris-es therefore from the importance of goodwill together with a combination of the report-ing complexity in IAS 36 and the attempts by the management to avoid impairment losses.
1.3
Research Questions
The standard IAS 36, Impairment of Assets, contains detailed guidelines on the manda-tory disclosure requirements.The provisions within the standard require specific infor-mation to be disclosed regarding the performed impairment test, such as the underlying assumptions for the estimation of the value of goodwill. The impairment test of
good-Managements´ incentive to assign goodwill with a number that is favorable for them-selves or for the company´s economic wealth is put under pressure in the impairment test. The disclosures of the assumptions and the estimations in the tests are therefore substantial and leads to the following main research question:
Main Research Question - To what extent do Swedish listed companies comply with the disclosure requirements stated in IAS 36?
Previous studies have investigated the relationship between companies´ compliance lev-el and various company characteristics. Similar variables have been used in the studies, however, the characteristics have varied in number. The studies has taken a broad per-spective and included numerous variables, which gives the impression that the degree of compliance is not determined by one single factor but rather of multiple variables. This study will limit the number of variables to size, age, audit firm and industry since these factors have frequently been used in other studies. The first- and the second sub-question will therefore be structured as follow:
Sub-Question 1 – How does the size of the companies affect the disclosure level?
Sub-Question 2 – Is the age, audit firm and industry equally influential as the size in terms of disclosure level?
1.4
Purpose
The main purpose of the thesis is to investigate, from the public´s perspective, to what extent the Swedish listed companies comply with the requirements in IAS 36, regarding the disclosure of goodwill impairment. The public´s perspective mainly refers to the us-ers of the financial reports. The study also aims at assessing which factors that influ-ences the degree of disclosure. Among all variables that will be examined, an extra fo-cus will be devoted to the size-variable.
1.5
Delimitations
The investigation is restricted to Swedish companies, listed on NASDAQ OMX
limitation, the investigation may take a longer time perspective. The study will cover a time frame of nine years, more specifically the years 2005-2013. Only the companies with a recognized goodwill item in their balance sheet, during year 2005-2013, are therefore relevant. When answering the main research question, focus will be put on the disclosure requirements in paragraph 134. However, requirement B in paragraph 134 will be excluded since it treats all intangible assets and not goodwill in particular. Moreover, the study will only consider purchased goodwill, emerging from acquisitions. This implies that both internally generated goodwill and negative goodwill will be ex-cluded. The collection of data will be restricted to companies’ annual reports, focusing on the goodwill impairment notes.
1.6
Thesis Outline
The thesis will be organized as follow: The frame of reference chapter will highlight some of the previous studies within the goodwill field as well as certain related theories. Key concepts related to the subject will be explained in detail. In the methodology chap-ter, appropriate methods will be presented and motivated and the procedure of data col-lection will be addressed.The empirical chapter will present the findings of the study and an analysis of these findings will be found in the next chapter,where the results will be connected to the theories. Finally, a concluding and discussing section will take place, including the authors´ reasoning and suggestion for further research.
2
Frame of References
2.1
Characteristics of an Asset
The resources that companiespossess, which are used in adding value to the entity, are commonly referred to as assets. In general, assets arises through two different ways, companies either produce them by themselves or acquires them. However, alternative approaches may be used to generate assets (IASB Conceptual Framework, 2010). IASB defines an asset as a resource that is controlled by the company and which is expected to generate future economic benefits to the firm (Mackenzie et al., 2013).
There are two recognition criteria for an asset. The first criteria imply that it must be likely for the company to obtain the future economic benefits of the asset (IASB Con-ceptual Framework, 2010). An enterprise may enjoy its future economic benefits through different ways, such as, obtaining revenues from the disposal of an asset, reduc-ing its costs or possessreduc-ing a significant benefit that results from the usage of the asset (Mackenzie et al., 2013). The second recognition criteria of an asset require the compa-ny to be able to measure the value or the cost of the asset in a reliable way (IASB Con-ceptual Framework, 2010).
Assets are usually classified into two categories, namely tangible- and intangible assets (Abu Bakar & Ahmad, 2010). Resources that are tangible possess a physical nature and
have the ability of generating future economic benefits (Yallwe & Buscemi, 2014). The recognition criteria for tangibles are limited to the content of IASB´s definition of an as-set, which comprises of the control- and the future economic benefit requirements
(IASB Conceptual Framework, 2010). Equipment and plant are examples of tangible assets. Resources that lack physical substance but which generates future economic benefits are commonly referred to intangible assets (Yallwe & Buscemi, 2014). Soft-ware, patents, and trademarks are examples of assets within this category (Stolowy & Jeny-Cazavan, 2001). In addition to the control- and future economic benefit require-ment that applies for the tangible assets, intangibles must be identifiable. An asset is seen as identifiable when it is possible to separate it from the company or when its´ emergence arises from a contractual or legal right (European Commission, IAS 38,
(Victor, Tinta, Elena & Ionel, 2012). Therefore, IAS 38 does not apply to acquired goodwill, the asset is instead treated in IFRS 3, Business Combinations (European Commission, IAS 38, 2010).
2.2
Goodwill
Goodwill is seen as a highly controversial asset, partly due to its vague definition (Izzo, Luciani & Sartori, 2013). Goodwill simply represents the difference between the pur-chase price and the net assets acquired in a business acquisition (Hamberg & Beisland, 2014). The asset reflects the future benefits that the company expects to enjoy from the acquisition, which cannot be assigned to a certain asset (Churyk & Cripe, 2011).
Goodwill is normally split into two different groups, internally generated goodwill and purchased goodwill (Bloom, 2009). The importance of purchased goodwill is increasing in the market (Shalev, 2009). Accounting bodies treats these two groups differently by only allowing the recognition of purchased goodwill (Bloom, 2009). Under the regula-tion of IFRS, internally generated goodwill does not meet the recogniregula-tion criteria of an intangible asset and is therefore not capitalized (Mackenzie et al., 2013). However, this prohibition does not apply for purchased goodwill (Bloom, 2009), which is the type of goodwill that is relevant for this study.
2.2.1 Accounting Treatment of Goodwill
The implementation of IFRS led to a shift in the accounting treatment of goodwill (Chalmers et al., 2011). The treatment of goodwill over time can be summarized by three different viewpoints. The first viewpoint proposes to fully depreciate the goodwill value against the company´s equity. The second viewpoint argues that goodwill should be depreciated over its useful life. The depreciation value should be presented in the same year as the asset has generated profits for the company. Lastly, the third view sug-gests that goodwill, emerging from a business combination, has an indefinite useful life and should therefore be tested for impairment on a regularly basis (Jahmani, Dowling & Torres, 2010).
earli-at cost less accumulearli-ated depreciearli-ations and impairment losses. The asset was depreciearli-ated over its estimated useful life, which could not exceed a period of twenty years. If an in-dication of impairment existed at the balance sheet date, the recoverable amount of goodwill was estimated through an impairment test and the impairment loss was recog-nized against the company´s income. RR further permitted the reversal of prior impair-ments, under certain circumstances. The treatment of goodwill is today regulated by IFRS and the asset is instead recognized at cost less accumulated impairment losses. Goodwill is no longer amortized, the asset should instead be tested for impairment on an annual basis. When an indication of impairment exists, an impairment test shall be car-ried out immediately, otherwise, the asset is tested annually. Under the current regula-tion, reversals of prior impairments are prohibited (Persson & Hultén, 2006). IASB claims that the new treatment of goodwill is more successful in providing useful infor-mation compared to prior regulation (Chalmers et al., 2011).
Under the new regime of IFRS, purchased goodwill must be distributed to a cash gener-ating unit (CGU) (Wines, Dagwell & Windsor, 2007). This is due to the inability of testing goodwill separately (Petersen & Plenborg, 2010). IASB defines a CGU as the smallest group of assets, which provides cash flows independently from other asset´s cash flows (Mackenzie et al., 2013). The allocation of goodwill to CGUs shall reflect the expected benefits for each of the CGUs, arising from the synergies. However, the distribution process is associated with difficulties (Mcdonnell, 2005). These difficulties partly involve to correctly addressing the goodwill value to an appropriate CGU that is expected to benefit from the synergy (PwC, 2006).
Impairment tests reflect the procedure used by the company to avoid an overestimation of their assets (Izzo et al., 2013). The first step of the impairment test involves an esti-mation of the CGU´s recoverable amount, to which the goodwill has been allocated. A CGU´s recoverable amount is the higher of its fair value less cost to sell and its value in use. The fair value less cost to sell represents the amount that would be received from an exchange of the asset in an arm´s length transaction, reduced with the cost of selling it. The value in use is estimated by transforming the expected future cash flows of the asset or the CGU into present value (Wines et al., 2007). Once the recoverable amount of the CGU has been determined, this value shall be placed in relation to its carrying
ing value in the balance sheet after a deduction of accumulated amortizations and accu-mulated impairment losses (Mackenzie et al., 2013). If the carrying amount exceeds the recoverable amount, the difference in value is considered to be impaired. The CGU´s carrying amount shall then be written down to its recoverable amount (Carlin & Finch, 2009). The impaired value is recognized as a cost in the income statement (Churyk & Cripe, 2011).
2.2.2 Disclosure of Goodwill Impairment
Disclosure is seen as an essential issue due to its ability of impacting the investors’ be-havior. The information that companies reveal further supports the economic decisions taken by the investors (Devalle & Rizatto, 2013). It is therefore essential for an entity to review the disclosure criteria in IAS 36 to ensure that appropriate and useful infor-mation is revealed to its owners. The standard requires the inforinfor-mation of the impair-ment test to take a business-related approach rather than being prepared in a generic way (Izzo et al., 2013).
IAS 36 is a principle-based standard (Agoglia, Doupnik & Tsakumis, 2011), which con-tains, in paragraph 134, provisions on what an entity is expected to disclose for each of the CGUs. Companies should present the estimated carrying amount of the goodwill or other intangible assets with an indefinite useful life, which has been distributed to a CGU or groups of CGUs. Entities also have an obligation to disclose the basis for the recoverable amount of the CGU, more specifically, whether they have used fair value less cost to sell or value in use in the estimations. Depending on which base the recov-erable amount uses, there are different disclosure criteria that must be met.
If the recoverable amount of the CGU is based on the value in use approach, companies are required to reveal information about the key assumptions that supports how the fu-ture cash flows of the CGU has been calculated. Key assumptions are basically those assumptions that the recoverable amount of the CGU is most likely to react upon. Moreover, a description of how the values of the key assumptions have been estimated and whether these values reflect prior experience or external information sources must be provided. If the values deviate from both past experience and external information
values differs. The time frame in which the cash flows of the CGU have been projected must be indicated and if the period is greater than five years, a motivation must be giv-en. Further, both the discount rate and the growth rate used in the estimation of the cash flows must be stated (Devalle & Rizzato, 2012; FAR Akademi, 2013).
If the fair value less cost to sell is instead applied in the estimation of the recoverable amount and if this value is not based upon a quoted price for an identical CGU or CGUs, additional information needs to be disclosed on this matter. Likewise the value in use approach, this methodrequires the key assumptions to be presented as well as the method used to determine the values of the key assumptions. An explanation of whether the values are assessed in accordance with prior experience or external information sources is also required (European Commission, IAS 36, 2010). In addition to the crite-ria stated for the value in use approach, this method requires the entities to state to which level the CGU´s estimated value relates to in the fair value hierarchy (Izzo et al., 2013). The definition of the fair value hierarchy can be found in IFRS 13 and it com-prises of three different levels. Further, if the valuation technique has changed, compa-nies must inform about this and state the difference in value together with a motivation for the change. If the fair value less cost to sell is estimated by discounted cash flow projections, information about the time period, the growth rate and the discount rate is required to be revealed (FAR Akademi, 2013).
If there exists a reasonable possibility of the key assumption to change, which will cause the carrying amount of the CGU to be greater than its recoverable amount, com-panies are obliged to disclose the surplus. Further, information of the key assumption values must be availableas well as the required change in order for the carrying amount to correspond to the recoverable amount (FAR Akademi, 2013; European Commission, IAS 36, 2010).
2.3
Qualitative Characteristics of Accounting
IASB´s conceptual framework presents certain qualitative characteristics, which entities are expected to apply in the preparation of the financial reports, in order to ensure that useful information is provided(Mackenzie et al., 2013).These characteristics are
essen-(Christensen, 2010). The characteristics are categorized into two different groups, namely fundamental qualitative characteristics and enhancing qualitative characteristics. The fundamental characteristics consist of two concepts, relevance and faithfulness. Comparability, verifiability, timeliness and understandability are the four remaining characteristics, which are known as the enhancing qualitative characteristics (Mackenzie et al., 2013).
2.3.1 Fundamental Qualitative Characteristics
One of the fundamental characteristics within IASB´s conceptual framework is rele-vance. According to IASB, information is seen as relevant when it has the ability to in-fluence the decision process, which occurs when the information possesses a predictive value, confirmatory value or a combination of both. Information with a predictive value involves details that may be useful in foreseeing future outcomes. If the information in-stead provides response to prior evaluations, it is said to have a confirmatory value (IASB Conceptual Framework, 2010). Another characteristic within this group is faith-ful representation, which simply states that the information shall represent what it in-tends to. This characteristic is built upon three different key terms, namely complete, neutral and free from error. The term complete implies that no information should be excluded if it is necessary for a full understanding. Neutral information means that the information should not be biased. Lastly, free from errors involves no exclusion and er-rors in the revealed information (Mackenzie et al., 2013).
2.3.2 Enhancing Qualitative Characteristics
Among the group of enhancing qualitative characteristics, four concepts can be found. The first characteristic is comparability, which allows for differences and similarities to be observed between the items. Consistency further enhances the comparability among entities and encourages companies to use similar principles and processes, either from one calendar year to another or across companies within a certain year. Verifiability is a concept used to ensure a true and fair view of companies´ economic situation. The con-cept implies that independent parties must be able to obtain a general agreement upon the information to be free from bias and material errors, which is done by achieving
teristic is timeliness, which requires the information to be disclosed in time in order for the users to make decisions based upon updated information (IASB Conceptual Frame-work, 2010).
The framework of IASB further requires the information to be understandable. This characteristic highlights the importance of providing information that is classified and characterized in a clear and concise manner. The information should make it possible for the users to gain an understanding of the company, under the condition that they possesses reasonable knowledge of businesses and financial reporting (Mackenzie et al., 2013).
2.4
Previous Research
Several countries have made reporting in accordance with IFRS compulsory (Christen-sen, hail & Leuz, 2013). This was the result of EC´s requirement on European countries to prepare their financial statements in line with IFRS, from year 2005 and onwards (Glaum et al., 2013). Due to the changing accounting regime, comprehensive investiga-tion has been conducted in this matter (Christensen et al., 2013).
Previous studies have looked at the issue of goodwill impairment from different angles. Glaum & Street (2003) examined the compliance level among German listed companies in year 2003. At this point in time, both the framework of IASB and US GAAP was al-lowed to use. The authors concluded that companies experienced difficulties in comply-ing with both the standards of IASB and US GAAP. Glaum et al. (2013) made an inves-tigation of the leading companies in Europe in the same year as the implementation of IFRS,to assess the compliance level with the disclosure criteria in both IFRS 3 and IAS 36. The investigation proved that the level of non-compliance were significant among the European leading companies. The authors further proposed that the countries´ en-forcements systems, the ownership structure, auditor and industry-type were crucial fac-tors for the disclosure level. Similarly, Devalle & Rizzatto (2013) aimed at verifying the quality of the disclosures in line with IFRS 3 and IAS 36, as well as the determinants of the compliance level. However, this study was limited to Italian listed companies and it sought to investigate the influential variables on the quality of the disclosures. The
out-other hand identified entity size and performance variables as the two most influential factors, when it comes to the disclosure level. Wallace, Naser & Mora (1994) preformed a study of listed firms in both Valencia and Madrid to investigate which variables that could impact the disclosure level. The impacting variables turned out to be the size and the listing status, while the audit firm and the industry-type were not considered to be associated with the compliance level.
Another study that was performed by Devalle & Rizzato (2012) sought to answer whether the European countries succeeded in providing the information that was re-quired by IFRS. The notes in companies´ consolidated financial statements, for the year 2010, served as a basis for the examination and the investigation was performed five years after the study of Glaum et al. (2013). The outcome showed that the compliance with IAS 36 was still insufficient among the European companies, even after five years. More specifically, only 27 % succeed in disclosing the required information and the least informative area turned out to be the sensitivity analysis.
Many researchers have found it interesting to examine the impact of the financial crisis on the disclosures of goodwill impairment; however, the studies have looked at the is-sue in different contexts. Izzo et al. (2013) observed Italian listed companies during 2007-2011, with an effort to determine whether the financial crisis affected companies´ disclosure levels. Italy was selected with the motivation of being the country that had the most impaired assets during 2011. The results showed that the disclosure level was incomplete over the entire period, but with an indication of improvement. The compa-nies did not prefer full compliance since it could result in higher costs than bene-fits. Camodeca, Almici & Bernardi (2013) contributed with another study during 2007-2011, but in the context of UK companies. The research focused on comparing the dis-closures of the impairment test and to examine the estimations of the recoverable amount. Poor disclosures of the key assumptions used in the estimation of the recovera-ble amount were found, particularly after the financial crisis. Bepari et al. (2014) ob-served, among the Australian companies, an improving pattern of disclosures during the global crisis compared to pre-crisis period. The findings were obtained from an investi-gation conducted in 2008-2009 and indicated that the compliance level varied across companies due to certain firm-specific factors, such as, the audit quality, materiality of
Ji (2013) observed Australian companies during 2007-2009, with an attempt of as-sessing whether the entities avoided or intentionally reported about the goodwill im-pairment too late in time, although indications of imim-pairment exist. Poorly performing units within the entities were found to report about goodwill impairments more often than those units that performed better and it was clear that companies avoided to dis-close about the impairment losses. Delayed reporting of the losses was also evident for Australian companies during this time. Further, the losses did not correspond to the cal-culations made in the study, they were both lower in value and in number. The chairman of IASB, Hans Hoogervorst, confirms the findings of Ji (2013) by stating that the im-pairment losses often were delayed during times of financial crisis (ESMA, 2013). Hjelström & Schuster (2011) studied the implications of the IFRS adoption among Swedish companies in 2005. The findings support many other studies, which have iden-tified a low level of compliance with IAS 36. The study concluded that the least in-formative areas concerned the assumptions used in the impairment test. This was ex-plained with companies´ reluctance of revealing sensitive information. Furthermore, the reporting entities were eager of observing how other firms coped with the new require-ments before they fully complied with the standard. A more extended research was per-formed by Hartwig (2013), which aimed at assessing the extent of disclosures by Swe-dish and Dutch companies. Likewise Hjelström & Schuster (2011), Hartwig (2013) re-viewed the financial reports of 2005 but also year 2008. The research findings suggest-ed that in 2005, Swsuggest-edish companies complisuggest-ed with the standard to a larger extent than Dutch companies. For the second investigation year, an improvement for both countries could be seen, which indicated learning. The two countries had corresponding compli-ance levels in year 2008.
Additional studies within the goodwill field were performed by Petersen & Plenborg (2010) in year 2006, which investigated how the Danish companies identified a CGU. Danish companies seemed to keep a low level of compliance with the disclosure re-quirements in IAS 36 and some of the entities failed to define the CGUs. Hoogendoorn (2010) further emphasizes the difficulties of defining a CGU and estimating the CGU´s recoverable amount by ranking them as some of the most problematic areas to tackle in practice.
Carlin & Finch (2011) observed the disclosures of Australian companies one year after the adaption of IFRS. The aim of the study was to determine whether companies re-vealed the type of information that was required by the standard. The research indicated partial compliance among Australian companies, where the missing disclosures con-cerned the distribution of goodwill, the growth rates and the discount rates used in the estimation process.
2.5
Disclosure Theory
Corporate disclosure deals with how the management communicates the performance of the company towards its external parties (Haley & Palepu, 2001). Managers usually possess better access to company information. Hence, investors do not have the same possibility as the management in assessing the profitability of different investment ac-tivities, which results in information asymmetry(Beyer, Cohen, Lys & Walther, 2010). Timely, transparent and credible information enables market operators to verify the de-cisions taken by the management, thus, corporate reporting is considered to be an effec-tive tool in reducing the information asymmetry between the two parties (Glaum et al., 2013). Disclosures that does not contribute to an increased understanding has not suc-ceeded in fulfilling its purpose (ESMA, 2013).
The demand for disclosures and financial information emerges from unequal access of company information. When the scope of information differs between the management and the investors, problems may arise and create conflicts (Healy & Palepu, 2001). To avoid or reduce the information asymmetry, more extensive disclosures are necessary (Mazzi, André, Dionysiou & Tsalavoutas, 2014). Furthermore, financial reports have to be prepared without bias to work effectively (Glaum et al., 2013).
Corporate disclosures may take various forms. The revealed information may either be of narrative- or financial nature. In addition, the disclosures may be provided on an op-tional basis while some information is required by regulations. Other disclosures are available through Internet sources while some companies choose to have the infor-mation in printed form (Alberti-Alhtaybat, Hutaibat & Al-Htaybat, 2012). Reporting is essential for the capital market to function properly and the information is usually found
in the financial reports, including footnotes and financial statements (Haley and Palepu, 2001).
The theories of disclosure suggests that managers are more likely to disclose infor-mation that contains good news and avoids to reveal inforinfor-mation that contains bad news (Shalev, 2009). Managers may further have an interest in shaping the disclosures to align them with their own interest (Cooper & Keim, 1983). This is why Cooper & Keim (1983) stresses the necessity of regulated corporate disclosure.
Both voluntary and mandatory disclosures may take a cost-benefit approach. Some po-tential benefits of revealing information could be to attract investors and to allow for benchmarking. However, public information also implies costs for the entities in terms of preparation and disclosure of valuable information (Gélinas, 2007). When this cost decreases, it indicates that the company has learned to perform the activity at a lower cost (Jaber, 2011). Disclosure theories propose that information is more likely to be re-vealed when the benefits are expected to exceed the costs (Urquiza, Navarro & Trom-betta, 2010).
Provisions on disclosure are helpful in managing the imperfections in the information market and serves as an effective tool when it comes to ensuring the production and the spread of accurate information. Without any regulations on disclosure, it is likely that the actual disclosure level falls below the necessary information level. The regulation on financial reporting further raises the credibility of the financial statements (Cooper & Keim, 1983). This explains why all countries have substantial regulations on corporate reporting (Healy & Palepu, 2001).The need for mandatory disclosure requirements ap-plies in particular to the case of goodwill, since the impairment tests are heavily based upon the assumptions made by the management, hence, allows for manipulation (Lhaopadchan, 2010).
To reach the optimal disclosure level, accountants and auditors are expected to work in accordance with the existing principles, such as the principle of independency, as well as the fundamental rules of accounting and reporting (Alberti-Alhtaybat et al., 2012).
3
Methodology
There are two types of research strategies that writers on methodological issues general-ly differentiate between, namegeneral-ly qualitative and quantitative. The choice of strategy de-pends on the nature of the research question that the investigator tries to answer and un-der certain circumstances a combination of both is preferred (Bryman, 2012).
3.1
Research Strategy
Studies with a quantitative research strategy tend to stress the quantification in the data collection and analysis. This is different from the qualitative research strategy, where a greater focus is put on the interpretation of the words in both the analysis and collection of data, to grasp the whole picture. The quantitative strategy usually has a deductive na-ture, which implies that an established theory is used in the formulation of the hypothe-sis and which impacts the data collection. Depending on the outcome of the research, the hypothesis is either confirmed or rejected. In contrast, the qualitative strategy gener-ally takes an inductive nature, which implies that a theory is formulated based upon the findings (Bryman, 2012).
This study has a quantitative research strategy with a deductive nature. The report aims at investigating companies´ compliance with the disclosure requirements in IAS 36, paragraph 134, where companies´ annual reports serves as the main information source for the collection of data. In addition, an examination of different variables that might affect the disclosure level will be carried out. Due to the nature of these research ques-tions, the emphasis is put on the quantification rather than interpreting the words in the annual reports. The examination of the financial reports only intends toanswer whether companies comply with the specific requirements or not and therefore, the study does not seek to gather nor analyzing information beyond this level.A deeper understanding of the revealed information is not of interest, the focus is instead to assess if the good-will impairment notes contains the required information. Moreover, the report is consid-ered to have a deductive nature as theory is connected to the findings.
3.2
Research Method
3.2.1 Sample Selection
The research is interested in observing whether large-, mid- and small cap companies in Sweden disclose the required information regarding goodwill impairment. Therefore, the sample was derived from NASDAQ OMX Stockholm´s three different lists. Com-panies were gathered from the database Retriever Business, where all comCom-panies in Sweden are ranked in terms of turnover. The investigation period covers the years 2005-2013, since the annual reports for the year 2014 were not available for all companies in the beginning of the investigation. Thus, one of the requirements was to have a recog-nized goodwill item in the balance sheet during this period. An examination of compa-nies’ annual reports were performed in order to identify whether the entities had recog-nized a goodwill item or not and in cases were no goodwill item was found, the entities were excluded. Additionally, the financial reports were expected to be prepared in ac-cordance with the framework of IFRS to be considered as relevant. A further criterion was to have annual reports available for the public, when the reports were missing, companies were omitted from the study. Those that were not listed during the entire in-vestigation period were not taken into account, this also applies to firms with broken fiscal years since that would imply partial compliance with IAS 36 in year 2005.
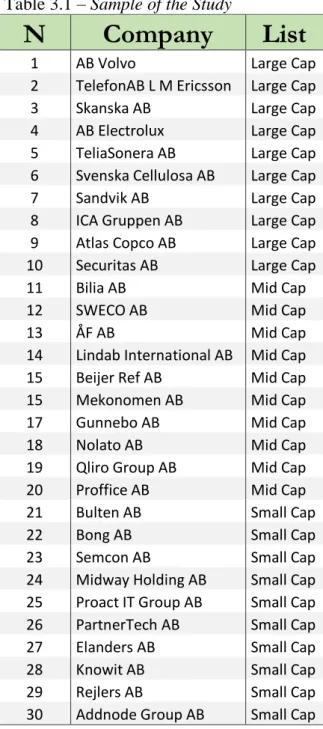
When companies were considered as inappropriate the next largest firm replaced them. This selection process proceeded until a complete sample was obtained, including the ten largest entities within each list, with consideration to the requirements stated above. The final sample for the entire investigation period is presented below in table 3.1.
Table 3.1 – Sample of the Study
N
Company
List
1 AB Volvo Large Cap
2 TelefonAB L M Ericsson Large Cap
3 Skanska AB Large Cap
4 AB Electrolux Large Cap
5 TeliaSonera AB Large Cap
6 Svenska Cellulosa AB Large Cap
7 Sandvik AB Large Cap
8 ICA Gruppen AB Large Cap
9 Atlas Copco AB Large Cap
10 Securitas AB Large Cap
11 Bilia AB Mid Cap
12 SWECO AB Mid Cap
13 ÅF AB Mid Cap
14 Lindab International AB Mid Cap
15 Beijer Ref AB Mid Cap
15 Mekonomen AB Mid Cap
17 Gunnebo AB Mid Cap
18 Nolato AB Mid Cap
19 Qliro Group AB Mid Cap
20 Proffice AB Mid Cap
21 Bulten AB Small Cap
22 Bong AB Small Cap
23 Semcon AB Small Cap
24 Midway Holding AB Small Cap
25 Proact IT Group AB Small Cap
26 PartnerTech AB Small Cap
27 Elanders AB Small Cap
28 Knowit AB Small Cap
29 Rejlers AB Small Cap
30 Addnode Group AB Small Cap
3.2.2 Collection of Data for the Main Research Question
The data for the main research question, regarding the compliance with the standard, was solely gathered from the firms’ annual reports. The database Retriever Business served as the primary information source since it possesses an extensive access to com-panies’ financial reports and other company information. In cases where the financial
nies’ websites. When reviewing the financial reports, the emphasize were put on the notes of goodwill impairment and if the entities referred to other important notes related to goodwill impairment, these notes were reviewed and considered as well. In order to ensure that proper information was gathered and that a consistent examination of the notes was performed, a disclosure checklist was used during the entire data collection process. The disclosure checklist is described in detail in section 3.2.4. The data gath-ered for the main research question was processed and entgath-ered into a scoreboard, which is explained in the following section.
3.2.2.1 Scoreboard
Scoreboards were constructed to assess the compliance level for each of the firms. Each scoreboard consists of two axes and is a table that illustrates companies´ scores for each disclosure criteria. The data that was derived from companies’ annual reports was en-tered into these scoreboards, using the computer software Excel. The tables provided an overview of companies´ disclosures and enabled for an evaluation of the compliance level. Separate scoreboards for each year were constructed, with the company names on the vertical axis and the disclosure requirements on the horizontal axis. IASB´s latest list of disclosure requirements, in 2015, regarding goodwill impairment, was interpreted and served as a disclosure checklist for this study. The disclosure checklist consisted of 7-12 requirements, including two recently added criteria.Since year 2013, IFRS made it mandatory to inform about the fair value hierarchy as well as the alternative methods used in the valuation.
The number of criteria, that the companies were expected to follow, varied within the sample, mainly due to two aspects. The first aspect concerns which basis that has been used in the calculation of the recoverable amount. Another decisive factor in determin-ing the number of criteria were whether firms have recognized an impairment loss dur-ing that specific year or not.
Companies were assigned with one point when they succeed in presenting a mandatory disclosure requirement of IAS 36. However, when the entities failed to meet a certain disclosure criteria, they were assigned with zero points. The number of applicable
re-the scoreboard. Moreover, partial compliance with re-the requirements was common for some companies, however, a score of one or zero was not considered to be representa-tive. It was more fair to indicate this scenario with the sign *, which demonstrates the partial compliance. The sign * were not taken into account when adding up the total scores. The purpose with the sign * were to visually demonstrate and convey the partial compliance to the readers. The scores obtained by each of the companies were added up and presented in a separate column on the horizontal axis of the scoreboard. The scores were converted into a percentage to be able to make a fair comparison of the companies. If the precise numbers had been used, it would be difficult and unfair to compare them with each other, when different number of disclosure criteria has been applicable. The scoreboards were divided into three categories, representing each list on the Swedish stock market.All the scoreboards can be found in Appendix 1-9.
3.2.2.2 Charts
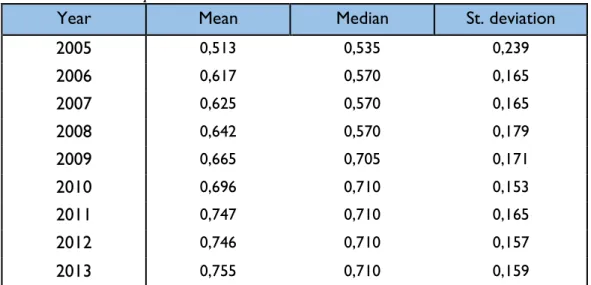
The study is interested in observing the disclosure behavior over a nine-year period, which makes the use of charts appropriate, since it allows for a trend to be observed. The results obtained from the scoreboards were inserted into a chart to present the com-pliance level over time, which corresponds to the study´s main research question. The data that was entered into the charts represents the average disclosures levels for each year. However, if the variance in the numbers is significant, average numbers may be misleading since it does not show the spread. Therefore, tables with descriptive statis-tics were presented together with the charts, when necessary.
The use of charts also applied to the sub-questions of the study, which seeks to answer the impact of specific characteristics. Previously collected data has been used in the charts to the extent it was possible, however, additional company information was gath-ered from Retriever Business when necessary. In the charts that correspond to the sub-questions, average data was used to be able to see a trend over the investigation period. On the vertical axis of the diagrams, the compliance level was presented and on the hor-izontal axis, the year was stated. As a supplement to the charts, tables with descriptive statistics, presenting the mean-, median- and standard deviation numbers, were provided to avoid a distorted picture.
3.2.3 Collection of Data for the Sub-questions
The first sub-question, which examines whether the size (list) has an impact on compa-nies´ disclosure levels, was answered with the findings from the main research question. In this context, size refers to which list the company belongs. The findings from the main research question reflect the disclosure behavior of large-, mid- and small cap companies, which makes the results useful when examining the impact of the size (list) variable on the disclosure level.
The second sub-question examines the impact of three additional variables, namely the age, the audit firm and the industry. This type of variables required additional infor-mation to be gathered, since the findings from the main research question were not suf-ficient enough to answer the question itself. Information about companies´ ages, indus-tries and audit firms was collected from Retriever Business.
3.2.3.1 Multiple Regression Analysis
To enhance the reliability of the charts, a regression analysis was necessary to conduct. Regression analyzes are useful tools for testing the relationship between certain varia-bles. The analysis was performed as a complement to the charts and served as a statisti-cal confirmation for the outcomes. The test was essential to be able to confirm whether the variables were associated with the compliance level or not, since the diagrams runs the risk of being misinterpreted. The same data has been used for both the diagrams and the statistical test, which were gathered from companies´ annual reports. The regression analysis was carried out in the computer software SPSS and the data that were gathered for the diagrams were transferred to this program, to be able to test the relationship be-tween the compliance level and the specific company characteristics. The model com-prised of one dependent variable, namely the compliance level, and four independent variables, which are the size, the age, the audit firm and the industry. Bryman (2012) defines the dependent variable as a factor that is causally impacted by other factors and the independent variables as the factors that have a causal influence on other factors. By putting the dependent and the independent variables in relation to each other, a relation-ship might be observed.
The majority of the variables of this study were not in numerical values and it was therefore necessary to include several dummy variables to be able to performthis type of test. Non-numeric variables were indicated as dummy variables and this was the case for the size, the audit firms and the industry. Dummy variables are used when the test contains a factor that has two or more categories (John, Whitaker & Johnson, 2006). By treating size, audit firm and industry as dummy variables a relationship could possibly be observed, even though these factors contained different categories. Generally, dum-my variables are assigned with a numerical value of either 0 or 1 (John et al., 2006). The number of categories determined the number of dummy variables, since the number of dummy variables always needs to be one less. In cases where more than two categories were used, only one of them was assigned by 1 while the remaining ones were indicated by 0.
The statistical test is not intended to answer the sub-questions itself, but rather to con-firm the outcome of the charts. Therefore, the significance level has not been deter-mined at one level. Normally, a significant level of 0, 01, 0, 05 or 0, 10 is applied (Ber-enson, Levine & Krehbiel, 2012). However, in this study, the outcomes are compared at two different levels to see at what level the variables becomes significant and whether the findings of the test are consistent with the outcome of the charts. Variables with a p-value lower than of 0, 05 and 0, 10 have been considered. The p-p-value indicates how much the certain variable contributes to the model (John et al., 2006). The final model were constructed as follow:
Y = β0 + β1 Age + D1 Large Cap + D2 Small Cap + D3 EY + D4 PwC + D5 Deloitte + D6 Manufacturing
For the size variable, mid cap companies served as the reference for the two other cate-gories and for the audit firm variable, KPMG was the reference firm. In the case of the industry, non-manufacturing companies functioned as the basis for the comparison.
3.2.4 An Interpretation of IAS 36, paragraph 134
The assessment of companies´ disclosure levels was conducted by an interpretation of the requirements in IAS 36, paragraph 134. The interpretation of the requirements was
will impairment notes has been carried out. The disclosure checklist is presented in this section and in need of an increased understanding it is highly recommended to review the chapter Frame of References, section 2.2.2.
The following must be disclosed when a significant value of the carrying amount of goodwill has been allocated to a CGU (FAR Akademi, 2013):
A) The carrying amount of the goodwill that has been allocated to a CGU must be clear-ly stated. In cases where goodwill has been distributed to onclear-ly one CGU, without providing any explanation of the appropriateness of this, companies received zero points. This was also the case when goodwill was not distributed to a CGU.
B) Excluded - Does not specifically address goodwill.
C) A presentation of the basis used when estimating the recoverable amount of the CGU was required. More specifically, whether the value in use or fair value less cost to sell has been applied. If the basis were not clearly stated during a certain year, no points were given and companies were assessed with the least number of requirements to make a fair judgment.
D & E) The following criteria concerns both companies that uses value in use and fair value less cost to sell in the estimation of the recoverable amount.When differences be-tween these two methods exist, this is indicated next to the criteria.
1. Entities must state the key assumptions that have been used as the basis for the cash flow projections. Key assumptions refer to those that the CGU´s recovera-ble amount is sensitive to. The application of wordings such as “other key as-sumptions or some of the important key asas-sumptions” were indicated by the sign *, which stands for partial compliance. Further, when no assumptions were men-tioned, this resulted in zero points.
2. A description of how the values assigned to each key assumption has been de-termined as well as whether the values are consistent with prior events or exter-nal information sources is required. If the values are not consistent with any of these two, a motivation of why and how must be presented. When no description
a) Companies that uses fair value less cost to sell as a basis for the CGU´s recoverable amount must present to which level the calculated value of the CGU belongs to in the fair value hierarchy. This criterion only relates to the year 2013. When entities did not mention the level to which the value of the CGU belongs to, no points were given.
b) If the valuation technique has changed, companies must justify the dif-ference in value as well as the reason for the change. This criteria does only concern those that uses fair value less cost to sell in the year 2013. When no information was provided regarding the valuation technique, this resulted in zero points. This were also applied when no explanation for the change were stated.
3. Information about the duration of the cash flow projection must be presented. In cases of intervals, the sign * were given, illustrating partial compliance. Periods of intervals does not tell the precise period used for a certain CGU, which ex-plains the *. When no period was mentioned, no points were assigned. Compa-nies that use the value in use method must further justify why a period longer than five years is appropriate, if this was the case. If a longer period were ap-plied without any justification, zero points were obtained.
4. The growth rate applied in the cash flow projections beyond the latest forecasts must be indicated in the note. If the growth rate is greater than the average long-term growth rate for that CGU´s industry or market, this must be explained. However, this only applies to the entities that use value in use. Growth rates stated in intervals were not considered to be fully complying and were denoted with the sign *. Notes without growth rates resulted in zero points.
5. Companies must inform about the discount rate that has been used in the cash flow projections. If the discount rate were not indicated for each CGU, neither one nor zero points were assigned, since this was considered as partial
compli-points.
F) Regardless of which method the entities have used in their calculation of recoverable amount, a sensitivity analysis is required to be carried out, to see if there is a reasonable possibility of the key assumption to change and result in an impairment loss. If an im-pairment loss were recognized, the following disclosures were required:
1. How much the recoverable amount deviate from the carrying amount. When no difference was indicated, companies were assigned with zero points.
2. A presentation of the values of the key assumptions that could possibly change. If companies failed to inform about the current values of the key assumptions, no points were given.
3. Entities are required to state how much the key assumptions must change in or-der for the carrying amount to equal the recoverable amount. If the necessary change was not mentioned, zero points were allocated.
3.3
Quality of Method
Once the data has been collected it is essential to assess the degree of faithfulness of the data. The assessment involves to question the reliability and validity of the technique used (Burns, 2000). It is further necessary to evaluate the quality of the measures (Gra-ziano & Raulin, 2010).
3.3.1 Reliability
The word reliability is often associated with the adjectives dependable, accurate, honest, trustworthy, consistency. At its most basic level, reliability is about ensuring that pre-cise measurement tools are used in the research. The concept of reliability implies that under similar conditions, similar outcomes should be achieved, regardless of the
fre-namely how the measurement has been carried out as well as how precise the data has been processed (Holme & Solvang, 1997). By minimizing the errors in the measure-ments a greater reliability is obtained (Burns, 2000).
This study examines companies´ annual reports, which includes an interpretation of the goodwill impairment notes. Reviewing the notes involved subjectivity, which was an inherent element in the process. In order to minimize the subjectivity in the process, a disclosure checklist was developed to serve as an interpretation tool for the data collec-tion. This increased the transparency and consistency of the data gathered.
3.3.2 Validity
An even more essential concept to consider, in addition to the reliability, is the validity of the study (Holme & Solvang, 1997). The concept of validity refers to whether the test of the research is measuring what it intends to measure. The measurement tools may be reliable, providing consistent outcomes from time to time, however, they are not con-sidered to be valid if they fail to measure what the research intends to measure. The term validity may be divided into two different groups, namely internal validity and ex-ternal validity (Burns, 2000). The former group refers to studies where causality can be found in the observations. The latter group, on the other hand, is about being able to generalizing the outcome of the study to other persons, times and settings (Roe & Just, 2009).
This research examines whether a relationship between companies´ disclosure levels and some specific characteristics of the firms exists. The study measures the variables that are most prevalent in previous studies, which explain companies´ compliance lev-els. However, additional factors may impact the disclosure behavior.
3.3.3 Critique of References
Companies´ annual reports served as the primary information source for this research, these reports are prepared by the companies themselves. Due to the fact that the compa-nies are involved in the preparation, the reports cannot be considered as objective. An-nual reports are however monitored by different parties such as auditors, governmental