VTI särtryck
Nr 229 ' 1994
Systematic Cooperation between Driving
Schools and Parents in Driver Education,
an Experiment
Nils Petter Gregersen
Reprint from Accident Analysis & Prevention, Vol. 26,
No. 4, 1994, pp. 453 461
'1. .a. .' '"'u. ' .\_x x'- \
-' -: .. {Sm-h .:;«&%:
Väg- och
V'" särtryck
Nr 229 0 1994
Systematic Cooperation between Driving
Schools and Parents in Driver Education,
an Experiment
Nils Petter Gregersen
Reprint from Accident Analysis & Prevention, Vol. 26,
No. 4, 1994, pp. 453 461
&»
Väg- och
transport-farskningsinstitutet
,
ISSN 1102 626XPergamon
Accid. Anal. and Prev.. Vol. 26, No. 4, pp. 453 461, 1994 Copyright © 1994 Elsevier Science Ltd Printed in the USA. All rights reserved
0001-4575/94 $6.00 + .00
0001-4575(93)E0006-S
SYSTEMATIC COOPERATION BETWEEN DRIVING
SCHOOLS AND PARENTS IN DRIVER EDUCATION,
AN EXPERIMENT
NILS PETTER GREGERSEN
Swedish Road and Transport Research Institute (VTI), S 581 01 Linköping, Sweden, and Dept. of Community Medicine, University of Linköping, Linköping, Sweden
(Accepted 6 September 1993")
Abstract The overall purpose of the experiment is to study the effects of various educational changes as a measure for preventing accidents among young drivers. The hypothesis is that accident risks among young drivers, normally educated by private instructors, i.e. parents, will be reduced if complementary professional education and support are provided. To analyze the effect of this combination of private and complementary professional driver education compared to solely private instruction, nearly 2,000 young people, 17 years old, were divided into two groups. The experimental group was given professionally supported education and the control group was educated by parents or other private teachers. The changes comprised three parts, systematic cooperation between driving school and parents, commentary driving to improve scanning behaviour, and special practice to help the learner experience his own limitations in driving skill. The results based on self-reported accident show negative effects during the rst year and positive effects of the changes during the second year after licensing. When the two years were added, no signi cant change was found. Questionnaire data in subjective skill and driving style showed small changes, the experimental group being a little more careful and a little less self con dent. The results are discussed in terms of cognitive overload and the learners limited capacity to bene t from the changes during the rst of the two years.
Keywords Driver training, Recently quali ed driver, Safety, Driving instructor
INTRODUCTION
It is a well-known fact that young drivers are in-volved in considerably more accidents than older, more experienced drivers. The latest gures from Sweden show an overrisk of 700% among drivers aged 18 19 (Spolander 1992). In 1984, a special Swedish group made an analysis of young drivers problems and also suggested various countermea-sures in terms of driver training and education.
The present study was designed on the basis of this analysis of young drivers problems. Three basic and important problems were pointed out (Spolander et al., 1984):
1. Private driver education is not suf ciently governed by rules and curricula. In Sweden, it is possible to obtain driver education either in professional driving schools or privately with a nonprofessional instructor. The pro-fessional schools apply rules and a curricu-lum, but learners who do not make use of
453
the professional driving schools lack the nec-essary structure. A high proportion of driv ers (21%) obtain their education with private, unprofessional teachers, which is considered to result in poorer drivers, since these teach-ers are not acquainted with deciding what is important to teach and how to teach it. In addition, 51% combine private learning with one or more lectures at the traf c school. With the proper guidance from professional driving schools, private training may be re-garded as an important means of gaining more practice and experience.
. Young drivers perceptional behaviour has severe limitations. They do not make use of their peripheral vision. They focus on the road, close to the front of the car, etc. Conse-quently, they fail to discover obstacles and critical situations on the road (Mourant and Rockwell 1972), which may lead to increased involvement in accidents. Their reaction time in traf c situations is also prolonged
454 N. P. GREGERSEN
when they become drivers. These are cer tainly not physiological changes, but a prob-lem of cognitive capacity. A novice driver has to deal consciously with so many things that his cognitive capacity is insufficient. 3. Young drivers tend to overestimate their
own capacity as car drivers. It has been shown in several studies that young male drivers, especially. believe they are better than the average driver. If a driver believes that he is skilled. this leads to lower risk evaluation and more risk taking. Young driv-ers do drive faster than older drivdriv-ers, they keep shorter distances, they have more vio-lations etc. (Evans. Wasielewsky. and Von Buseck 1982; Evans and Wasielewsky 1983; Firm and Bragg 1986).
The group concluded its work by suggesting an experiment in which three measures could be tried out in driver education. each of them with the aim of reducing one of the three problems:
1. The solution to the problem ofprivate teach-ing was not to forbid this part ofthe teachteach-ing, but to give the private teachers guidance and help. Private teaching was regarded as a re-source for gaining experience and routine. while professional teachers should be re sponsible for teaching new knowledge and skills and for structuring private instruction. . l t was suggested that the perceptional prob
lems should be reduced by using the method of commentary driving to improve driv ers scanning behaviour and risk evaluation. It is based on a strategy that the learner. during driving. reports to the teacher on what is happening around him. Through feedback from the teacher. this scanning skill is ex-pected to be improved.
3. To reduce overestimation. it was suggested that the drivers should be put in situations in which they should not practice driving skill. but rather experience their own limita-tions better. Practical training could be de-veloped with the purpose of surprising the learners and making them fail in driving tasks that they normally believe they can handle.
T
Q
AIMS
Following the suggestions in the report referred to above, the aim of this study has been to analyse the preventive effects of the combination of these three changes upon accident risk. This means
struc-Preparation of theoretical parts at home
Learning new knowledge ond skill at the driving school Practicing new skill at home
using instructions from the driving school
Diagnosis and evaluation at the driving school
[ Proceeding to the next part | Fig. ]. Model for the integration of professional and private
driver education.
tured support by the driving school, use of com-mentary driving. and special insight-creation train ing. The hypothesis that the accident risk will be reduced during the rst two years with a licence is tested. An experiment was designed with the new model for drivers education instead of the free model of private education.
METHODS AND MATERIAL
1)<)s<'riptimz of experimental driver training To reduce the problems described above, three measures were tested in the experiment (for further details. see Gregersen 1992a). The problems of pri vate teaching were tackled by giving the privately taught drivers theory lessons in accordance with the Swedish official curriculum together with 16 lessons, each lasting an average of 45 minutes, in practical driving at a professional driving school. This profes-sional part was combined with training at home as described in Fig. 1.
The participation of the private teacher in an introduction and four ofthe driving lessons was also mandatory. As guidance for the private training, twelve new instruction folders were designed and distributed successively during the learning period. These folders contained verbal and graphic instruc tions for the private teacher and for the learner driver.
The second measure. to improve perception and scanning behaviour. was method of commentary driving in the driving schools (Marek and Sten 1977). The idea of the method is that the learner should give oral reports. telling the teacher what is happening while driving, The ability to give these verbal reports is developed in four steps:
Cooperation between driving schools and parents 455
1. Reporting actions (i.e. shifting gear,
look-ing in the mirror, presslook-ing the brake pedal,
etc.)
2. Reporting observations (i.e. a child on the
sidewalk, a line of parked cars, a stop sign,
etc.).
3. Reporting risks (i.e. the child might jump
out into the street without looking, someone might open a car door, etc.).
4. Reporting preventive measures (i.e. be pre-pared and watch the child, keep a proper distance to the line of parked cars, etc.).
The method was used for 5 10 minutes during each
driving lesson. The idea was to improve the learner s ability to see what was happening around him. The learner's perception, evaluation of risks, and ideas for preventive measures are also re ected, thus en-abling the teacher to give immediate feedback.
The third measure, reducing the learner s over-estimation, introduced a series oftraining tasks that allowed the learner to experience his own limita-tions.
These tasks were based upon various
poten-tially dangerous situations such as maneuvering on
icy roads, driving in darkness, and driving in areas with wildlife. One of the tasks, driving in darkness, will be described as an example (Fig. 2).
A teacher is sitting in a parked car, and the learner and
another instructor are driving in another car. The instruc-tion is to practice shifting from high to low beam. The
task is performed when passing the parked car. The learner
drives along a road which leads back to where he started, and the instruction is repeated. This time. however, a dummy (a cylindrical object of soft, black-colored
mate-rial) is placed in the way ofthe learner's car. He discovers
it too late and runs into it. The teacher promptly starts a
discussion about the problem and helps the learner to draw
the right conclusions about his own skill and limitations.
Similar tasks were developed to improve experience of several potentially dangerous situations.
These three measures, in combination with the
normal curriculum of professional driver education,
formed the change in the experimental group. The
educational approach and content were developed
in close cooperation with the driving school
organi-zation and the authorities to maximize feasibility in
practice.
Evaluation method
The design of the study is experimental. The samples were drawn in two steps. In the rst, 12,000 persons aged 17 were randomly drawn from the
Swedish population and address register (SPAR).
l
( Teacher
©
lTl
Fig. 2. Illustration of practice in darkness.
They received a short questionnaire about their plans for obtaining a drivers licence, i.e. whether they planned to join a driving school or learn from a private teacher. The Swedish system allows people to make their own choice. The eye of the needle that everyone has to pass through is the nishing theoretical and practical driving test.
From this questionnaire, 1,894 persons were found who planned to learn from private teachers. These were distributed into two groups, one
experi-mental group and one control group. The division
could not be made strictly on a random basis since
the experimental group was to attend driving schools, and it was necessary to reduce the geographical
dis-tance to the schools as much as possible. In certain
small villages, all of those within the sample were picked for the experimental group. To balance this, a similar village was chosen for the control group. In cities with many young people from the sample, every second person was distributed to the experimental and control groups, respectively.
The control group consisted of 947 persons. The
same number, 947 persons, in the experimental
group was invited to take part in education at a
456 N. P. GREGERSEN
5% of the normal cost had to be paid, just to give
them a feeling of making at least some investment. There were 65 participating driving schools. They were chosen among schools that had shown interest in participating when asked.
Ninety-one percent of the experimental group accepted the offer and signed a contract describ-ing what was expected from them. Eighty-one per-sons did not accept; thus the experimental group now consisted of 866 persons. During their educa-tion, 20 learners broke the contract, so the effective sample size of the experimental group was 846.
Data were collected in different ways. The most important sources were three questionnaires sent to the young drivers, directly after licensing, and one year and two years after licensing. The rst included process-evaluation questions about the learning pe-riod, amount of practice, formative evaluation of the education, etc. In the two following questionnaires, the drivers reported how much they had been driving and their number of accidents. (Accidents were de
ned in the questionnaire to include damage to the car and injury to anyone involved in the accident.) The drivers also estimated their driving skill and described their driving style in ve step scales. The two last questionnaires were similar.
The data collection also included a process-evaluation questionnaire to the private teachers di
rectly after licensing and interviews with the
profes-sional teachers involved in the experiment.
In total, six questionnaires were distributed to
the learners, three to each of the two learner groups
and one to the private teachers of the experimental group. The response rates for these questionnaires
ranged from 85% to 90%. There was no systematic
difference between the two groups in terms of re sponse rate. No nonresponse analysis was made. Statistics
The effects upon accident risk were analysed
from the number of accidents in relation to mileage.
The hypothesis was tested with 95% confidence
in-tervals for the risk quota of the two groups, based on the formula:
xl/x2 ( x,
xl/x2
1+.K-SD
Åz
l K-SD'
If the con dence interval includes 1.0, the hypothe
sis is rejected in a two-tailed test. In a one-tailed
test, the hypothesis of a higher risk in the
experimen-tal group is rejected if the con dence interval in
cludes 1.0 or is entirely above 1.0. K is 1.96 for a con dence interval of 95% in two tailed tests and
1.645 in one-tailed tests. )\,/)\2 is the accident risk
quota in the sample (Spolander 1983).
Other comparisons are made with chi-square
tests and t-tests. The level of signi cance was set to 5%.
RESULTS
The experimental and control groups reported a similar amount of private practice, on an average 45 hours in the experimental group and 42 hours in the control group. The experimental group had, as expected, an average of 16.5 driving lessons (11.5 hours). Many of the learners took extra driving les-sons, which they paid for themselves. In the control group, some of the learners also decided to go to driving schools. However, the average amount of driving tuition was as low as 2.6 hours.
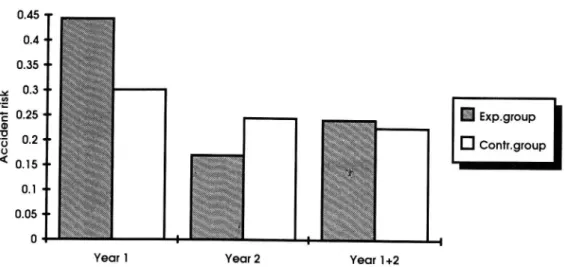
The main results are found in the differences in
accident risk. During the rst year, the experimental group had a higher risk, 0.44 accidents/10 000 km compared to 0.30 in the control group. During the second year, the risk in the control group was higher, 0.24, than in the experimental group, where the risk was 0.17. When the two years were added, no signi cant difference was found (Fig. 3). The con -dence intervals are given in Table 1.
The hypothesis stated that a reduction was ex-pected in the experimental group compared to the control group. During the rst year, this hypothesis was rejected. Since the results so clearly show the
reverse distribution ofthe risk, the differences were
tested with a two-tailed test. This test shows that the difference is signi cant.
From the self-assessment of driving skill, a con-sistent pattern for most of the nine different types of skill was found. In most cases, there was a small but signi cant difference the control group was
subjectively more skilled than the experimental
group (Fig. 4).
The same kind of questions were also asked
after two years ofdriving. No differences were found
at this time. As a measure of driving style, some questions were asked about their driving speeds on rural and urban roads compared to other car drivers. The distribution over the two years is similar, but
significant only during the second year the control
group members drove a little faster (Fig. 5).
From the process evaluation in the experimen-tal group, it was shown that the majority of the
learners as well as the teachers, were satis ed with
the new education. In the interviews with the partici-pating professional teachers, 95% were generally
speaking positive to the changes, even if many of
them criticized minor points regarding the
instruc-Cooperation between driving schools and parents 457
Year l Year 2
Exp.group
\
/
\
El Contr.groupYear l+2
Fig. 3. Accident risk in the experimental and control groups, one year and two years after licensing.
tions for private teaching, the number of lessons, the distribution of time, etc. Approximately two thirds of the instructors would prefer to continue with this integrated teaching model. The main prob-lem from the teachers point of view was that the learners did not practice suf ciently at home.
Private instructors and learners in the experi-mental group were also decidedly positive in most respects. According to their ratings in the question-naires, 80% 90% were positive to the cooperation with traf c schools, to the different features of the training, to the idea of using special instruction fold-ers for the private training, etc.
There were, however, some problems. The questionnaire data show that the experimental group felt that they received low priority in the driving schools compared to other, normal learners. It was also reported that not all the professional teach-ers followed the instructions for the experiment. One example of this is demonstrated by the distribution of the 12 instruction folders. Instead of giving them to the learner one by one, following the curriculum, some teachers used other methods. In a few cases, all 12 were given out together.
DISCUSSION
Discussion ofthe methods
The experiment included rather large groups of learners and has been carried out as a field experi
Table 1. Confidence intervals (95%) ofthe risk quota ofthe exper-imental and control groups, one and two years after licensing.
Two-tailed test HozRiskexp = Riskcontr
Lower Risk quota Upper conf. limit in sample conf. limit
Exp/Contr. year 1 1.2723 1.4721 1.7463
Exp/Contr. year 2 0.5644 0.6932 0.8980
Exp/Contr. year 1 + 2 0.9473 1.0697 1.2285
ment. This means advantages as well as problems, both methodologically and concerning conclusions that can be drawn.
The purpose ofthe study was to try a new model of education in the eld within the normal organiza tion oftraf c schools in Sweden. This offers possibil-ities for learning how schools, teachers, and learners make use of the ideas, as well as the effects on accident risk. These two aspects together form the basis for conclusions when it comes to making gen-eral use of the changes.
The advantage of a high level of reality is, how-ever, combined with a loss of control over the details of what is really happening during the experiment. To have this control it is necessary to add to the evaluation of the effects a deeper process evalua-tion, where the process is studied in the schools and inside the cars, determining how cooperation works, analyzing practical problems, etc. Since this is a time consuming and costly task, the process evalua-tion in this project has been limited to the one-time questionnaires and interviews with learners and teachers.
The follow-up process also included spontane-ous contacts with schools or learners when problems were reported to the research staff. The number of such contacts was large.
During the analysis of what happened during the education process, a number of problems were identi ed from the questionnaire and interview data regarding conformance by learners and teachers with their instructions. These problems were not the only ones. Other problems were reported through spontaneous phone calls and letters from teachers and learners. One such interesting problem was that there were dif culties in de ning the tasks and the responsibilities of the two different categories of teachers. Many reports indicated that the private
458 N. P. GREGERSEN
To drive on icy roads äÄWWWWWWWWW så Exp group
D Contr.group
To handle a sudden skid
To predict course of events xxxxxxxxxxxxxxxxxxxxxxxxxxxxxxxxxxxxxxxxxxxxxxxxxxxxxxxxxxx x
To drive carefully
To handle critical situations W W W
To moneuver in heavy traffic W W W
To react quickly
To make safe judgements xxxxxxxxxxxxxxxxxxxxxxxxxxxxxxxxxxxxxxxxxxxxxxxxxxxxxxxxxxxxxxxx
No, be involved in critical sit. xxxxxxxxxxxxxxxxxxxxxxxxxxxxxxxxxxxxxxxxxxxxxxxxxxxxxxxxxxxxxxxx
0 l 0 20 30 40 50 60 70 80 90
% judging themselves os skilled
Fig. 4. Self-assessment of driving skill directly after licensing. Assessment made on a scale of l -5.
teacher shifts the responsibility on to the profes-sional teacher and vice versa. This may lead to re duced commitment, which was certainly not the in-tention. The idea was that the responsibility should
be shared between both teacher categories. This
may also explain why many of the professional teachers reported that the learners did not practice enough at home.
The conclusion can be drawn that there have
been problems of a normal nature for this kind of
eld experiment, where there is no possibility of
controling every factor. However, the majority of
the participants in the project did a perfect job and
60 f 50 u- 40-%
W
%> 30 ' 20 - f:_xx x /%
%
W
a
W/
/ / /// // .\ x0 i ilulllull!
Much faster /// // x xxxxA little faster As average A little slower
followed all the instructions. In spite ofthis, the few who had problems may very well have in uenced the results for the experimental group, probably in a negative direction.
The samples used in the experiment were drawn from the same population. The division was not com-pletely at random, but with the method used there are probably no systematic differences between the groups. Consequently, the differences between the groups are effects of the program or have occurred by chance.
The choice of driving schools for participation in the experiment was, however, more problematic.
. Exp.group, year l
\\\\\ Contr.group, year 1
D Exp.group, year 2 % Contr.group, year 2
Much slower
Cooperation between driving schools and parents 459
A model was chosen in which only interested driving
schools were selected. In a way, this is an exception to the idea of reality. If the program is to be used generally in all schools, uninterested schools will also be included. If the model were to become man-datory, however, these uninterested schools would probably not put very much effort into making it work.
The consequence of this strategy is that the positive effects of the study may be overestimated. As is often the case in road safety research as well as in epidemiological research in general, there is an important discussion to be held on the choice of effects to be studied, i.e. the choice of dependent variables. The main effects studied in this experi-ment are accident risks. Accident risk is no ambigu-ous term. It must be de ned in terms of source and of the meaning of risk.
Normally two sources are available for accident reports on an individual basis, self-reported acci-dents and police records. The advantage of police records is that they are not biased by the experiment. There is a large proportion of dropout in the police register compared to the true number, but there is no reason to expect that there are different cover-age rates in the control group and the experi-mental group. The problem is, however, that the number of police-reported accidents are few, about 1% 1.5% of drivers aged 18 19 years are reported. Based on the learners own reports, the number of accidents is much higher. The prevalence is 20% 40% of the drivers in the age group 18 19 years. The most important reason for the choice of self-reported accidents was that the size of the experiment had to be limited, since the project paid almost all the costs for the licence in the experimen-tal group. If it had been possible to use much larger groups, the police records on accidents could have been used, but this was not possible.
One problem of using self-reported accidents is that the results may be in uenced by the learners tendency to report their own accidents. It is possible that there will be an underreporting tendency in the experimental group since they may be more eager to show how skilled they are. If so, the consequences would be an overestimation of the risk reducing ef-fects.
Most of the data have been collected through questionnaires. Well-known techniques have been used and no speci c problems have occurred in this work.
Discussion of the results
The main results are unexpected. A positive effect was found, but not before the second year
after licensing. The hypothesis of risk reduction was accepted for year 2 but not for year 1 and not for the two years together. What could the explanation be? In general, the study itself offers no direct an-swers. There are, however, several hypothetical ex-planations, and some of these will be discussed below.
The rst question is whether or not the assump-tions of the potential risk reduction were correct in a theoretical sense. Were there any mistakes in the de nition of the problems?
It would have been easier to accept this explana-tion of the results if there had been no differences between the groups. The results during the rst year, showing a higher risk among those who were given the changes, make this much more dif cult. Some-thing in the measures must have acted in the opposite directions. Since the design does not make it possi-ble to isolate the effects of each of the measures, there is no way of showing whether it is just one, two, or all of them that decrease or increase the risk.
Theoretically, there ought to be a risk-reducing effect from the three measures. Little research has been published on the visual search patterns of nov-ice drivers. In a recent experiment by Miltenburg and Kuiken (1990) some comparisons were made on visual search strategies between drivers with differ-ent levels of experience. They failed to confirm the findings of Mourant and Rockwell (1972) and their own hypotheses of a relation between experience and search strategies. It is, however, impossible to interpret their ndings on xating close in front of the car for novice drivers compared to experienced drivers. Even if the hypothesis of different search strategies cannot be con rmed, it is not very proba-ble that the method of commentary driving works against the idea of improved search strategies.
It is well documented that young drivers overes-timate their own skill (Moe 1986, Matthews and
Moran 1986; McGormick, W'alkey and Green 1986).
The problem of private education is, however, not suf ciently documented. In some recent studies, dated after the start of this experiment, no differ-ences are shown between systems with and without mandatory driving schools. (Potvin et a]. 1988; Levy 1988; 1990; see Gregersen 1992b for an overview.)
The second explanation deals with the imple-mentation process. There was indications in the re sults from the process evaluation that problems ex-isted. These problems, however, must be regarded as relatively small, since the majority was decidedly positive to the changes. If this explanation is valid, there ought to be a zero effect instead of a negative
460 N. P. GREGERSEN
effect the rst year and a positive effect the second year.
A third possible interpretation has to do with the problem of the demands upon young drivers cognitive capacity. Since they have to make con-scious decisions for every move and every action they take. their capacity will sometimes be over-loaded. In these situations, a driver cannot take ev erything into consideration and thus has to make priorities. If an inexperienced driver makes the wrong priorities. he may miss important information and increase his risk.
It is probable that the reduction ofthe demands upon cognitive capacity will take some time and that much behaviour must be changed from conscious to automatic, i.e. much ofthe technical maneuvering of the car. many of the traf c rules. etc. (Brown. Groeger and Biehl 1987).
The results of the experiment may be interpre ted as showing that this cognitive overload works against the way in which the novice driver makes use ofthe improvements. Even ifthe education suc ceeds in making the learner understand the problems and risks of driving and makes him aware of how to drive in specific situations, it is not obvious that he will make use ofthis awareness. On the contrary. it is possible that these aspects will become addi tional demands to take into account in difficult situa tions. which may confuse the driver even more and contribute to an even higher risk level. lt is not until after the first period of driving that capacity is released. making it possible to make use of the experience of commentary driving. increased risk consciousness. etc.
lf this interpretation is correct. the changes in the experimental group may have a potentially risk-reducing effect. but this effect is counteracted by the problem of cognitive capacity. The learners ac cept the messages. but cannot fully make use of them until later. This explains why a risk-reducing
effect is seen during the second year. since the pe
riod ofthe highest demands on capacity has passed. When more cognitive capacity is freed. the driver can make use of all the experience and conclusions drawn from the improved education.
One conclusion from such an interpretation is that it is very difficult to nd ways of improving the safety of novice drivers. This aspect always has to be taken into consideration. Possibly this is one of
the explanations why there are still such high risks
among young drivers all over the world. Many mea
sures have been implemented and evaluated. but there are very few that have proved to reduce acci-dent risks.
This also supports the ideas behind the French
and the recently introduced Swedish system of driver education. In both countries the age limit for practicing has been lowered to 16 years. Though it has not been scienti cally evaluated, the French system is claimed to have reduced accident risk among young drivers to a very low level. The basic idea is to gain experience during a two-year period of practice before receiving the licence and being allowed to drive unsupervised. During this time the driver will pass the first period of cognitive overload and gain capacity for focusing on more relevant fac tors in traf c, such as cooperating with other road users, predicting courses of events, moving the fo cus of scanning from near the car to a broader view of the traffic environment. etc.
It would have been interesting to see the effects of each component in the change package of our experiment. This would have given us a base upon which a deeper discussion could have been held. This is, however. impossible since we have only one experimental group exposed to all the changes. It would also have been interesting to have data on accident risk continually during the two years. With such data. it would have been possible to see if the change from year one to year two is a steady trend or not. or if there is some specific breakpoint.
Special training tasks were used with the pur-pose of reducing overestimation of skill among the learners. We do see some results in this direction, hot the differences between the groups are few and very small.
(,)ne component ofdriving style is speed. Most of the learners in both groups report that they drive faster than the average on rural roads. During the second year. the control group reported higher speeds compared to the experimental group. The reason that those in the control group drive a little faster may be that they did not receive this insight-creating part of the education. and that the experi-mental group. which did receive it, lacked the capac-ity to make use of it until year 2. They were too occupied with all the details of driving.
To a small extent, this is also supported by the results showing that the experimental group feels a little less clever than the control group immediately after licensing.
CONCLUSIONS
One conclusion is that the measures used in this experiment have some kind of in uence upon the accident risk of the novice drivers. However, no risk reducing effects were achieved until the second year. This means that if the effects are real and
Cooperation between driving schools and parents 461
not due to chance, the improvements need time to beconnzapparent
Ifrnoreluulbeen_knouuiaboutxvhathappened during the third and the fourth year, it would have been possible to state whether this was the beginning ofa trend, showing that the experimental group wins in the long run. With the existing data, there is no way of knowing, which leads to the overall conclu-sion that there was no risk reduction during the first two-year period as a whole, during the most prob-lematic period for the novice drivers.
One conclusion is also that the experimental group, in line with our expectations, has achieved more positive results in aspects other than accident risk, i.e. lower speed and lower estimation of their own skills. This does not show up in reduced acci dentnsktuuuthesecondyeariAsduxnmsedabove, the reason may be that learners, due to cognitive overload, need at least one year to make use of the improvements. If that is the case, the experiment did have some bene ts, even if the changes did not succeed _ in reducing the highest initial overrisk among the novice drivers.
Ifthis is true, one might suggest a driver educa-tion that makes it possible to gain enough experience to handle the cognitive overload. One way of dealing with this is to lower the age limit for driving practice, thus making it possible to practice for a long time before gaining a licence. This system has been intro-duced in Sweden, but the evaluation hasjust started and no results are yet available. One of the main points of this idea is that the driver has passed the period of cognitive overload when he gains his li cence and starts to drive on his own.
In continued research, the complex and unex-pected results from this study show a need for theo-retical development and deeper understanding of novice drivers, the complexity of their problems, their motives for driving, their behaviour and the role of the cognitive load, as well as a deeper under-standing ofthe process and e ectscn educa onal rneasures.
Acknowledgements This research was supported by grants from the Swedish Road Safety Of ce (TSV), the Swedish Trans port Research Board (TFB), the Swedish Association of Driving Schools (STR), the Road Safety Committee of the Swedish Insur-ance Industry (FSAB), and the Swedish Road and Transport Research Institute (VTI).
REFERENCES
Brown, I. D.; Goreger, J. A.; Biehl, B. Is driver training
contributing enough towards road safety? In:
Rothen-gatter, J. A.; de Bruin, R. A., editors. Road users and traffic safety. Assen, The Netherlands: Van Gorcum;
1987.
Evans, L.; Wasielewsky, P. Risky driving related to driver and vehicle characteristics. Accid. Anal. Prev. 15:121 136;1983.
Evans, L.; Wasielewsky, P. O.; von Buseck, C. R. Com-pulsory seat belt usage and driver risk taking behav-iour. Human Factors. 24:41 48; 1982.
Firm, P.; Bragg, B. W. E. Perception of the risk of an accident by young and older drivers. Accid. Anal. Prev. 18:289 298; 1986.
Gregersen, N. P. Integrated driver education: An experi-ment with structured cooperation between driving schools and private teachers (in Swedish). VTI Rapport 376. Linköping: Swedish Road and Transport Research Institute; 1992a.
Gregersen, N. P. Young drivers Strategies to improve their traffic safety (in Swedish). VTI Rapport 358. Lin-köping: Swedish Road and Transport Research Insti-tute; 1992b.
Levy, D. T. The effects of driving age, driver education, and curfew laws on traf c fatalities of 15 17 year olds. Risk Analysis 8:569 574; 1988.
Levy, D. T. Youth and traf c safety: The effect of driving age, experience, and education. Accid. Anal. Prev. 22:237 334; 1990.
Marek, J.; Sten, T. Traffic environment and the driver. Driver behaviour and training in international perspec-tive. Spring eld, IL: Charles C. Thomas, Publisher; 1977.
Matthews, M. L.; Moran, A. R. Age differences in male drivers perception of accident risk: The role of per-ceived driving ability. Accid. Anal. Pre. 18:299 314;
1986.
McGormick, I. A.; Walkey, F. H.; Green, D. E. Compara-tive perceptions of driver ability a con rmation and expansion. Accid. Ana. Prev. 18:205 208; 1986. Miltenburg, P. G. M.; Kuiken, M. J. The effect of driving
on visual search strategies: Results of a laboratory ex-periment. Report VK 90-24. Haren: Rijksuniversiteit Groningen; 1990.
Moe, D. Young drivers. Relation between perceived and real ability (in Norwegian). TFD Report 1984:5 . Stock-holm: Swedish Transport Research Board; 1984. Mourant, R. R.; Rockwell, T. H. Strategies of visual
search by novice and experienced drivers. Human Fac-tors 141325 335; 1972.
Potvin, L.; Champagne, F.; Laberge-Nadeau, C. Manda-tory driver training and road safety: The Quebec expe-rience. Am. J. Public Health 78:1206 1209; 1988.
Spolander, K. Accident risks of drivers. A model tested
on mean and women (in Swedish). VTI Rapport 268. Linköping: Swedish Road and Transport Research In-stiitute; 1983.
Spolander, K.; Rumar, K.; Lindkvist, F.; Lundgren, E. Safer beginner drivers. Suggestions for improved driver instruction (in Swedish). VTI Meddelande 404. Linköping: Swedish Road and Transport Research In-stitute; 1984.
Spolander, K. Men and women behind the wheel (in Swed ish). Stockholm: Statistiska Centralbyrån (SCB); 1992.