http://www.diva-portal.org
This is the published version of a paper published in Lindbergia.
Citation for the original published paper (version of record):
Jägerbrand, A., Jonsdottir, I., Økland, R. (2005)
Phenotypic variation at different spatial scales in relation to environment in two circumpolar bryophyte species.
Lindbergia, 30(3): 125-142
Access to the published version may require subscription.
N.B. When citing this work, cite the original published paper.
Permanent link to this version:
LINDBERGIA 30: 125–142. Lund 2005
Phenotypic variation at different spatial scales in relation to
environment in two circumpolar bryophyte species
Annika K. Jägerbrand, Ingibjörg S. Jónsdóttir and
Rune H. Økland
Jägerbrand, A. K., Jónsdóttir, I. S. andØkland, R. H. 2006. Phenotypic
varia-tion at different spatial scales in relavaria-tion to environment in two circumpolar bryophyte species. – Lindbergia 30: 125–142.
Morphology, physiology and biomass in two widespread bryophyte species,
Hylocomium splendens and Racomitrium lanuginosum, were studied to
ex-amine the extent to which different species exhibit similar phenotypic tion patterns within and across regions. Analyses of nine morphological varia-bles, chlorophyll content, nitrogen content, C/N ratio and biomass were con-ducted in samples from five sites in two geographically separated and climat-ically different regions, Iceland and northern Sweden. Both species exhibited large between-site variation in morphology, physiology and biomass, but with-in-site variation in morphology was substantially higher in Hylocomium
splen-dens than Racomitrium lanuginosum. Morphological patterns were partly
sim-ilar, partly different between the species, indicating that the two species re-spond morphologically to external factors on different scales. The lowest con-centrations of chlorophyll and nitrogen were found at the same sites for both species, while the site of highest concentration was not the same. In
Hyloco-mium splendens, chlorophyll content was positively correlated with biomass.
Many of the observed relationships between morphological, physiological vari-ables and biomass were species-specific. Our results demonstrate that the two bryophytes exhibit different phenotypic responses to environmental variation.
A. K. Jägerbrand (annika.jagerbrand@botany.gu.se),Dept of Plant and Envi-ronmental Sciences, Göteborg Univ., Box 461, SE- 405 30 Göteborg, Sweden. –I.S.Jónsdóttir,Univ. Centre in Svalbard, UNIS, P.O. Box 156, NO-9171 Longyearbyen, Norway. –R. H. Økland, Dept. of Botany, Natural History Mu-seum, Univ. of Oslo, P.O. Box 1172 Blindern, NO-0318 Oslo, Norway.
Accepted 27 April 2006 Copyright © LINDBERGIA 2006
Bryophyte species generally have wide distributions and many bryophytes are cosmopolitan in their distri-bution (Watson 1964). The relative importance of bryophytes generally increases towards higher lati-tudes and altilati-tudes (Vitt and Pakarinen 1977, Wielgo-laski et al. 1981), and in many taiga, tundra and po-lar ecosystems bryophytes are important in terms of cover, species richness, production, energy flow, bio-mass and nutrient cycling (Vitt and Pakarinen 1977,
Longton 1982, 1984, 1997, Matveyeva and Chernov 2000). Widely distributed species are exposed to a range of climatic and other environmental conditions, to which the phenotype must be able to respond ade-quately. Accordingly, many bryophytes exhibit pro-nounced phenotypic variation across climatic gradi-ents, in terms both of morphology and physiology (Longton 1979) either due to genetic variation or plas-tic response to the environment.
At high altitudes and latitudes plants grow more slowlyand reach lower maximum size than elsewhere. Accordingly, bryophytes exhibit progressive reduc-tion of annual growth, leaf length and leaf number,
latitudes and altitudes in both hemispheres (Longton 1979).
Significantrelationshipsbetweenmorphology and environmental gradients such as temperature, lati-tude and altilati-tude have been demonstrated for select-ed species (Montagnes and Vitt 1991, Heegaard 1997, Ross et al. 2001). Variation at regional (climate) and local scale (edaphic and microclimatic) in the branch-ing pattern of bryophyte species that proliferate asex-ually without specialised organs, may give important clues as to how responsive different species are to environmental change. Furthermore, improved know-ledge of the patterns of variation and of the mecha-nisms underlying these patterns,arelikelyto contri-butesignificantlytobryophyte ecology in general, and to our understanding of the role of bryophytes in ter-restrial ecosystems in particular.
However, several aspects of how bryophyte mor-phology varies along environmental gradients are poorly understood. Firstly, data on whole-plant char-acters like growth patterns (e.g. number of lateral branches) are sparse (Ross et al. 2001), but such in-formation is needed to address questions related to clonalityandgrowthformofbryophytes(Bates1998), whichinturnaffectshowbryophytesinfluence co-oc-curring plants and affect ecosystem processes. Sec-ondly, few studies have addressed the scales of mor-phological variation in bryophytes, i.e. from individ-ual via community to geographical region. Finally, it is not well known to which extent bryophytes exhibit species- or group-specific morphological constraints such as fixed branching patterns that may limit their ability to respond phenotypically to environmental variation (During 1990).
Bryophyte populations from different sites often respond physiologically to temperature variation in remarkably similar ways (Kallio and Heinonen 1973, Longton1979).However,thephysiologicalresponses of bryophytes in contrasting environments have been addressed in relatively few studies (but see Kallio and Heinonen 1973, Baddeley 1991), and the sparse lit-erature available demonstrate apparently contradic-tory patterns among species (Baddeley 1991, Nakat-subo et al. 1997). These observations suggest both species-specific, as well as interspecific variation in physiological reaction norms and point to our gener-al lack of knowledge of relationships between phe-notypic physiological variation and environment in bryophyte species.
This paper aims at describing phenotypic variation in two perennial clonal bryophytes in northern eco-systems at different spatial scales, using a range of morphological and physiological variables in
addi-and Racomitrium lanuginosum (Hedw.) Brid., were selected for the study.
Specifically, we address the following questions: (1) dodifferentspeciesexhibitsimilarmorphological,
physiological and biomass variation within and across regions? If response patterns to environ-mental variation are similar in both species, we predict phenotypic variation to be expressed on the same scale in both studied species.
(2) are patterns of variation in morphology, physio-logy and biomass related to each other?
We address these questions by recording nine mor-phological variables, three physiological variables (chlorophyll content, nitrogen content, C/N ratio, i.e. variables that reflect the outcome of physiological activity) and biomass of individual shoots as well as per unit area, at five sites from different altitudes, for each species. Material was collected from two regions, western Iceland with an oceanic climate and north-ern Sweden with a more continental climate.
Material and methods
The studied species Distribution and autecologyHylocomium splendens and Racomitrium lanugino-sum are among the best studied moss species (Tamm
1953, Tallis 1958, 1959a, 1959b, Kallio and Heinonen 1973, Baddeley 1991, Jónsdóttir et al. 1995, R. Øk-land 1995, 1997, 2000, R. ØkØk-land and T. ØkØk-land 1996, Cronberg et al. 1997, Rydgren et al. 1998). Both are perennial stayers in the life-strategy classi-fication of During (1979) and both are widespread.
Hylocomium splendens occurs from the temperate
zone to the High Arctic (Nyholm 1965, Schofield 1985) and is common over the Northern Hemisphere (Persson and Viereck 1983); Racomitrium
lanugino-sum is cosmopolitan (Tallis 1958). Hylocomium splendens prefers mesic habitats, and is a prominent
species in boreal coniferous forests (T. Økland 1996).
Racomitrium lanuginosum is favoured by a cold
ocea-nic climate and becomes more common with increas-ing climatic humidity and towards higher altidues and latitudes (Tallis 1964). Racomitrium
lanugino-sum prefers more exposed habitats (Vitt and Marsh
1988) such as summits, upland grasslands and heaths, and peatland hummocks (Tallis 1958).
wide range of habitats within a region [for
Hyloco-mium, see reviews by Persson and Viereck (1983) and
Callaghan et al. (1997); for Racomitrium, see Tallis (1959a)]. Hylocomium splendens is a weft-forming pleurocarpous bryophyte with sympodial or monopo-dial growth and primary, secondary and tertiary bran-ching (La Farge-England 1996). New growing points usually arise sympodially, but monopodial growing points are also occasionally found, arising by contin-ued growth of the main axis (R. Økland 1995, Ross et al. 2001). Branching mode, monopodial or sym-podial, is primarily determined by the environment, but also has a genetic component (Ross et al. 1998, 2001). In temperate areas, Hylocomium splendens has a modular growth pattern that provides distinct in-nate markers of the annual growth, regardless of bran-ching mode (Callaghan et al. 1978, R. Økland 1995, Callaghan et al. 1997, Ross et al. 1998, 2001). Typi-cally, one new segment is initiated every year (Tamm 1953) but aberrant branching patterns are also com-mon (R. Økland 1995).
The proportion of sympodially arising segments and the annual growth rate decrease significantly as en-vironmental conditions become harsher, e.g. with in-creasingaltitudeand/or latitude (Zechmeister 1995, Ross et al. 2001). With decreasing growth rates in-nate markers of annual growth gradually disappear in monopodially branching shoot chains, and seg-ment-based variables can no longer be used. In this study we therefore used morphological variables that could be recorded irrespective of branching mode and distinctness of innate markers of annual growth.
Racomitrium lanuginosum is cladocarpous with
monopodial growth (La Farge-England 1996) and has an elongated main stem with a variable number of lateral primary branches (Tallis 1959a, 1959b). The growth-form variability of Racomitrium lanuginosum is high, and several different “morphotypes” may be discerned along a continuum from long shoots with few branches to short compact shoots with many branches. Tallis (1959a) suggests that this variation may be environmentally induced. Racomitrium
lanug-inosum propagates clonally by prolonged growth of
lateral branches and subsequent detachment by de-composition. The two species are phylogenetically un-related (belong to different orders; Buck and Goffi-net 2000) and have basically different morphologies, although functionally equivalent units can be distin-guished that can be used in comparative morpholo-gical analyses.
Physiology
Previous studies on the physiology of Hylocomium
splendens and Racomitrium lanuginosum indicate
substantial differences. Hylocomium splendens has
been shown to exhibit relatively large physiological integration (Eckstein and Karlsson 1999), with con-siderable acropetal transport of nitrogen (Eckstein 2000), whereas studies in Racomitrium lanuginosum have showed that the nitrogen required for growth solely comes from precipitation (Nakatsubo 1990, Baddeley 1991). Redistribution of nitrogen in
Raco-mitrium lanuginosum is most likely externally by
cap-illary action (Jónsdóttir et al. 1995, Soares and Pear-son 1997) and nitrogen concentrations are extremely low (Vitt and Pakarinen 1977, Baddeley 1991, Jónsdóttir et al. 1995, Soares and Pearson 1997). The mean nitrogen residence time and annual nitrogen productivity of Hylocomium splendens are compara-ble with those of woody evergreen vascular plants (Eckstein 2000).
Hylocomium splendens and Racomitrium lanugi-nosum have different temperature optima for the
rela-tive growth rate: Hylocomium splendens grows most rapidly at 15–25 °C (Furness and Grime 1982) where-astemperatureoptimaof8–10°C(Tallis 1959a) and 13–15 °C (Tallis 1964) have been reported for
Raco-mitrium lanuginosum originating from different sites. Hylocomium splendens and Racomitrium lanugino-sum also have different temperature responses of net
assimilation and dark respiration (Dilks and Proctor 1975).
The nomenclature follows Söderström and Hedenäs (1998).
Study sites
Sites were chosen to represent areas with oceanic or continental climate as well as different altitudes. They were situated in two geographically separated subar-ctic regions; on western Iceland with an oceanic cli-mate (cool summers and mild winters) and in the Abisko area in northern Sweden with a relatively more continental climate.
Three sites at different altitudes were chosen in each region (Table 1). The Icelandic site Thingvellir is oce-anic and subarctic (cold tempered) and has high pre-cipitation whereas Armansfell and the west Icelan-dic highland site Audkuluheidi are subarctic-alpine with high and moderate precipitation, respectively. The lowest-situated Swedish site, Abisko, is subarc-tic with extremely low precipitation whereas the two other Swedish sites (Latnjajaure low elevation and Latnjajaure high elevation) are typical, subarctic-al-pine sites with high orographic precipitation. Avail-ability of meteorological data was used as an addi-tional criteron for selection of sites.
At each site, a 19-m transect running in west–east direction was selected with high occurrence of ho-mogeneous moss turfs and/or carpets for each of the studied species that was present. Two paired cores (diameter 7 cm) were collected systematically at eve-ry meter along each transect. One sample in each pair was used for biomass per unit area measurements (n=10 or 20 depending on species and site, Table 1), the other alternatively for morphological and indi-vidual shoot biomass measurements (n=10), and/or physiological analyses (chlorophyll n=10; nitrogen and C/N ratio, n=6–8).
In sites where one of the species was sparsely present the number of sample pairs was reduced to 10 (Table 1) and morphological and physiological variables were recorded in the same sample to obtain 10 replicate measurements. At some sites, chlorophyll content was recorded in one sample subset while the other subset was used for recording morphology, shoot biomass, nitrogen content and C/N ratio. For
Hylo-comium splendens this applies to Abisko and
Latnja-jaure low elevation, for Racomitrium lanuginosum to Thingvellir, Audkuluheidi, and Latnjajaure high elevation. For Racomitrium lanuginosum at Latnja-jaure high elevation every other sample was used for either morphological or physiological analyses as the variation in morphology was large, and adequate cov-erage of within-site variation in morphology and physiology was the specific aim. Sampling was car-ried out in Iceland in June 1996 and in Sweden in August 1996. The samples were dried at room tem-perature and stored dry in the dark
Morphological measurements
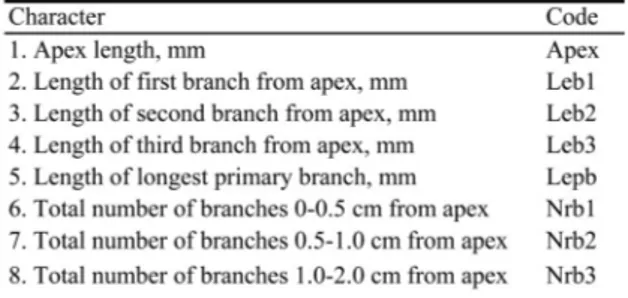
For each species, nine morphological variables were recorded on ten randomly selected moss shoots from each sample and site. Morphological variables relat-ed to branching patterns that were believrelat-ed to be strongly influenced by external conditions during de-velopment were identified and preferentially select-ed, resulting in eight morphological variables com-mon to both species. In addition, one species-specif-ic variable was recorded for each of the species (Fig. 1, Table 2).
All segments were recorded, irrespective of age or physiological state. This variable might thus be in-fluenced by differences in decomposition rates. For
Racomitrium lanuginosum we recorded the number
of green primary branches as an indicator of the po-tential physiological activity.
T
Physiological measurements
The physiological variables analysed were chloro-phyll, nitrogen content and C/N ratio. The first two were selected because of their role in photosynthesis. The C/N ratio gives further indication of nutrient sta-tus and how easily moss litter is decomposed (Nakat-subo et al. 1997). Analyses of chlorophyll were per-formed on green moss parts from each of the ten sam-ples (of each species from each site). Each sample was milled, weighed (at room temperature; 0.05 mg accuracy), and split into three subsamples. Two of the subsamples were analysed for chlorophyll con-tent and the mean value for the sample was used in subsequent statistical analyses. The third subsample was used for dry weight determination.
All chlorophyll analyses were completed within a two-week period in November 1996, to minimise among-sample variation in the degradation of chlo-rophyll. Ten ml of 80% acetone were added to each sample and the mixture was hand-shaken for 15 sec-onds before being centrifuged for 7 min at 3000 g. Light absorbance at wavelengths of 720 nm, 663 nm, and 645 nm was measured by a spectrophotometer (UV-visible recording spectrophotometer UV-240, Shimadzu Corp., Japan). Chlorophyll content was calculated according to Arnon (1949). Analyses of nitrogen and carbon were performed using eight sam-ples of each species from each site, chosen at random from the samples used for analyses of morphology, except in Racomitrium lanuginosum at Latnjajaure high elevation (se above).
Nitrogen and carbon contents were analysed on the apical 2 cm of five shoots. Material from the moss shoots was ground in liquid nitrogen to a fine-grained powder and dried to constant dry weight at 60 °C for 24 h. Samples of 2 mg were analysed on a CN-ana-lyser (Carlo Erba Elementaranalysator model 1106, Carlo Erba Strumentazione, Milano). The C/N ratio of the shoots was calculated and the N content was calculated as mg N g–1 dry weight.
Biomass measurements
Biomass was measured both for individual shoots and as biomass per unit area based on the whole sample. Mean shoot biomass (cut to 2 cm length) on 10 com-bined shoots was measured for each of the 10 sam-ples from each site, on the samsam-ples from morpholog-ical measurements. Measurements were made after drying to constant weight at 75 °C for 24 h. For each species,biomassmeasurementsperunitareawere made on 10 or 20 samples from each site (Table 1), after drying to constant dry weight at 75 °C (3 d).
Data analyses
Prior to analyses, all variables were transformed to zero skewness to achieve homogeneity of variances and meet normality assumptions (R. Økland et al. 2001, 2003). Variation in morphology was analysed separately for each species using (1) the first four axes of a principal component analysis (PCA; ter Braak 1983) of the data matrix of all 500 shoots×9 morphological variables, and (2) the morphological variables themselves. PCA was applied to centred and standardised variables, with axes scaled to optimise fit to inter-variable correlations. ANOVAs were used to test for between-site and within-site differences, followed by Fisher’s post-hoc test for between-site
Fig. 1. A schematic representation of the morphological variables used in the analyses. For code explanations, see Table 2.
Table 2. Morphological characters measured for
Hyloco-mium splendens and Racomitrium lanuginosum, with
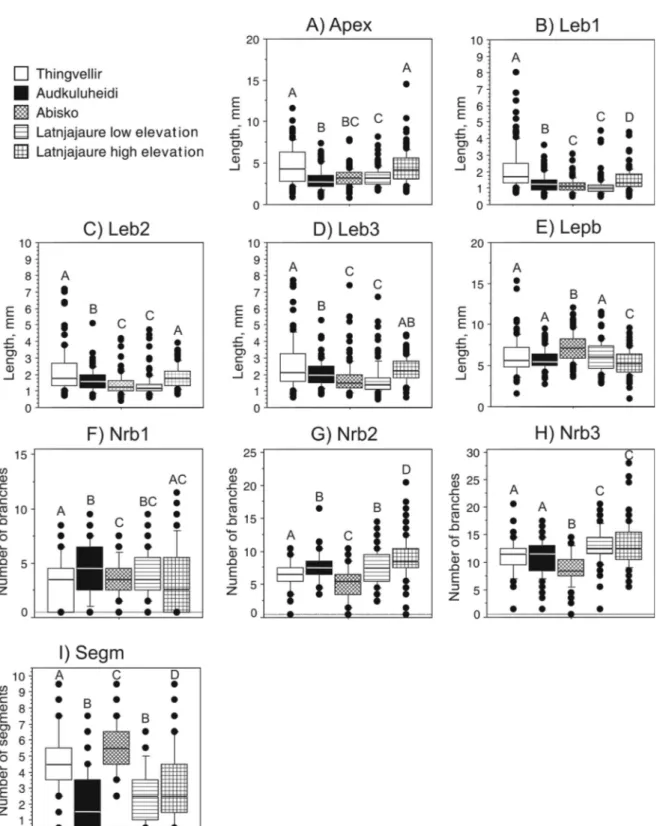
Fig. 2. Box plots of morphological characters of Hylocomium splendens in Iceland and northern Sweden. The median is indicated by the centred line in the box, the box indicate the 25th and 75th percentiles, the bars indicate the 10th and 90th percentile and single dots other observations. Sites with different letters were significantly different (Fisher’s PLSD) at P < 0.05. n = 500.
cal variables, shoot biomass and biomass per unit area, between-site differences were tested by ANOVA fol-lowed by the Tukey-Kramer post-hoc test (suitable for unequal sample sizes; Sokal and Rohlf 1995). Within-site variation in the physiological variables and biomass could not be statistically tested (as there were only 6-10 samples), and we therefore expressed the relative variation as coefficients of variation (Sokal and Rohlf 1995, Zar 1996).
Relationships between morphological variables (mean value from a sample) and other variables meas-ured in the same sample were expressed as matrices of Pearson’s product-moment correlations, separate-ly for each species. The Z-statistic was used to obtain p values for tests of independence (Zar 1996). Corre-lation coefficients between chlorophyll content and other variables were based on a lower number of ob-servations. Relationships between morphological and other variables measured in the same sample (the data sets used for correlation analyses but with chloro-phyll content excluded) were further analysed by or-dination. We initially used detrended correspondence analysis (DCA; Hill 1979) to check if the variables were likely to be linearly or unimodally related to the axes (R. Økland 1990). Short axes (< 3 SD units) suggested predominantly linear relationships and motivated use of the linear ordination method PCA to describe the patterns of variation (ter Braak and Šmilauer 1998). The same options were used as in the PCA of morphological variables.
Principal component analysis was performed by use of CANOCO 4.02 (ter Braak and Šmilauer 1998), for all other analyses, the Statview ® 5.0.1. software package was used.
Results
Variation between and within sites Hylocomium splendens
For Hylocomium splendens, the first four axes of the PCA of morphological variables explained 31.1, 17.7, 13.9 and 10.0% of the variation, respectively (a total of 72.8%). High positive loadings on PCA1 were ob-tained for branch lengths, apex length, and high neg-ative loadings were obtained in the near-apical number of branches, whereas high negative loadings on PCA2 were obtained for the number of sub-apical branches. The four axes showed significant segrega-tion of sites (Table 3), and also of variasegrega-tion within all sites (80%; or 16 out of 20 site-times-axes combi-nations). All single morphological variables were sig-nificantly different between sites (ANOVA; Table 3),
the number of segments differed significantly among samples within all five sites, and in the Audkuluhei-di site all morphological variables Audkuluhei-differed signifi-cantly among samples (Table 3).
The ANOVA followed by Fisher’s post-hoc test showed that the apex and the first and the second branchfromapexweresignificantlylongerin Thing-vellir and Latnjajaure high elevation (Fig. 2a–c), whereas the third branch was significantly longer in Thingvellir, Audkuluheidi and Latnjajaure high ele-vation (Fig. 2d). The length of the longest primary branch was highest in Abisko and the lowest in Lat-njajaure high elevation (Fig. 2e). The near-apical branches (Nrb1) were significantly more numerous at Audkuluheidi than at Thingvellir and Latnjajaure high elevation (Fig. 2f). The number of sub-apical branches (Nrb2) were the highest in Latnjajaure high elevation, and lowest in Abisko (Fig. 2g), and the number of sub-apical branches (Nrb3) was also low-est in Abisko whereas Latnjajaure low elevation and high had the highest numbers (Fig. 2h). The number of segments was significantly higher in Thingvellir and Abisko, compared to the other sites (Fig. 2i).
Between-site differences were found for the physi-ological variables and biomass per unit area (ANO-VA; Table 3), but not for shoot biomass. Coefficients of variation revealed high variation in physiological variables (Table 3). Abisko differed from all other sites by having significantly higher chlorophyll con-tent, highest nitrogen concon-tent, and lowest C/N ratio, whereas Audkuluheidi had lowest nitrogen content, highest C/N ratio, and significantly higher biomass per unit area (Tukey-Kramer post-hoc test; Fig. 4).
Racomitrium lanuginosum
For Racomitrium lanuginosum, the first four axes of the PCA of morphological variables explained 28.3, 22.2, 11.8 and 8.9% of the variation (a total of 71.1%), and showed significant differences between sites (ANOVA; Table 4). High negative loadings on PCA1 were obtained for the number of branches and green branches, and positive loading was found for apex length (59%). The apex and branch lengths all ob-tained high positive loadings on PCA2, while nega-tive loading was obtained for the near-apical number of branches. Within-site variation in sample scores was low for all four PCA axes; significant for a total of 4 out of 20 (20%) of the site-times-axes combina-tions (ANOVA; Table 4). Significant differences be-tweensiteswerefoundinallmorphologicalvariables (ANOVA;Table4),andsignificantvariationamong samples within sites was found for 16 out of 45
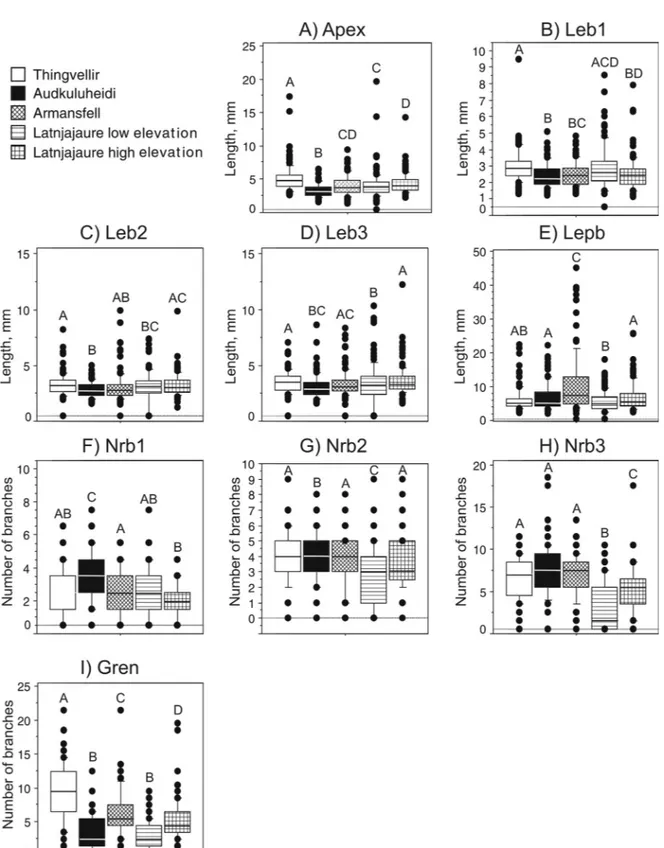
site-Fig. 3. Box plots of morphological characters of Racomitrium lanuginosum in Iceland and northern Sweden. The medi-an is indicated by the centred line in the box, the box indicate the 25th medi-and 75th percentiles, the bars indicate the 10th and 90th percentile and single dots other observations. Sites with different letters were significantly different (Fisher’s PLSD) at P < 0.05. n = 500.
variable for which no significant within-site varia-tion was found for any of the sites (Table 4).
Significant differences among some pairs of sites were found for all morphological variables (revealed byFisher’spost-hoctest;Fig.3).Lengthsofapexand the first, second and third branch were consistently lower in Audkuluheidi when compared to Thingvel-lir, although the longest third branches were found in Latnjajaure high elevation (Fig. 3a-d). However, the length of the longest primary branch did not fol-low these patterns, instead Armansfell had the long-est branches and Latnjajaure low elevation had the shortest branches (Fig. 3e). The number of branches was higher in Audkuluheidi, and lower in Latnja-jaure high elevation (Nrb1), and LatnjaLatnja-jaure low ele-vation (Nrb2, 3; Fig. 3 f-h). The number of green branches was higher in Thingvellir than in Lat-njajaure low elevation and Audkuluheidi (Fig. 3i).
Differences between sites were found in the physi-ological variables, shoot biomass and biomass per unit area (ANOVA; Table 4). High coefficients of varia-tion were obtained for many physiological and bio-massvariables(Table4).ArmansfellandLatnjajaure high elevation differed from the other sites by hav-ing higher chlorophyll, nitrogen content and lower C/N ratio (Tukey-Kramer post-hoc test; Fig. 4). Shoot biomass was highest in Audkuluheidi and lowest in Latnjajaure high elevation, whereas biomass per unit area was highest in Thingvellir (Fig. 4).
Correlations between morphological and physiological and biomass variables Hylocomium splendens
For Hylocomium splendens apex and distal branch lengths made up a group of strongly, positively, cor-related variables (Table 5) with which the length of the longest primary branch was weakly, but not sig-nificantly correlated. The number of branches in sub-apical sections (Nrb2 and Nrb3) were strongly corre-lated, and weakly so also with the number of near-apical branches (Nrb1). These two groups of vari-ables were negatively related to each other; apical and distal branch lengths most strongly with the number of near-apical branches, the length of the longest primary branch with numbers of branches in all sections (Table 5). As expected, a strong correla-tion was observed between nitrogen content and the C/N ratio. Few correlations were found between mor-phological and physiological variables, but the number of sub-apical branches (Nrb2) was positively correlated with the C/N ratio and shoot biomass, and
The first three axes of the principal component anal-ysis (PCA; Fig. 5a) for Hylocomium splendens ex-plained 31.6, 24.1, and 9.9% (a total of 65.6%) of the variation, respectively. The highest loadings on PCA1 were obtained for apex, distal branch lengths, length of the longest primary branch (positive) and numbers of branches in near-apical sections (Nrb1; negative), whereas the highest loadings on PCA2 were obtained for nitrogen content, number of seg-ments (positive), and C/N ratio, number of sub-api-cal branches (Nrb2, 3; negative; Fig. 5a). Abisko was distinctly separated in the PCA ordination, whereas the other sites overlapped, especially near the origin of the PCA ordination space.
Racomitrium lanuginosum
Correlation patterns among morphological variables were largely the same for Racomitrium lanuginosum as for Hylocomium splendens (Table 5), but differed in: the weaker (but still positive) relationships among apex and distal branch lengths; the stronger positive relationships among branch number variables; and the affiliation of the longest primary branch with the group of apex and branch lengths by the significant positive correlation with the length of the third branch (Leb3). The apex and distal branch lengths were pos-itively correlated with the number of green branch-es. The number of branches 1–2 cm below the apex was positively correlated with the length of the long-est primary branch. A positive correlation was also found between the shoot biomass and the numbers of near-apical and sub-apical branches. Further, posi-tive correlations were found between apex length and biomass per unit area, branch length of the first branch and C/N ratio, length of the longest primary branch and nitrogen content. Chlorophyll content was positively correlated with many variables, i.e. the length of the third branch from apex, the length of the longest primary branch, the number of branches 1–2 cm from apex, and the number of green branch-es (Table 5).
Facing page:
Fig. 4. Box plots of chlorophyll content (mg g-1 dry weight),
nitrogen content (mg g-1 dry weight), C/N ratio, shoot
bio-mass (mg) and biobio-mass per unit area (kg m-2) of
Hyloco-mium splendens and Racomitrium lanuginosum. The
me-dian is indicated by the centred line in the box, the box indicate the 25th and 75th percentiles, the bars indicate the 10th and 90th percentile and single dots other obser-vations. Sites with different letters were significantly
dif-The first three axes of the principal component anal-ysis(PCA;Fig.5b)forRacomitriumlanuginosum
ex-plained 29.8, 25.4, and 17.4% (a total of 72.6 %) of the variation, respectively. Highest loadings on PCA1 were obtained for near-apical number of branches (positive, Nrb1), and lengths of the first and second branch from apex, apex length, C/N ratio and bio-mass per unit area (all negative). Highest negative loadings on PCA2 were obtained for length of the longest primary branch, the number of sub-apical branches (Nrb2, 3) shoot biomass (Sbi), length of the
paratedinthePCAordinationforRacomitrium lanu-ginosum than for Hylocomium splendens (Fig. 5).
Discussion
Variation between and within sites
Our results show patterns of morphological variation in the two species Hylocomium splendens and
Raco-mitrium lanuginosum that are partly similar, partly
significantly different. Variables reflecting recent growth show similar trends among sites in the two species, whereas other variables (likely to reflect growth over longer time-scales), show inconsistent patterns of variation. This demonstrates the difficul-ties involved in relating morphology to environment; aggravated by large within-site variation and com-plex patterns of variation.
Despite similar proportions of morphological var-iation explained by the first four PCA axes in both species, morphological variation is much higher in
Hylocomium splendens. Species may show
morpho-logical variability at the population and regional scales (Vitt 1980) that varies from very high to insig-nificant. In Hylocomium splendens, numerous fac-tors may influence the patterns of morphological var-iation, e.g. fine-scaled experimental disturbance (Ry-dgren et al. 1998), or site differences (R. Økland 1997, 2000, R. Økland and Bakkestuen 2004). Furthermore,
Hylocomium splendens has been shown to have high
genetic variation within populations as well as be-tween populations (Cronberg et al. 1997; Cronberg 2004). Thus, Hylocomium splendens is not only a highly genetically differentiated moss species, but it is also capable of exhibiting complex patterns of morphological variation, expressed at several spatial scales and in relation to variation in the environment. Our results show that Hylocomium splendens shows high morphological variation which may be either a result of its large genetic variation within sites, or may be due to a wide phenotypic plasticity.
Tallis (1959a) suggested that the many varieties and forms (i.e. growth patterns) of Racomitrium
lanuginosum represent environmental modifications.
Vitt and Marsh (1988) report regional differences in fine-scaled morphological characters in Racomitrium
lanuginosum as well as within-population
morpho-logical variation along moisture gradients, which in-dicate responsiveness to microclimatic variation. Our results clearly show that between-site differences ex-ist, but leaves open how much of the morphological variation that originates from environmental modi-fications and genetical differences, respectively.
We predicted a relationship between the number of
Fig. 5. Principal component analysis (PCA) bi-plot dia-grams on Hylocomium splendens and Racomitrium
lanug-inosum from Iceland and northern Sweden. The length and
direction of arrows indicate the realtive importance of the variables. (A) Hylocomium splendens. The diagram ex-plains 55.7% of the variation. n = 34. (B) Racomitrium
lanuginosum. The diagram explains 55.1% of the
varia-tion. n = 31. For morphological code explanations, see Table 2, and N=nitrogen content, C/N=C/N ratio, Sbi=shoot biomass, Bio=biomass pe
gressive morphological reduction towards higher al-titudes and laal-titudes (Longton 1979). However, our results indicate that the two species show different patterns of morphological variation in relation to the environment. In Hylocomium splendens we expect-ed environmental conditions to modify the number of segments, but contrary to the findings of Ross et al. (2001), we found no such trends. This indicates that other factors than the environment also affect the number of segments (Økland 1997).
Patterns of between-site variation in chlorophyll, nitrogen, C/N ratio, shoot biomass and biomass per unit area are mostly significantly different between the two species. For instance, the lowest concentra-tions of chlorophyll and nitrogen are found at the same sites for both species, whereas the highest con-centrations do not occur at the same site for both spe-cies. Nevertheless, our results for Hylocomium
splen-dens accord with those of Bazzaz et al. (1970), who
found lower concentrations of chlorophyll at an al-pine than a lowland site for Polytrichum
juniperi-num, and the study by Nakatsubo et al. (1997) on Hylocomium splendens; lower nitrogen
concentra-tions are reported from sites with lower mean tem-perature. Our results for the nitrogen content of
Racomitrium lanuginosum do, on the other hand,
accord with those of Baddeley (1991) for the same species; he found increasing nitrogen concentrations with increasing altitudes.
We do not know if the observed species-specific differences apply to the species in general, reflecting contrasting relationships of the two species to the en-vironment, or if they are idiosyncratic, brought about by particularities of our study sites (and those of the studies above, providing supporting results). How-ever, bryophytes are known for their species-specific ecophysiology, e.g. in their growth rates and temper-ature responses (Furness and Grime 1982). It there-fore seems very likely that such physiological differ-ences will be reflected in different patterns of varia-tion in variables like those recorded in our study. Dif-ferences between the species were also found in the magnitudes and the amount of variation of the phys-iological variables. Our results therefore indicate that bryophyte species may differ in their responses to environmental variation, a result quite opposite of those normally recorded for vascular plants. For ex-ample, in vascular plants, the effects (a smaller final size) of a lower temperature on growth on plants at high altitudes and latitudes are well known (Billings and Mooney 1968, Chapin and Shaver 1985), and there is a clear relationship between increased nitro-gen content with increasing altitude and latitude (Körner 1989).
The collection of samples at different time points during the growing season might, in theory,
influ-ence the variation in chlorophyll content in this study. However, significant differences between sites rather than between regions indicate that the time point of collection was probably of minor importance, in ac-cordance with the well-known ability of bryophytes to withstand long periods of desiccation (Proctor 1981, 1982).
We expected dry weight and biomass per unit area to decrease with increasing latitude or environmen-tal harshness, but our results do not show any specif-ic trends in that direction, apart from some indspecif-ica- indica-tions of lower shoot biomass of Racomitrium
lanug-inosum in northern Sweden than in Iceland. For
bio-mass per unit area, our results fail to comply with general predictions of decreasing bryophyte biomass with increasing latitude in the Arctic and Antarctic (Russell 1990). Many factors may confound the pat-tern expected, e.g. interference by local environmen-tal gradients (Russell 1990), decomposition, and other factors such as volcanic ash content and grazing. Furthermore, the biomass in a single sample unit most often comprises both intact and dead parts of the moss when innate growth markers are not used to stand-ardise the length of periods over which the biomass has accumulated (R. Økland 1995).
Relationships between morphological and physiological variables and biomass
Both species show high separation between sites when analysed by the multivariate method PCA, this is most strongly seen for Racomitrium lanuginosum. Com-pared with Hylocomium splendens, Racomitrium
lanuginosum exhibits less within-site morphological
variation, but in Racomitrium lanuginosum the phys-iological variables explain somewhat more of the to-tal variation in morphological variables, physiologi-cal variables and biomass than in Hylocomium
splen-dens. Racomitrium lanuginosum also shows
strong-er relationships among morphological variables, physiological variables and biomass, as well as strong-er variability in genstrong-eral. Some of our results indicate that bryophyte phenotypes are shaped by external, most probably environmental factors, as the same two groups of positively correlated variables (apex and branch lengths, and branch numbers)areidentified bycorrelationanalysisofthe morphological variables for both species.
Even though we find both coincident and diver-gent correlation patterns, most correlations are spe-cies-specific. Congruent patterns are found in quite basic characteristics such as the number of branches and shoot biomass, and nitrogen content and C/N ratios. Opposing patterns for the two species are found in the length of the longest primary branch and the
reflecting complex differences in the morphological constitution of the species.
Chlorophyll content is an estimate of the photo-synthetic capacity (Kallio and Valanne 1975) and is, in vascular plants, highly correlated with light and nutrient conditions (Seemann et al. 1987). In bryo-phytes photosynthesis is strongly dependent on wa-ter availability (Kallio and Kärenlampi 1975, Proc-tor 1990) so that climate and especially precipitation may play a large role for the chlorophyll content. We therefore expected chlorophyll or nitrogen content to peak at the same sites as biomass per unit area, as chlorophyll and nitrogen are usually assumed to be indirectly responsible for growth. This is supported by a positive correlation between biomass per unit area and chlorophyll content in Hylocomium
splen-dens, and in Racomitrium lanuginosum by a positive
correlation between the number of green branches and chlorophyll content.
Our results thus demonstrate a clear and interpret-able pattern of photosynthetic capacity and biomass per unit area in Hylocomium splendens, while no re-lationship between nitrogen content and biomass is observed in any species. In fact, the opposite is found: the lowest nitrogen content and the highest C/N ra-tio are observed in the sites with highest biomass per unit area for both species. This contrasts with the close relationship in vascular plants between nitro-gen supply and increases in biomass (Larcher 1995), and the answer may be that vascular plants and bryo-phytes have somewhat different physiology and ecol-ogy, and that bryophytes are usually not limited in their growth by nitrogen, but by water availability.
The observed patterns and its implications
Our results demonstrate that the two bryophytes ex-hibit different phenotypic responses to the environ-ment at the two different scales explored. An impor-tant implication is that to be able to predict respons-es of the important bryophyte-dominated ecosystems to environmental change, e.g. climatic change. Such species-specific responses of the dominating species need to be considered. The large phenotypic varia-tion among and within sites as well as among spe-cies observed by us indicate that site-specific ecosys-tem responses to environmental change are likely to occur.
Several studies (Potter et al. 1995, R. Økland, 1995, 1997, 2000, T. Økland et al. 2004) report predictable responses of bryophyte growth to external, notably climatic, factors, and recommend use of bryophytes
tween phenotypes of bryophytes and the environment is too complicated to allow simple generalisations, over species, over morphological and physiological characters, and over broad-scaled climatic gradients. Therefore, generalisations of bryophyte phenotypic variation beyond the simple relationship between growth and the length of the effective growing sea-son should be made with great care.
Acknowledgements – Norm Kenkel, Einar Heegaard and
Margit Fredriksson are thanked for different kinds of help. This study was supported by Swedish Natural Science Re-search Council (to ISJ), and by Abisko stipendiefond, Adler-bertska forskningsfonden, Kapten Carl Stenholms, Lars Hiertas Minnesfond, Th. Kroks, Wilhelm och Martina Lun-dgrens fond, Överskottsfonden, Jubileumsfonden (Göte-borg University) and NorFA. All of these are gratefully acknowledged.
References
Arnon, D. I. 1949. Copper enzymes in isolated chloroplasts. Polyphenoloxidase in Beta vulgaris. – Plant Physiol. 24: 1–15.
Baddeley, J. A. 1991. Effects of atmospheric nitrogen dep-osition on the ecophysiology of Racomitrium
lanugi-nosum (Hedw.) Brid. – PhD thesis, Univ. of
Manches-ter.
Bates, J. W. 1998. Is ‘life-form’ a useful concept in bryo-phyte ecology? – Oikos 82: 223–237.
Bazzaz, F. A., Paolillo, D. J. Jr. and Jagels, R. H. 1970. Photosynthesis and respiration of forest and alpine pop-ulations of Polytrichum juniperinum. – Bryologist 73: 579–585.
Billings, W. D. and Mooney, H. A. 1968. The ecology of arctic and alpine plants. – Biol. Rev. 43: 481–529. Buck, W. R. and Goffinet, B. 2000. Morphology and
clas-sification of mosses. – In: Shaw, A. J. and Goffinet, B. (eds), Bryophyte biology. – Cambridge Univ. Press pp. 71–123.
Callaghan, T. V., Collins, N. J. and Callaghan, C. H. 1978. Photosynthesis, growth and reproduction of
Hylocomi-um splendens and PolytrichHylocomi-um commune in Swedish
Lapland. Strategies of growth and population dynam-ics of tundra plants 4. – Oikos 31: 73–88.
Callaghan, T. V., Carlsson, B. Å., Sonesson, M. et al. 1997. Between-year variation in climate-related growth of cir-cumarctic populations of the moss Hylocomium
splen-dens. – Funct. Ecol. 11: 157–165.
Chapin, F. S. III and Shaver, G. R. 1985. Arctic. – In: Chabot, B. F. and Mooney, H. A. (eds), Physiological ecology of North American plant communities. Chap-man and Hall, pp. 16–40.
Cronberg, N. 2004. Genetic differentiation between popu-lations of the moss Hylocomium splendens from low versus high elevation in the Scandinavian mountain range. – Lindbergia 29: 64–72.
Dilks, T. J. K. and Proctor, M. C. F. 1975. Comparative experiments on temperature responses of bryophytes: assimilation, respiration and freezing damage. – J. Bry-ol. 8: 317–336.
During, H. J. 1979. Life strategies of Bryophytes: a pre-liminary review. – Lindbergia 5: 2–18.
During, H. J. 1990. Clonal growth patterns among bryo-phytes. – In: van Groenendal, J. and de Kroon, H. (eds), Clonal growth in plants: regulation and function. SPB Academic Publishing, pp. 153–176.
Eckstein, R. L. 2000. Nitrogen retention by Hylocomium
splendens in a subarctic birch woodland. – J. Ecol. 88:
506–515.
Eckstein, L. R. and Karlsson, S. P. 1999. Recycling of ni-trogen among segments of Hylocomium splendens as compared with Polytrichum commune: implications for clonal integration in an ectohydric bryophyte. – Oikos 86: 87–96.
Furness, S. B. and Grime, J. P. 1982. Growth rate and temperature responses in bryophytes. II. A comparative study of species of contrasted ecology. – J. Ecol. 70: 525–536.
Heegaard, E. 1997. Morphological variation within
An-dreaea blyttii in relation to the environment on
Hardan-gervidda, western Norway: a quantitative analysis. – Bryologist 100: 308–323.
Hill, M. O. 1979. DECORANA – A FORTRAN program for detrended correspondence analysis and reciprocal averaging. – Cornell Univ.
Jónsdóttir, I. S., Callaghan, T. V. and Lee, J. A. 1995. Fate of added nitrogen in a moss-sedge Arctic community and effects of increased nitrogen deposition. – Sci. To-tal Environ. 160/161: 677–685.
Kallio, P. and Heinonen, S. 1973. Ecology of
Rhacomitri-um lanuginosRhacomitri-um (Hedw.) Brid. – Rep. Kevo Subarct.
Res. Stat. 10: 43–54.
Kallio, P. and Kärenlampi, L. 1975. Photosynthesis in mosses and lichens. – In: Cooper, J. P. (ed.), Photosyn-thesis and productivity in different environments. The international biological programme. Cambridge Univ. Press, pp. 393–423.
Kallio, P. and Valanne, N. 1975. On the effect of continu-ous light on photosynthesis in mosses. – Ecol. Stud. 16: 149–162.
Körner, C. 1989. The nutritional status of plants from high altitudes. A worldwide comparison. – Oecologia 81: 379–391.
La Farge-England, C. 1996. Growth form, branching pat-tern, and perichaetial position in mosses: cladocarpy and pleurocarpy redefined. – Bryologist 99: 170–186. Larcher, W. 1995. Physiological plant ecology.
Ecophysiological and stress physiology of functional groups. -Springer-Verlag.
Longton, R. E. 1979. Climatic adaptation of bryophytes in relation to systematics. – In: Clarke, G. C. S. and Duck-ett, J. G. (eds), Bryophyte systematics. Syst. Ass. Spec. Vol. No. 14. Academic Press, pp. 511–531.
Longton, R. E. 1982. Bryophyte vegetation in polar re-gions. – In: Smith, A. J. E. (ed.), Bryophyte ecology. Chapman and Hall, pp. 123–165.
Longton, R. E. 1984. The role of bryophytes in terrestrial ecosystems. – J. Hatt. Bot. Lab. 55: 147–163. Longton, R. E. 1997. The role of bryophytes and lichens
in polar ecosystems. – In: Woodin, S. J. and Marquiss,
M. (eds) Ecology of Arctic environments. Blackwell Sci-ence, pp. 69–96.
Matveyeva, N. and Chernov, Y. 2000. Biodiversity of ter-restrial ecosystems. – In: Nuttall, M. and Callaghan, T. V. (eds), The Arctic: environment, people, policy. Har-wood Academic Publishers, pp. 233–273.
Montagnes, R. J. S. and Vitt, D. H. 1991. Patterns of mor-phological variation in Meesia triquetra (Bryopsida: Meesiaceae) over an Arctic-boreal gradient. – Syst. Bot. 16: 726–735.
Nakatsubo, T. 1990. Primary production and nitrogen econ-omy of Racomitrium lanuginosum at the subalpine la-va field of Mt. Fuji. – Proc. Bryol. Soc. Jpn 5: 65–70 (in japanese with english summary).
Nakatsubo, T., Uchida, M., Horikoshi, T. et al. 1997. Com-parative study of the mass loss rate of moss litter in boreal and subalpine forests in relation to temperature. – Ecol. Res. 12: 47–54.
Nyholm, E. 1965. Illustrated moss flora of Fennoscandia. II. Musci. Fasc.5. – Gleerup, Lund.
Økland, R. H. 1990. Vegetation ecology: theory, methods and applications with reference to Fennoscandia. – Som-merfeltia suppl. 1: 1–233.
Økland, R. H. 1995. Population ecology of the clonal moss
Hylocomium splendens in Norwegian boreal spruce
for-ests. I. Demography. – J. Ecol. 83: 697–712.
Økland, R. H. 1997. Population biology of the clonal moss
Hylocomium splendens in Norwegian boreal spruce
for-ests. III. Six-year demographic variation in two areas. – Lindbergia 22: 49–68.
Økland, R. H. 2000. Population biology of the clonal moss
Hylocomium splendens in Norwegian boreal spruce
for-ests. 5. Vertical dynamics of individual shoot segments. – Oikos 88: 449–469.
Økland, R. H. and Bakkestuen, V. 2004. Fine-scale spa-tial patterns in populations of the clonal moss
Hyloco-mium splendens partly reflect structuring processes in
the boreal forest floor. – Oikos 106: 565–575. Økland, R. H. and Økland T. 1996. Population biology of
the clonal moss Hylocomium splendens in Norwegian boreal spruce forests. II. Effects of density. – J. Ecol. 84: 63–69.
Økland, R. H., Økland, T. and Rydgren, K. 2001. Vegeta-tion-environment relationships of south boreal spruce swamp forests in Østmarka nature reserve, SE Norway. – Sommerfeltia 29: 1–190.
Økland, R. H., Rydgren, K. and Økland, T. 2003. Plant species composition of boreal spruce swamp forests: closed doors and windows of opportunity. – Ecology 84: 1909–1919
Økland, T. 1996. Vegetation-environment relationships of boreal spruce forest in ten monitoring reference areas in Norway. – Sommerfeltia 22: 1–349.
Økland, T., Bakkestuen, V., Økland, R. H. et al. 2004. Changes in forest understory vegetation in Norway re-lated to long-term soil acidification and climatic change. – J. Veg. Sci. 15: 437–448.
Persson, H. and Viereck, L. A. 1983. Collections and dis-cussions of some bryophytes from Alaska. – Lindber-gia 9: 5–20.
Potter, J. A., Press, M. C., Callaghan, T. V. et al. 1995. Growth responses of Polytrichum commune and
Hylo-comium splendens to simulated environmental change
– Adv. Bryol. 1: 79–166.
Proctor, M. C. F. 1982. Physiological ecology: water rela-tions, light and temperature responses, carbon balance. – In: Smith, A. J. E. (ed.), Bryophyte ecology. Chap-man and Hall, pp. 333–381.
Proctor, M. C. F. 1990. The physiological basis of bryo-phyte production. – Bot. J. Linn. Soc. 104: 61–77. Ross, S. E., Callaghan, T. V., Ennos, A. R. et al. 1998.
Mechanics and growth form of the moss Hylocomium
splendens. – Ann. Bot. 82: 787–793.
Ross, S. E., Callaghan, T. V., Sonesson, M. et al. 2001. Variation and control of growth-form in the moss
Hylo-comium splendens. – J. Bryol. 23: 283–292.
Russell, S. 1990. Bryophyte production and decomposi-tion in tundra ecosystems. – Bot. J. Linn. Soc. 104: 3– 22.
Rydgren, K., Økland, R. H. and Økland, T. 1998. Popula-tion biology of the clonal moss Hylocomium splendens in Norwegian boreal spruce forsts. 4. Effects of exper-imental fine-scale disturbance. – Oikos 82: 5–19. Schofield, W. B. 1985. Introduction to Bryology. –
Mac-millan.
Seemann, J. R., Sharkey, T. D., Wang, J. L. et al. 1987. Environmental effects on photosynthesis, nitrogen use efficiency and metabolic pools in leaves of sun and shade plants. – Plant Physiol. 84: 796–802.
Soares, A. and Pearson, J. 1997. Short-term physiological responses of mosses to atmospheric ammonium and ni-trate. – Water Air Soil Pollution 93: 225–242. Sokal, R. R. and Rohlf, F. J. 1995. Biometry, ed. 3. –
Free-man.
Söderström, L. and Hedenäs, L. 1998. Checklista över Sveriges mossor. – Myrinia 8: 58–90.
Tallis, J. H. 1958. Studies in the biology and ecology of
Rhacomitrium lanuginosum Brid. I. Distribution and
ecology. – J. Ecol. 46: 271–288.
Tallis, J. H. 1959a. Studies in the biology and ecology of
Rhacomitrium lanuginosum Brid. II. Growth,
reproduc-tion and physiology. – J. Ecol. 47: 325–350.
Tallis, J. H. 1959b. Periodicity of growth in
Rhacomitri-um lanuginosRhacomitri-um. – J. Linn. Soc. Lond. 56: 212–217.
Tallis, J. H. 1964. Growth studies on Rhacomitrium
lanu-ginosum. - Bryologist 67: 417-422.
Tamm, C. O. 1953. Growth, yield and nutrition in carpets of a forest moss (Hylocomium splendens). – Medd. Stat-ens Skogsforskningsinst. 43: 1–140.
ter Braak, C. J. F. 1983. Principal components biplots and alpha and beta diversity. – Ecology 64: 454–462. ter Braak, C. J. F. and Šmilauer, P. 1998. CANOCO
refer-ence manual and user’s guide to Canoco for Windows: software for canonical community ordination (version 4). – Microcomputer Power, 1–352.
Vitt, D. H. 1980. The Genus Macrocoma. II. Geographi-cal variation in the Macrocoma tenue-M. sullivantii spe-cies complex. – Bryologist 83: 437–450.
Vitt, D. H. and Marsh, C. 1988. Population variation and phytogeography of Racomitrium lanuginosum and R.
pruinosum. – Nova Hedwigia 90: 235–260.
Vitt, D. H. and Pakarinen, P. 1977. The bryophyte vegeta-tion, production and organic components of Truelove Lowland. – In: Bliss, L. C. (ed.), Truelove Lowland, Devon island, Canada: a high arctic ecosystem. Univ.
– Hutchinson.
Wielgolaski, F. E., Bliss, L. C., Svoboda, J. et al. 1981. Primary production of tundra. – In: Bliss, L. C., Heal, O. W. and Moore, J. J. (eds), Tundra ecosystems: a com-parative analysis. Cambridge Univ. Press, pp.187–226. Zar, J. H. 1996. Biostatistical analysis. 3d ed. –
Prentice-Hall Int., Inc.
Zechmeister, H. G. 1995. Growth of five pleurocarpous moss species under various climatic conditions. – J. Bryol. 18: 455–468.