EFO705 – “Changing consumer’s attitude of energy drinks in Thailand
market”
-A case study of Thai consumer behavior toward energy drinks-
Master Thesis in Business Studies
Authors Group: 2789 Suratssawadee Kuptanon (870113) Thanathorn Pichittachakul (831226) Supervisor Peter Selegård Examiner Ole Liljefors
II
Abstract
Date: 2011-05-25
Program: MIMA-International Marketing Course name: Master Thesis (EFO705)
Title: Changing consumer’s attitude of energy drinks in Thailand market. A case study of Thai consumer behavior toward energy drinks.
Authors: Suratssawadee Kuptanon (870113) Thanathorn Pichittachakul (831226) Supervisor: Peter Selegård
Problem: How to change the attitude of Thai young adult consumer regarding to energy drink?
Purpose: To describe and analyze the attitude of Thai young adult consumer that effect to the energy drink market in order to develop and change their attitude in the positive way. Furthermore, give the recommendation about the appropriate way to maintain and increase the market share and customer for the marketer.
Method: This research use both qualitative and quantitative in the questionnaire survey to conduct the real behavior and attitude of young adult in Thailand market. Basically, the data collection method also divided into two sources which are primary data and secondary data. Moreover, the total respondents in this research are 400 who are young adult and live in Bangkok, Thailand. Also, the theories of attitude change strategies, attitudes and consumer perception are use in this research.
Conclusion: The results from the survey show the opportunities for marketer to change their customer attitude by use the main instruments which are advertising and marketing campaigns.
Keyword: consumer behavior, change attitude, change behavior, energy beverage, and social drinking
III
Acknowledgement
Over the period of conducting this paper, we have encounters lots of constraints and difficulties. Without the helping hands, we would never accomplish the mission. Therefore, we would like to dedicate this acknowledgement page for those that have contributed to our research.
First of all, we would like to express gratitude to the project adviser, Peter Selegård, for being generously instructive all along the semester. The appreciation also goes to the authors’ main and side opponents from group 2675 for their suggestions which are valuable for this paper. We also would like to thank all those who took the time to answer our questionnaire. Lastly, thanks for our family that always support us and give the opportunity to write this paper.
Suratssawadee Kuptanon (870113) Thanathorn Pichittachakul (831226)
I
Table of contents
List of abbreviations ... IV List of Figure ... V List of table ... VI 1. Introduction ... 1 1.1 Background ... 1 1.2 Problem Statement ... 2 1.3 Strategic question ... 2 1.4 Research question ... 2 1.5 Purpose ... 2 1.6 Scope of research... 3 1.7 Target Audiences ... 3 1.8 Disposition ... 3 2. Conceptual framework ... 52.1 Consumer perception and brand perception ... 5
2.2 Promotion ... 6
2.3 Integrated Marketing communications (IMC) ... 7
2.4 Brand Position ... 9
2.5 Attitude ... 10
2.6 Attitude change strategies ... 10
3. Methods and research design ... 12
3.1 Selection of topic ... 13
3.2 Literature Review ... 13
3.2.1 Methods for the critical literature review ... 13
3.2.2 Keywords ... 13
II
3.2.4 Mapping and describing the literature ... 14
Mapping ... 14
Reasoning for selected literature ... 15
3.2.5 Critical literature review ... 15
A Study of attitude towards energy drinks in Thailand ... 15
Energy Beverage ... 17
A Structural Theory of Attitude Dynamics... 17
Behavior Management and Behavioral Change ... 17
Young adults’ social drinking as explained by an augmented theory of planned behavior ... 18
Consumer response to gift promotion. ... 19
IMC: a consumer psychological perspective ... 19
Relationship of Consumer Attitude and Brand ... 20
3.3 Research Method ... 21
3.3.1 Primary Data... 21
3.3.2 Level of Scale and type of scale ... 23
3.3.3 Reliability Test ... 24
3.3.4 Validity of research ... 25
3.3.5 Interpret of mean value. ... 26
3.3.6 Secondary Data. ... 26
4. Empirical Finding... 28
4.1 Primary Finding... 28
4.2 Secondary Finding ... 40
5. Analysis ... 42
5.1 The 4 factors that influence on Thai young adult to buy energy drinks ... 42
5.1.1Brand Perception ... 42
III
5.1.3 Integrated Marketing Communication (IMC) ... 45
5.1.4 Brand Positioning ... 47
5.2 The perception and attitude of Thai young adult towards energy drinks ... 49
5.2.1 A cognitive component ... 49
5.2.2 An affective component ... 50
5.2.3 A behavioral (conative) component ... 51
6. Conclusion ... 53
7. Recommendation ... 55 Bibliography: ... V Appendixes ... XI
IV
List of abbreviations
Ads = Advertising
CIA = Central Intelligence Agency CSR = Corporate Social Responsibility EBs = Energy beverages
IMC = Integrated Marketing Communication PBF = Positive Behavior Facilitation
V
List of Figure
Figure 2.1: Conceptual Framwork... 5
Figure 2.2: Decision-Making Process of consumer according to their perception ... 6
Figure 2.3: Marketing Communication Wheel ... 8
Figure 2.4: Example of positioning Map ... 9
Figure 2.5: Attitude Components ... 10
Figure 3.1: Research Process Flow ... 12
Figure 3.2: Map of Literature Review ... 14
Figure 3.3: Yamane’s Equation ... 21
Figure 4.1: Kind of Drinks ... 28
Figure 4.2: First brand of energy drink ... 30
Figure 4.3: Most favorite brand of respondents ... 30
VI
List of table
Table 3.1: Database and Website ... 13
Table 3.2: Level and type of Scale ... 24
Table 3.3: Cronbach’s Alpha of each topic... 25
Table 3.4: Factor and Key Influences ... 26
Table 4.1: Have you ever drink energy drink? ... 29
Table 4.2: What is your opinion about energy drink? ... 29
Table 4.3: How often do you drink energy drink ... 31
Table 4.4: Mean value for the way to purchase energy drinks... 31
Table 4.5: Mean value of reasons for purchasing energy drink ... 32
Table 4.6: Mean value of influence advertisment ... 33
Table 4.7: The interpetatins of weight mean score ... 33
Table 4.8: Mean value and interpetation of important factors ... 34
Table 4.9: Mean value and interpetation of respondents expect from energy drink ... 34
Table 4.10:Mean value and interpetation of respondents who percieve ReDbull ... 35
Table 4.11: Mean value and interpetation of respondents who percieve Krarabow Daeng... 35
Table 4.12: Mean value and interpetation of respondents who percieve M-100 or M-150 ... 35
Table 4.13: Mean value and interpetation of respondents who percieve Shark ... 36
Table 4.14: Mean value and interpetation of respondents who percieve Lipovitan-D ... 37
Table 4.15: Mean value, standard deviration, and intrepretation of Brand Positioning ... 37
Table 4.16: Mean value, standard deviration, and intrepretation of Brand Perception ... 38
Table 4.17: Mean value, standard deviration, and intrepretation of Promotion ... 38
Table4.18:Mean value, standard deviration, and intrepretation of Intrgrated Marketing Communication (IMC) ... 38
Table 4.19: Personal data of respondents ………39
Table 5.1: Table of Cognitive Component………49
Table 5.2: Table of Gender and Respondents’ Opinion………50
Table 5.3: Chi-Square Tests of Gender and Respondents’ Opinion………50
Table 5.4: Table of Gender and Frequency of Drink Energy Drinks………51
1
1. Introduction
According to CIA World Fact book, 2011, Thailand located in Southeastern Asia, which has the total population approximately 66,720,153. It can generate to three age structures; 0-14 years = 19.9%, 15-64 years = 70.9%, 65 years and over = 9.2%. This number shows that the second category is the biggest part of Thailand population, so the main customer of food and drink business will be this category. Moreover, the traditional food of Thailand consists of rice in every meal also has the unique combinations of seasoning such as hot and spicy (Advameg, 2011). Therefore, the temperature of Thailand is hot so many of drinks in Thailand which will contain ice because people would like to refreshing coolness (Famouswonders, 2011).
Although, there are many kinds of drinks in Thailand like other country in the world but it did not have the unique drink pattern because Thai people concentrate on food more than drink and absorb the beverage products from other country. However, Thailand also has their own famous energy drink called “Krating Daeng” or “Red Bull” in the world market but this two brands are not from the same company, because Mr.Chaleo Yoovidhya from T.C. Pharmaceutical Company discovered Krating Daeng. Furthermore, Dietrich Mateschitz from Austria founded Red Bull GmbH with 49 percent partner of Mr.Chaleo Yoovidhya and his son (Fundinguniverse, 2006).
1.1 Background
Nowadays the market of energy drink in Thailand is mighty powerful. The estimated consumption of energy drink per person is 11.5 liters that place in top five highest consumers includes Austria, Ireland, New Zealand, Slovenia and Kuwait (Asia Food Journal, 2008). There are many famous brands in the market such as M 150 with the highest market share about 55%, Red Bull and Carabao Daeng with 20% (Food Industry Network, 2011). The view market share of its about 15,000 billion baht (1 USD = 30.41 baht) in 2008 (Gazebo, 2008) and this rate are rising up each year. On the other hand, the image of energy drink for Thai young adult is negative because Thai people thought that the people who drink energy drink is blue collar like a truck driver or construction worker. In addition, blue collar market in Thailand already becomes saturated then many companies try to expand their market to teenagers and white collar workers by mixing with other beverage (Fit, 2011).
2 Therefore, if we could get the reasons of consumer behavior and can change the attitude of Thai people especially young adult to the positive way, it will increase the total market share of this market.
1.2 Problem Statement
This research tries to discover the real attitude of Thai young adult in order to increase the brand reputation and reduce the obstacles that affect the energy drink industry. The market in Thailand is already saturated as mentioned in the introduction part above. Therefore, the company in energy drink industry can take advantage from this research by using as a reference for developing or launching their marketing strategies to the customer.
1.3 Strategic question
Regarding to the problem statement, we can summarize the main objective of this research and develop our strategic question as follows:
“ How to change the attitude of Thai young adult consumer regarding to energy drink? ”
1.4 Research question
Main Research QuestionThe effect of four factors (Brand Positioning, Brand Perception, Promotion, and Integrated Marketing Communication) when change the attitude in Thai young adult?
Sub Research Questions
-What are the present consumer behaviors of Thai young adult toward energy drink? -What are the brand perceptions of energy drinks in Thai young adult?
-Do the promotion of energy drink has affect to the customer or not?
-Which integrated marketing communication methods for energy drinks that important for attract Thai young adult?
-Where are brand positions of energy drinks in Thai young adult mind?
1.5 Purpose
The objective of this research is to describe and analyze the attitude of Thai young adult consumer that effect to the energy drink market in order to develop and change their attitude in the positive way.
3
1.6 Scope of research
To answer the main research objective and also the research questions, the main answer will come from Thai young adult who live in Bangkok. The total population in Bangkok is approximately 5,716,248 when compares the 76 provinces in country out of the total population in Thailand (Cps, 2009). Thus, we choose only Thai young adult in Bangkok to be our target. The other areas of Thailand will not include in this research. Moreover, the real attitude of them will be the main key to analyze and change into the positive way that benefits to energy drink market.
1.7 Target Audiences
According to this research is trying to study the real attitude of Thai young adult and change them into the positive way. Therefore, the outcome of this research will beneficial to the private sector which is the marketing manager or business owner of energy drink company because the present market of Thailand is already saturate as shown in the introduction part above, so this research will benefit for someone who interested in the real attitude of new customer (Thai young adult) and would like to change the target market. In addition, the government sector also has benefit from this research also because it will increase country cash flow from the second beverage market of Thailand (Fit, 2011).
1.8 Disposition
This part gives the readers more understand about the research which contains the explanation of each part by divided into different chapter. This research divided into 7 chapters as follows.
Firstly, is introduction chapter which included problem statement, strategic question, research question, purpose, scope of research, and target audience for make the clear point of view for the reader to follow this research. Secondly, is conceptual framework part that presents the theories about consumer perception, attitude, as well as attitude change strategies. To make the readers more understand about what are theories that already used in this research. Thirdly, is methods and research design chapter which included topic selection, literature review, research method and also effective factors to change young adult’s attitude. Likewise, this chapter definitely focused on the sample size of this research for launching questionnaire to do research.
Fourthly, is empirical finding chapter. We already divided into two parts which are primary finding (SPSS) and secondary finding (The Internet). We collected the data from respondents and calculated them by using SPSS program for primary finding. Furthermore, we already
4 gathered the information from the Internet to support the primary finding. Next chapter is analysis chapter. We already separated into two part which included the four factors that influence Thai young adult to buy energy drink as well as the perception and attitude of Thai young adult towards energy drinks by comparing with the different variables.
Lastly, the sixth chapter and seventh chapter are conclusion and recommendation. In conclusion part is concluded the whole part and result of the research and analysis are presented. The recommendation chapter will be presented the recommend from the authors by creating the marketing strategy for suitable with the energy drink in Thailand market.
5
2. Conceptual framework
In order to analyze the critical literature review about change in consumer attitude, we will come to the place with theories that now describe in this conceptual framework part.
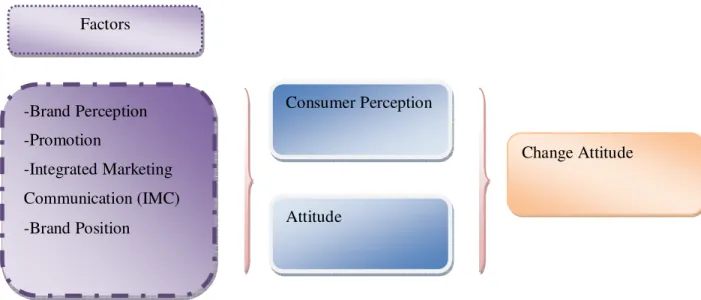
Consequently, the critical literature review consisted of three main areas, which are consumer attitude, energy beverage and change in behavior. Furthermore, they also have the relationship that connects to the main idea of this research, which is change consumer attitude. Then it will lead us to the three main theories which are consumer perception, attitude and change attitude. Moreover, three main theories also divided into sub theories which are brand perception, promotion, integrated marketing communication (IMC), and brand position as shown in the figure below.
Source: Own Illustration
2.1 Consumer perception and brand perception
Evans, Jamal and Foxall (2009) defined the consumer perception as “the process whereby stimuli are received and interpreted by the individual and translated into a response”. This sentence means that marketer should stimulate their customer to receive and converts the information before purchasing their products. The figure below illustrated the decision making process of consumer according to their perception by use Howard Sheth model. This model shows the whole process while consumers have their decision-making toward product since inputs, perceptual constructs and learning constructs until action (Churcher, 1998).
Consumer Perception Attitude Change Attitude -Brand Perception -Promotion -Integrated Marketing Communication (IMC) -Brand Position
Figure 2.1: Conceptual Framework Factors
6 Figure 2.2: Decision-Making Process of Consumer According to Their Perception
Source: Churcher. (1998). Foundation of Senior Management. Retrieved April 3, 2011, from http://famouswonders.com/thai-drinks/
From the illustration above shows that the decision-making of customer start with each element in inputs which are significative, symbolic, and social. Then the next process is perceptual construction that customer will transform their input to their perceptual constructs. Therefore, the perceptual constructs will change to learning constructs from the experience about products. The last process is outputs that can arise within five different aspects by the action of customer.
The important thing for marketers is the consumer’ perspective which is the marketers should empathize more and think in term of what benefits consumers buy and how they perceive products and brands (Evans, Jamal & Foxall, 2009). It is very important that marketers should understand the position of their own brands (Evans et al., 2009).
2.2 Promotion
Sales promotion consists of short-term incentives, in addition to the basic benefits offered by the product or service, to encourage the purchase or sale of a product or service (Kotler, Armstrong, Wong, & Saunders, 2008). It is the direct inducements to the consumer to make a purchase (Peter & Olson, 2008). Sales promotion includes a wide variety of promotion tools designed to stimulate earlier or stronger market response. The tools are used by many organizations and may be targeted towards the consumer or final buyer, business customers, the trade or retailer and the company’ sales force (Kotler, Armstrong, Wong, & Saunders,
7 2008). The many types of sales promotions including temporary price reductions through coupons, rebates, and multipack sales; contests and sweepstakes; trading stamps; trade shows and exhibitions; point-of-purchase displays; free samples; and premiums and gifts can lead to the definition that sales promotions are oriented at changing consumer’s immediate purchase behaviors (Peter & Olson, 2008).
Kotler, Armstrong, Wong, and Saunders (2008) defined sales promotion objectives by consider the consumer promotions as;
2.2.1 Increase short-term sales 2.2.2 Build long-term market share
2.2.3 Urge consumers to try a new product
2.2.4 Lure consumers away from competitors’ products 2.2.5 Encourage consumers to “load up” on a mature product
2.2.6 Reward loyal customers, hence enhancing long-term customer relationships
Moreover, sales promotions also help to reinforce the product’s position and build long-term customer relationships and build brand equity by promoting the product’s positioning and reinforcing the selling message (Kotler, Armstrong, Wong, & Saunders, 2008).
2.3 Integrated Marketing communications (IMC)
The evolution of Integrated Marketing Communication (IMC) has two origins, first is marketers began to realize that advertising, public relations, and sales were often at odds regarding responsibilities, budgets, management input and myriad other decisions affecting the successful marketing of a brand. The second is marketing perspective itself began to shift from being market oriented to market driven (Advameg, 2011).
The integrated marketing communications is the concept under which a company carefully integrates and coordinates its many communications channels to deliver a clear, consistent and compelling message about the organization and its products (Kotler, Armstrong, Wong, & Saunders, 2008).
8 Figure 2.3: Marketing Communication Wheel (define definition)
Source: taylor-ms (2010). Marketing communication Wheel. Retrieved May 9, 2011, from http://www.taylor-ms.co.uk/page2.htm
IMC leads to a total marketing communication strategy aimed at building strong customer relationships by showing how the company and its products can help customers solve their problem and also ties together all of the company messages and images (Kotler, Armstrong, Wong, & Saunders, 2008). In addition, each element in the illustration above is the IMC tool that use in the market which include sales promotion, advertising, public relations, direct marketing, e-marketing, personal selling, and exhibitions. The definition of each element is as follow;
- Advertising: is any paid form of non-personal presentation and promotion of ideas, goods or services by an identified sponsor.
- Public relations: is the marketer should build good relationship with the company’s various publics by obtaining favorable publicity, building up a good image, and handling or heading off unfavorable rumors, stories and events.
- Personal selling: are the people that sell the product direct to the customer such as salespeople, sales representatives and account executives.
- Sales promotion: are the short-term incentives to encourage purchase or sales of a product or service.
9 - E-marketing: can also called online marketing which the company efforts to market products and services and build relationship with customer via internet (Kotler et el., 2008).
- Direct marketing: is a channel free approach for marketer to distribute and communicate with their customer. Therefore, the company should create their strategies to dealing with their customer directly (Marketing teacher, 2000-2011). - Exhibitions: are the human activities, enterprises, undertaken for definite reasons and
in order to achieve certain specified results. The results of exhibitions can perform by human thought and activity (Beier & Dambock, 2011).
2.4 Brand Position
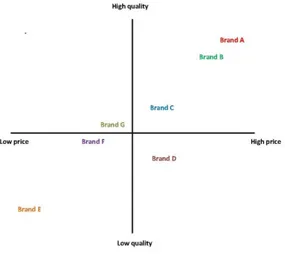
The positioning is the process that marketers create an image of the product and its quality in customers’ minds and the most effective way of positioning a company’s product is to know the customer segment and concentrate on understanding the target group, and creates an image that matches with customers’ needs and wants (Ghauri & Cateora, 2010). Peter and Olsen (2008) argued that the position strategies can be accomplished by developing a coherent strategy that may involve all of the marketing mix elements.
Figure 2.4: Example of Positioning Map
Source: smartkpis (2010), Posioning Map. Retrieved May 9, 2011,from http://www.smartkpis.com/blog/tag/perceptual-maps/
Therefore, marketers should plan their differentiation and positioning strategies and prepare perceptual positioning maps, which show consumer perceptions of their brands versus competing products on important buying dimensions as shown in the figure 2.4 above about the example position of brand in the market (Kotler, Armstrong, Wong, & Saunders, 2008).
10
2.5 Attitude
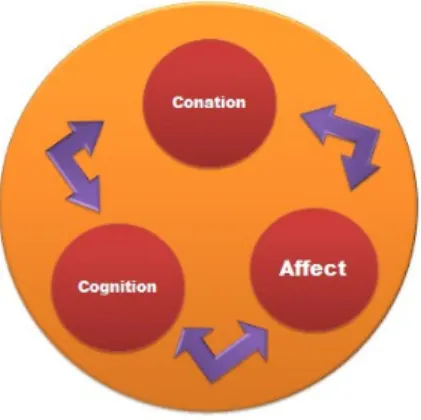
The second theory that we use in this research is attitudes. There are a lot of definitions of attitude and this topic is already study more than a century. But all of them have one thing in common that is the person’s overall evaluation of a concept (Peter & Olson, 2008). In addition, an attitude has three components: cognitive (beliefs), affective (emotions) and conative (intentions):
A cognitive component – consists of individual’s beliefs or knowledge about an issue or and object.
An affective component – consists of individual’s feelings (positive and negative) or emotions about the issue of the object.
A behavioral (conative) component – consists of how individual actions to the object based on what they know about it and how they feel about it (Evans, Jamal and Foxall, 2009).
Figure 2.5: Attitude Components
Source: Eduinn (2010). Tricomponent Attitude Model. Retrieved April 3, 2011, from http://www.eduinn.pk/2010/06/edureadings-tricomponent-attitude-model.html
2.6 Attitude change strategies
The attitude-change strategies are the last theory in this research. This theory consists of four categories that are:
Adding a new salient belief – to the existing beliefs that consumers have about product or brand.
11 Changing the strength of already salient beliefs – marketer should increase or decrease the strength about positive and negative attributes and consequences of consumer.
Changing the evaluative aspect of an existing strongly held belief – by linking a more positive, higher-ordered consequence to the attribute.
Make an existing favorable belief more salient – by convincing consumers that the attribute is more self-relevant than it seemed (Peter & Olson, 2008).
12
3. Methods and research design
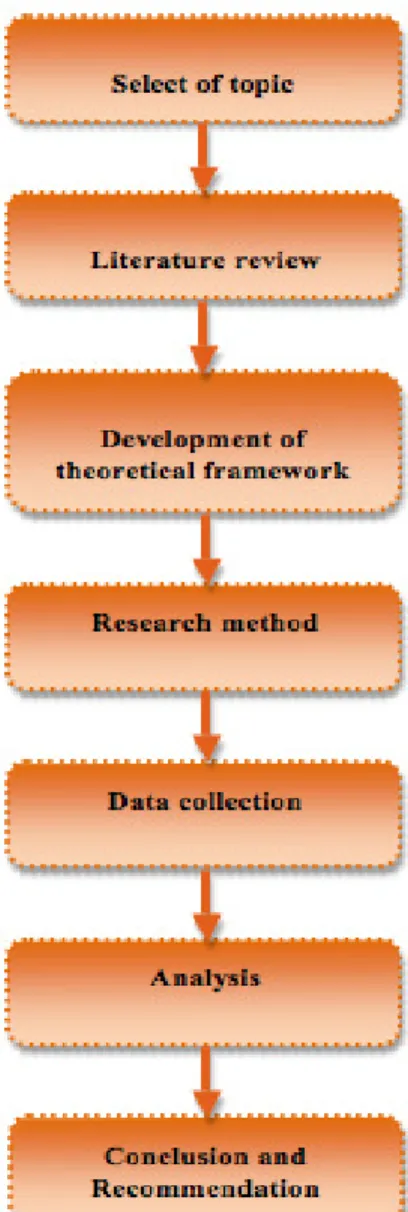
This section showed how the research is developed by divided into difference topics as shown in the illustration below;
Figure 3.1: Research process flow
13
3.1 Selection of topic
Despite the second largest proportion in the Thai beverage market, the Thai consumers still have the negative attitude of this beverage. Most of them are perceived that this kind of beverage is served for the specific consumers such as blue collar only. This is the attractive point that the authors would like to know what the reasons behind this point are. Moreover, this research can help the energy drink company to expand their business to the other market segment that is young adult. Because the total population of young adult in Thailand are more than other age structure as mentioned in the introduction part.
3.2 Literature Review
3.2.1 Methods for the critical literature review
At this point, we choose keywords and databases operated for our research as follows; 3.2.2 Keywords
Below are keywords that were selected five keywords to use operating for literature reviews. Consumer behavior Change attitude Change behavior Energy beverage Social drinking 3.2.3 Database/Website
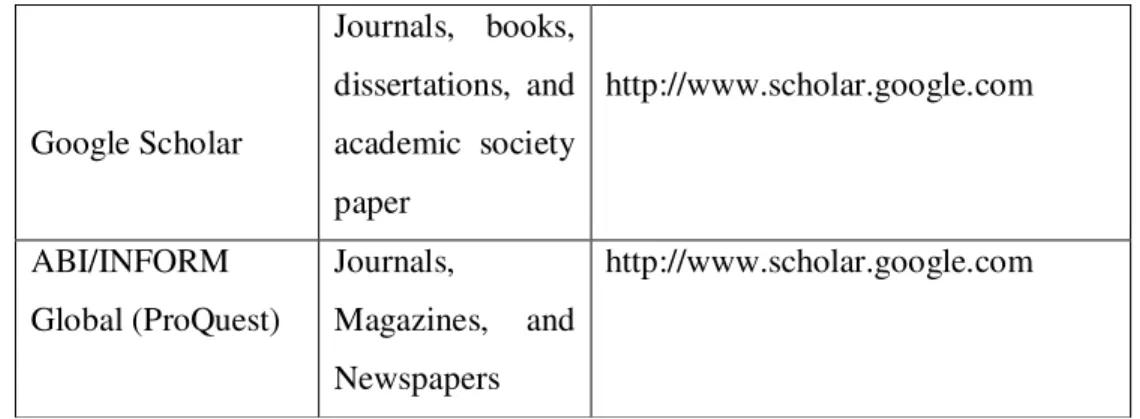
The table below has four databases for supporting this research. We choose eight articles to explore the research. We certainly look for information by using Libhub database, EBSCO HOST database, Google Scholar, as well as ABI/INFORM Global (ProQuest) database.
Databases/Website Content URL
Libhub Journals and
articles
http://ep.bib.mdh.se:3583/libhub?fun c=search&language=en
EBSCO HOST Journals, articles http://search.ebscohost.com/
14 Table 3.1: Databases and Websites
Source: Own Illustration
3.2.4 Mapping and describing the literature Mapping
Below are circles that have the important point in our research. There is four points that closely relate to energy drink have been presented such as: social drinking, consumer behavior, change attitude, and also consumer attitude. All of them were illustrated in the figure below.
Source: Own illustration
According to figure 3.2, social drinking has effect to change attitude for young adult’ social drinking. Another circle can also relate well to change attitude like consumer behavior, which effect directly from social drinking and consumer behavior. Changing attitude is the main factor of consumer attitude. Then, attitude structure influences to change attitude of Thai young adult behavior.
Google Scholar Journals, books, dissertations, and academic society paper http://www.scholar.google.com ABI/INFORM Global (ProQuest) Journals, Magazines, and Newspapers http://www.scholar.google.com Change Attitude Attitude structure Consumer behavior Consumer attitude Social drinking
15 Reasoning for selected literature
According to research question, we have to find the information to support research question, hence we have to select eight literatures to relevant with the topic. We tried to choose many articles that have reliable and strength to the point for the research as follows; Energy Beverage, A Structural Theory of Attitude Dynamics, Behavior Management and Behavioral Change, Young Adults’ Social Drinking as Explained by An Augmented Theory of Planned Behavior, Relationship of Consumer Attitude and Brand, A Study of attitude towards energy drinks in Thailand, Consumer responses to gift promotion as well as relationship of consumer attitude and brand. These literatures have shown the deep research evidence. Besides, we quite concern of date published of each literature because the information will up to date. Thus, we will choose the literature reviews since 2007 to 2011.
3.2.5 Critical literature review
The most essential but also complex in the research is a critical literature review that is correct and direct to a specific field or interest (An, 2011). Therefore, we also tried to find the literatures that correct and direct to our research topic. Furthermore, the overall of eight literatures are described about the attitude, energy drink and consumer behavior. In consequence, the explanation below is the brief conclusion of each literature that related to our research.
A Study of attitude towards energy drinks in Thailand Authors: Asiraphot V. and Waleetroncheepsawat W.
This literature is about a study of attitudes towards energy drinks in Thailand. According to Asiraphot & Waleetroncheepsawat (2009), the authors have mentioned the energy drinks which they have studied. Their objective is to help its manufacturing to understand how each group think of energy drink in order that the entrepreneur would get beneficial from this research to make an adaptation for increasing satisfaction to provide their consumer that have different groups. Moreover, the authors have studied the attitude of consumer in many perspectives such as the product, price, distribution channel, as well as promotion.
They have chosen six theories to analyze their research. There are the demographic of respondents, personal data and frequencies of consumption, overall attitude towards marketing mix, personal data and attitudes towards marketing mix, consuming frequencies and attitude towards product, price, and promotion as well as non-consumers at different demographic features and their attitudes. Firstly, in the majority of their respondents are female and young with high education (upper high school) but they have to compare the other research about the demographic as well. The majority of respondents are male and young
16 with low education (lower high school). Secondly, the result of personal data and frequencies of consumption is males consume energy drink rather than female. Thirdly, respondents all groups have the same results that have high positive attitudes toward place. Their results agree that energy drinks are easily purchased. Furthermore, some groups have positive attitudes towards price and promotion but have quite positive attitudes toward product features. Besides, the result of place of this research is highest which shown that the consumers is easily bought at conveniences stores and supermarkets. Although, this research is agreed on both advertisement and promotion, but the other research only is agreed on advertising. Fourthly, respondents have different attitudes towards marketing mix in price, place as well as promotion excepted place. However, the main elements of the marketing mix should be developed. Fifth, this research analyzed that "regular consumers’ attitudes are more similar to results of other researches than non regular consumers’ and non-consumers’ attitudes mainly because results from other researches are mostly on energy drinks regular consumers. Other researches also have high attitudes towards place most, then price and promotion, and towards product least. Lastly, the authors mentioned all respondents and consumers at different age have different results on promotion. All respondents and non-consumers at different education have different results on price and promotion. All respondents and non-consumers at different income have different results on promotion. The rest results of all respondents and non-consumers are identical." (Asiraphot & Waleetroncheepsawat, 2009).
The authors have recommended about their research that in the part of product, the manufacturer could add vitamins, minerals, and antioxidants in the product to increase the benefit of the product. Moreover, they should produce their product to provide it suitable for a new generation. They should develop the packaging, label, and design of the product to be interesting. Likewise, age has the effect towards energy drinks consumer such as younger respondents has positive attitudes towards product more than older respondents. When the respondents have strongly high attitude towards price of energy beverages, producer has adaptation to make on price that can be offering larger size at the same size. In the part of promotion, they should concern about the advertising instead of promotional campaign. Accordingly, using advertising as well as promotional campaign can use with the young female labors and also students who have low income because they quite have low or fair attitudes towards promotion (Asiraphot & Waleetroncheepsawat, 2009).
17 Energy Beverage
Authors: Higgins JP, Tuttle TD, Higgins CL.
In various countries, exercise is recovery again in the present time, which has the benefit to prevent who are concerned fatness. Thus, energy drinks or called “sport drinks”. Firstly, energy drinks were developed to provide electrolyte and carbohydrate replacement. Subsequently, energy beverages (EBs) included stimulants and additives in most gyms and grocery. Moreover, target of EBs is primarily that toward young men and openly promoting psychoactive, performance enhancing, as well as stimulatory effects. The energy drinks have many components such as: Caffeine, Taurine, Glucuronductone, B-vitamins, Guarana, Ginseng, Sugar, L-carnitine, Ginkgo biloba, as well as antioxidants. Thus, the energy drink is quite useful some people but some people should get the any advising from the physician especially patients because EBs extremely included many ingredients. which it can lead to harmful effects and possibly death. Thereto, it is the risk of hearth disease and hypertension as well (Higgins, Tuttle and Higgins, 2010).
A Structural Theory of Attitude Dynamics Authors: Milton J. Rosenberg
According to Rosenberg (2011), he said that attitudes can be change by modify in either the beliefs or feelings which connected with people. It divided two types for changing by used structure theory as follows; First changes is population of person that has varying effect of their attitude toward some social object there exist correlate and consistent variation in beliefs about the object and also support to the theoretical proposition, which structure consistency is a basic condition for the appearance of the attitude change. The second type changes in feeling toward objects were influenced among hypnosis and in the posthypnotic. This article shows us about the structure theory of attitude dynamics that have developed by way of elaboration as well as extension of this comprehension. Thereto, this literature review is about the attitude concept, which is restricted to the notion of emotional “einstellung”. It can be characterized as either “positive” or “negative” as Rosenberg said (Rosenberg, 2011). Behavior Management and Behavioral Change
Authors: Edna Olive
The goal of Positive Behavior Facilitation is “to support adults in understanding the differences between behavior management and supporting the behavior change of another person which can divide into two-fold” (Olive, 2007). Firstly, is the awareness which is critical addressing behavior and it is the first point continuum of creation. Secondly, adults used their relationship and created environment to support their behavior change. It is
18 impossible that adults would change behavior of another person. In addition, behavior management bases on two ordinary concepts. There are positive reinforcement and also negative reinforcement. Thus, PBF will be effectively, if it requires a balanced and structured combination of behavior management as well as supporting behavior change which there are quite required awareness as well. Although a supporting behavior change is motivated for others to change but they may not be motivated to change. According this literature, research has distinctly shown that some environment has to first be well-managed if learning is to take place (Dreikurs, Cassel, & Ferguson, 2004; Nelesen). Thus, Olive, 2007 concluded “understanding about the differences between behaviour management and behaviour change can help adult”. Moreover, If the authors have already chosen to support the behavior change of adult or youth, they have to remind that they are making a commitment and choice that requires more than the typical responses to behaviour. Furthermore, commitment to supporting the change of youth requires somehow create the time in an already full schedule to create meaningful relationships with youth. In addition, it is essential to understand and accept that the environment in which youth are asked to function and behave can make a dramatic difference in their willingness or resistance to change (Olive, 2007).
Young adults’ social drinking as explained by an augmented theory of planned behavior Authors:Friederike Zimmermann and Monika Sieverding
The study of this literature concentrated on young adults alcohol consumption in social contexts. The authors used the theory of planned behavior (TPB) as well as prototype/willing model to do their research. The authors have launched questionnaires approximately 300 copies (age around 25 years old). The theory of planned behavior concerned about well known in the field of health psychology which is very benefit basic of framework for understanding alcohol intake in appearing adulthood. Likewise, this literature mentioned, “attitude towards the behaviour reflects the global positive or negative evaluation of performing the target behaviour”. This article had shown the harmful that related in particular to these drinking episodes such as; drunk driving, unsafe sex, accidents and also being a victim of sexual assault. Moreover, application to alcohol consumption may gain profit from a different social-cognitive approach that includes prescriptive attraction in the form of prototype awareness. The result of this research is the women have high rate of drinking alcohol more than the men. The main of interaction indicated that willingness led to heavy drinking particularly among those men who made the negative evaluations of the abstainer prototype. Hence, the gender roles have lower which is discussed in light of traditional
19 gender roles and also current trends in alcohol consumption (Zimmermann & Sieverding, 2010).
Consumer response to gift promotion.
Authors: Teresa Montaner, Leslie de Chernatony and Isabel Buil
The purpose of this paper is to help the reader to understand easily about the factors that effect on consumers’ responses toward gift promotions. Especially, the objective is to analyse four variables such as: the first is the nature of the promoted product. The second is the fit between the product and the gift. The third is the type of brand used in the promotion and the last is deal-proneness. Moreover, d’Astous and Jacob’s (2002) study was one the first to research into the influence of many factors on consumer reactions to gift promotions. Moreover, gifts are used the affect on attitude and purchase intentions of potential consumers, sustain or enlarge purchases by existing consumers, along with other short term purpose (Bodur and Grohmann,2005). Definitely, these authors have studied the impact of three categories of variables on gift promotions success: Firstly, is objective characteristics of the offer (whether the value of the gift was mentioned). Secondly, is attitudinal variable (the interest in the product, interest in the gift or the attitude toward the brand) and lastly, is consumer characteristics (deal proneness or compulsive buying tendencies). They use the hypotheses for their research, and their result is in high equity brand has influenced by the promoted product and the gifts have perceived fit which has a positive influence on value perceptions. On the contrary, promotion of medium equity brands does not depend on the perceived fit but the products should have fit promoted product only. Finally, product and gift fit have extremely influenced on consumers’ evaluation in the case of high equity brand, but it did not effect when the promoted brands were of medium equity brands (Montaner et al, 2011)
IMC: a consumer psychological perspective Authors: Christopher Hackley and Philip Kitchen
The authors attempt to explain about a broader contextual approach, marketing and communications theory and IMC, multidisciplinarity in marketing and management research, social cognition and IMC, as well as the social constructionist perspective and IMC. This literature review is talking about the concept of integrated marketing communication or IMC which is “receiving increasing attention in many and practitioner media, primarily from an organizational perspective” (Hackley & Kitchen, 1998). Therewith, in part of message can attract for more consumption, as well as it has various available media technologies which is
20 quite effect on consumer perceptions (Dawson, 1996). Doubtless, reflection in common models of the communications process such as hierarchy of effects indicate that the most important feature of marketing communication content are reasonable attraction based on product features. Hackley and Kitchen, 1998 said “ If knowledge or information is the prime mover in consumer reaction to advertising or other forms of marketing communication, then favorable product information would seem to be the most powerful element of message content”. Thereto, if the organization will have the powerful meaning of message, they should have “creativity” to design communication to customer. In conclusion, IMC has a rationale in consumer psychology from two perspectives: firstly, it depends on consumers build their meanings from within a flow of organizational communication excess time as single, then secondly, creativity is influenced on consumer perspective as well as it has the powerful meaning relation to the object concerned which is brand and organization in the consumer’s social environment (Hackley & Kitchen, 1998).
Relationship of Consumer Attitude and Brand Authors: Jūratė Banytė, Eglė Jokšaitė, Regina Virvilaite
In regard to Banyte, Jokšaite and Virvilaite, 2007, is solving the problem that related with the influence of emotions defining of consumer attitude towards a brand. The effect of emotion and feelings on the attitudes’ formation need to inspect sense as a source of emotions. Nevertheless, the customers’ experience after touching with a good or brand that is defined as emotion. It may have many level of strength and may changes up to situation as well as product. The experience research attempting to investigate the influence of emotions for formation of emotionally this based attitude towards PEPSI brand (Banyte, Jokšaite & Virvilaite, 2007). Likewise, the authors explained that the conception was specified and the attitude is acquired, it is quite relative permanent, gradual and at the same time, it has purposeful then, the purpose of a consumer to react to particular object. Moreover, Schiffman and Kanuk (2004) stated that the attitude has a three-component model which consists of three mains component part such as cognition, emotion and intentions (Banyte, Jokšaite et al., 2007). The basic way of changing attitude is emotional as followed the model of attitude formation. It will allow forming or changing consumer attitude to brand. However, the attitude has the positive and negative which it depends on the three main factors as follows. Firstly, is perception or knowledge. Secondly, is feelings or emotion. Lastly, are willing or behaviour tendencies. Moreover, this literature used the balance theory and it studies “ the relationship of elements that are evaluated by people as interrelated and subjectively perceived as relationship of three elements that provide attitude structures, defined as triads”
21 (Banyte et al. 2007). Furthermore, this literature has mentioned about Fishbein’s model of attitude towards an object as Solomon et al. (2002) stated chosing only four ways that can change consumer’s attitude. The first is Emphasize relative advantages. The second is strengthening conceivable relationship of the product and its attribution. Next is Introduce new attributes. The last is change the opinion about the competitor.
M. Lindstrom has presented sensual theory which it concentrates all the attention to the five senses such as: sight, hearing, smell touch and taste which have influence to change attitude towards product or service (Linstrom, 2005). In conclusion, the emotional and senses have the effect to change consumer emotional as well as consumer attitude on product as this literature.
According to eight articles, energy drink included stimulants and additives in most gyms and grocery which will be suitable some group. But they should get any advising from a physician because it has many ingredients such as Caffeine, Taurine, Glucuronductone, B-vitamins, Guarana, Ginseng, Sugar, L-carnitine, Ginkgo biloba, as well as antioxidants. Thus, it makes customers have a negative attitude, they can change attitude by having belief and awareness as well. Moreover, integrated marketing communication, and also gift promotion will be factors to support the theory of attitude change that has effect to perception to customers which probably can influence to change attitude of customers toward energy drink. From the result of literature review, the customers have the positive attitude toward energy drink. Hence, we will try to accumulate these articles to have in finding part, then it has to support our analysis having result to be the same direction.
3.3 Research Method
3.3.1 Primary Data.The population samples for this research are teenager age between 18-25 years old (CHLA, 2010). We decided to collect the samples around 550 people and the expect respondent are not less than 400. We decided to use Yamane’s formula to calculate sampling size as follows; (Israel, 2009)
Source: srael (2009). Using Formulas To Calculate A Sample Size. Retrieved April 15, 2011, from http://edis.ifas.ufl.edu/pd006
22 Where n = the sample size, N = total population, and e = the level of precision so the total population of young adult in Bangkok Thailand is 608,000 (dopa, 2011). Due to the cost and time constraints, the confidence interval will be set at ±0.05 as although smaller confidence intervals will provide more confidence in result. Filling in all the variables in the sample size formula, the equation will become:
Sample Size = 608,700 / (1 + (608,700 * 0.052))
= 608,700/ (1+ (608,700*0.0025)
= 608,700/ (1+1,521.75)
= 608,700/1,522.75 Ans = 399.74
Therefore, the total sample size of young adult in Bangkok Thailand for collecting questionnaire will be 399.74 ≈ 400. To ensure that the respondents interviewed will belong to the population of interest, as with the pilot test, respondents will first be asked do they have ever drunk energy drink before. If the answer is “YES”, they will be asked to complete the questionnaire. By the way, if the answer is “NO” the respondent will be asked no more questions.
Moreover, the primary data we choose qualitative and quantitative method in our research by launch questionnaire at Universities in Thailand such as Assumption University and Bangkok University. Quantitative research methods were originally developed in the natural sciences to study natural phenomena (Hohmann, 2005). Qualitative is the qualitative researcher seeks to discover the meanings that participants attach to their behavior, how they interpret situations, and what their perspectives are on particular issues (Woods, 2006).
The questionnaire will contained close-ended questions for the general information and opened-ended questions for in-depth information such as their opinion about energy drink. The sampling area is Bangkok, Thailand because Bangkok is the capital city of Thailand and has a lot of Universities located in.
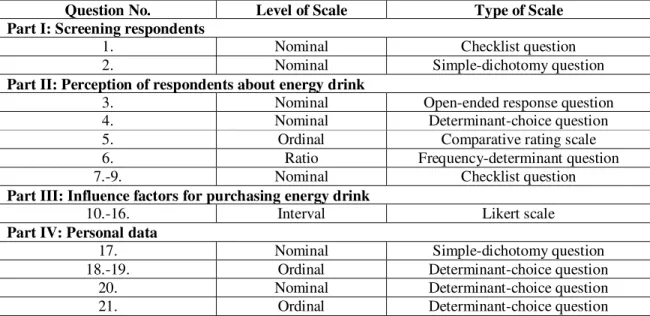
23 3.3.2 Level of Scale and type of scale
The level of scale can divide into four categories which are nominal, ordinal, interval, and ratio. The meaning of each category is;
- Nominal: scale in nominal can measure by something in common but cannot described. It can contain the number like in ordinal but can only use for categorize such as employees.
- Ordinal: the items in ordinal scale can rank by order and defined by assigning numbers to them to show their relative position. It can show only the sequence and cannot do arithmetic with ordinal numbers.
- Interval: this data can measure by use a scale in which each position is equidistant from one another. It also has the limitation that are cannot be multiplied or divided. - Ratio: this scale can be compare as multiples of one another and the number zero has meaning. The number in ratio scale can multiply and divided (Change Minds, 2002-2011a).
In this research, we use seven type of scale according to each question in questionnaire. The definition for each of them can describe as follow;
- Checklist question: the respondents can checking off items on provided multiple answers in one question and each question is fixed-alternative question.
- Simple-dichotomy question: the respondents can choose one of two alternatives in fixed-alternative question.
- Open-ended response question: the question will contain some problem and asks the respondents to answer in their own words.
-Determinant-choice question: the question will contain multiple alternatives that allow the respondents choose only one answer.
- Frequency-determinant question: the general frequency of occurrence will appear in this type of scale (Textbook Exchange Canada, 2004-2008).
- Comparative rating scale: this question will allow the respondents to make their own rating as a series of relative judgments or comparisons with a benchmark (Design and Marketing Dictionary, 2009).
- Likert scale: the respondents will choose one option that best aligns with their view. The scale is an ordered and one-dimensional scale such as 1-5 which is strongly disagree to strongly agree (Changing Minds, 2002-2011b).
24 In questionnaire, we used many level of scales and also many type of scale. Each question will consist of different type and level so we decide to generate them into the table below:
Question No. Level of Scale Type of Scale
Part I: Screening respondents
1. Nominal Checklist question
2. Nominal Simple-dichotomy question
Part II: Perception of respondents about energy drink
3. Nominal Open-ended response question
4. Nominal Determinant-choice question
5. Ordinal Comparative rating scale
6. Ratio Frequency-determinant question
7.-9. Nominal Checklist question
Part III: Influence factors for purchasing energy drink
10.-16. Interval Likert scale
Part IV: Personal data
17. Nominal Simple-dichotomy question
18.-19. Ordinal Determinant-choice question
20. Nominal Determinant-choice question
21. Ordinal Determinant-choice question
Table 3.2 Level and Type of Scale
Source: Own Illustration
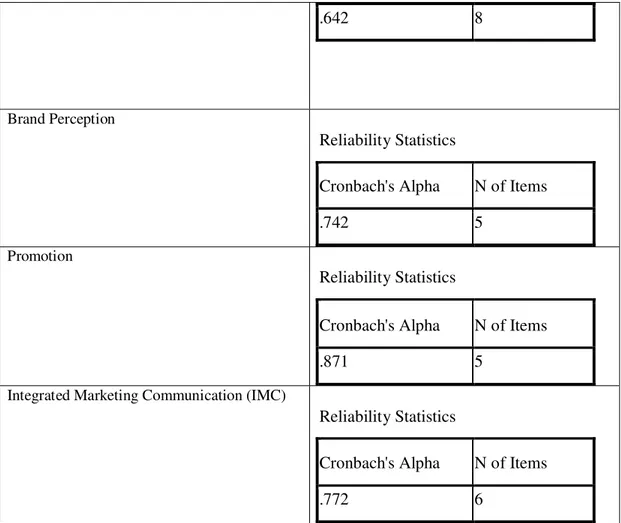
3.3.3 Reliability Test
According to Hinton et al. (2004) described that “The reliability is the ability of the questionnaire to consistently measure the topic under study at different times and across different populations”. For the reliability test, we decided to use this test for four main topics that are brand positioning, brand perception, promotion, and integrated marketing communication (IMC) in our questionnaire. Therefore, the Cronbach’s Alpha range will depend to a certain extent on the number of items in the test and the number of participants, so this research will use 0.6 Cronbach’s Alpha and above for the reliability of the questionnaire (Hinton et al., 2004). Then, if the Cronbach’s Alpha is more than 0.6 till 1.00 means the questionnaire has more reliability. The table below shows the Cronbach’s Alpha of each topic;
Topics Cronbach’s Alpha
Brand Positioning
Reliability Statistics
25
.642 8
Brand Perception
Reliability Statistics
Cronbach's Alpha N of Items
.742 5
Promotion
Reliability Statistics
Cronbach's Alpha N of Items
.871 5
Integrated Marketing Communication (IMC)
Reliability Statistics
Cronbach's Alpha N of Items
.772 6
Table 3.3: Cronbach’s Alpha of each topic
Source: Own Illustration
The table above shows that every factors in the questionnaire is reliable because all data from Cronbach’s Alpha are more than 0.6.
3.3.4 Validity of research
The effective research must contain the validity both in qualitative and quantitative research. Therefore, the validity in qualitative research depends on the honesty, depth, richness, and scope of the data achieved along with the participants approached, the extent of triangulation and the disinterestedness or objectivity of the researcher. Moreover, the validity in quantitative research can be improved through careful sampling, appropriate instrumentation and appropriate statistical treatments of the data (Cohen, Manion and Morrison, 2000). This research uses questionnaire survey for collecting the data from the respondents because it is the appropriate method to gain in-depth data from the respondents such as their comment and attitude. Besides, the questions in questionnaire are from the factors of literature and
26 theories in the books and key influences are from the authors’ perspective which related to the factors. The SPSS program also uses in this research for analyze the data from respondents because we would like to gain more details of the data.
3.3.5 Interpret of mean value.
The mean values that shown in the empirical findings part are the indicators for measure the total number of respondents who preferred each choice in the questionnaire. The more of mean value means the more of respondents who choose each choice and the less of mean value means the opposite way. In addition, the mean value will equal to 1.00 and the nearest mean score is the most option that respondents choose.
3.3.6 Secondary Data.
In part of secondary data, we choose eight articles to support with our research because it makes our report has more reliable to analyze data.
Therewith, this research will relate to the theories that applicable to the topic such as consumer behavior, perception, as well as attitude from the theories above. Besides, the data information in this research will be use as an implementation along with statistical program (SPSS) for analyze and reach a conclusion.
Effective factors to change Thai young adult’s attitude.
A list of key variables influences Thai young adult to change their attitude toward energy drinks in the positive way. Moreover, all of them are from the literature reviews and theories above. These factors will be test in the questionnaire to identify which are the effective factors that can increase and change Thai young adult mind.
Factors Key Influences
Brand Perception Adding more flavors
Adding more ingredients e.g. Glucose Packaging Design
Adding more aroma
Promotion Buy 1 get 1 free
Sweepstakes Bundling Product Product Samples Premium IMC (Integrated Marketing Communication) Sport Channel
Product Placement Sponsorship Billboard/Poster Radio
27
Brand Position Trademark
Market share Brand Image Pricing
Distribution Channel
Table 3.4: Factor and Key Influences
Source: Own Illustration
According to the table 3.4 above the list of key influences are from the authors’ perspective and also link to the factors that came from literature and theories such as the key influences of brand perception that can stimulate the customer to buy product by use some of them. The key influences also came from the example of each theory such as promotion that has buy 1 get 1 free, sweepstake, bundling product, product samples, and premium.
28
4. Empirical Finding
4.1 Primary Finding
The primary finding is the result from the questionnaire survey. In this part we will describe the data according to the structure of questionnaire that has four parts which are Part1: Screening respondents, Part2: Perception of respondents about energy drink, Part3: Influence factors for purchasing energy drink, and Part4: Personal data. Therefore, we already collected 400 completed questionnaires from Universities in Bangkok, Thailand for processing the data below.
Part1: Screening respondents.
The first kind of drinks that the respondents chose when they thirsty is Water/Mineral Water because 291 out of 400 respondents chose this option and the valid percent is 72.8. Therefore, follow by 147 respondents (36.8%) chose fruit juice and 77 respondents (19.2%) chose coffee/tea. Then, 55 respondents (13.8%) chose energy drink, 49 respondents (12.2%) chose milk, and 34 respondents (8.5%) chose other.
Figure 4.1: Kind of Drinks
Source: Own Illustration
According to table 4.1 shows that 225 respondents out of 400 ever drink energy drink and the valid percent is 56.2. Moreover, this number also means that more than half of respondents have the experience with this product.
72.8% 36.8% 19.2% 13.8% 12.2% 8.5%
Kind of drinks
Water/Mineral Water Fruit juice Coffee/Tea Energy drink Milk Other 8.5%29 Have you ever drink energy drink?
Frequency Percent Valid Percent Cumulative Percent Valid Yes 225 56.2 56.2 56.2 No 175 43.8 43.8 100.0 Total 400 100.0 100.0
Table 4.1: Have you ever drink energy drink?
Source: Own Illustration
Part 2: Perception of respondents about energy drink
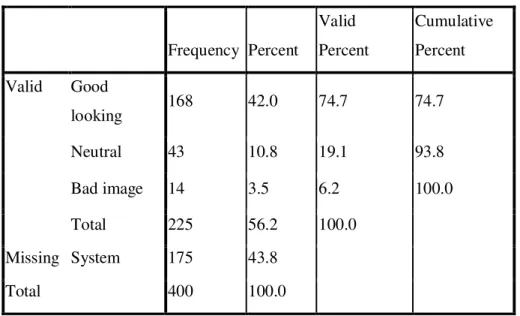
According to table 4.2, the opinion from respondents who ever drink energy drink can divided into three parts which are 168 respondents (74.7%) preferred good looking, 43 respondents (19.1%) preferred neutral, and 14 respondents (6.2%) preferred bad image. Otherwise, the missing respondents who did not have experience with this product are 175 respondents (43.8%) that did not answer this question.
What is your opinion about energy drink?
Frequency Percent Valid Percent Cumulative Percent Valid Good looking 168 42.0 74.7 74.7 Neutral 43 10.8 19.1 93.8 Bad image 14 3.5 6.2 100.0 Total 225 56.2 100.0 Missing System 175 43.8 Total 400 100.0
Table 4.2: What is your opinion about energy drink?
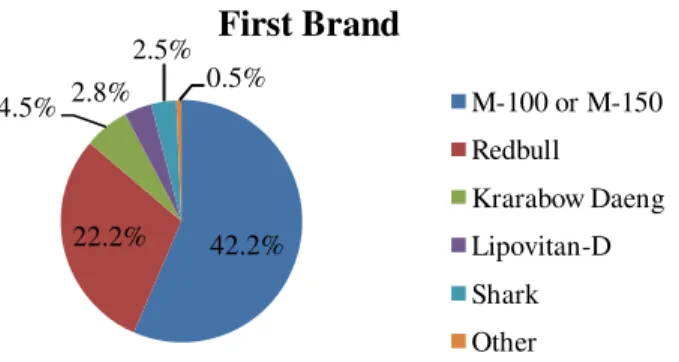
30 According to figure 4.2, the first brand of energy drink that most respondents thought is M-100 or M-150 because 95 respondents (42.2%) out of 225 chose this option. The following brand is Redbull with 89 respondents (22.2%), Krarabow Daeng with 18 respondents (4.5%), Lipovitan-D with 11 respondents (2.8%), Shark with 10 respondents (2.5%), and Other with 2 respondents (0.5%) respectively.
Figure 4.2: First Brand of Energy Drink
Source: Own Illustration
According to figure 4.3, the most favorite brand that respondents who ever drink energy drink chose is M-100 or M-150 according to 86 respondents out of 225 and the valid percent is 38.2. The second brand is Redbull which is 74 respondents (18.5%) chose this brand. Third brand is Lipovitan-D which is 30 respondents (7.5%) chose this brand. Fourth brand is Shark which is 22 respondents (5.5%) chose this brand and last brand is Krarabow Daeng which is 12 respondents (3%) chose this brand.
Figure 4.3: Most Favorite Brand of Respondents Source: Own Illustration
42.2% 22.2% 4.5% 2.8% 2.5% 0.5%
First Brand
M-100 or M-150 Redbull Krarabow Daeng Lipovitan-D Shark Other 38.2% 18.5% 7.5% 5.5% 3%Most Favorite Brand
M-100 or M-150 Redbull
Lipovitan-D Shark
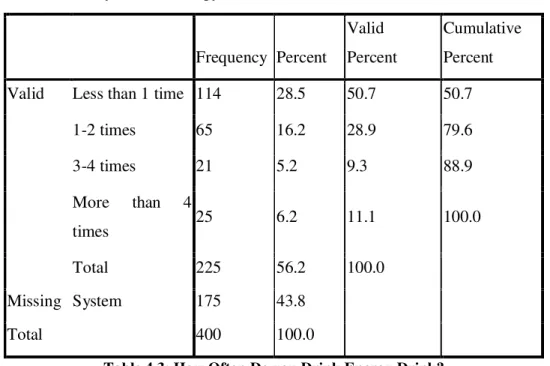
31 According to table 4.3, the most respondents consumed energy drink less than 1 time in a month, the frequency is 114 respondents and the valid percent is 50.7. The least frequency that respondents consumed energy drink is 3-4 times which is 21 respondents (5.2%) chose this choice.
How often do you drink energy drink?
Frequency Percent
Valid Percent
Cumulative Percent Valid Less than 1 time 114 28.5 50.7 50.7
1-2 times 65 16.2 28.9 79.6 3-4 times 21 5.2 9.3 88.9 More than 4 times 25 6.2 11.1 100.0 Total 225 56.2 100.0 Missing System 175 43.8 Total 400 100.0
Table 4.3: How Often Do you Drink Energy Drink?
Source: Own Illustration
According to table 4.4, the most way that respondents purchased energy drink is convenient store because the mean value is 0.72 more than others. The second way that respondents purchased energy drink is supermarket with mean value equal to 0.42. Therefore, the third way is grocery store which is 0.35 mean values. The fourth and fifth way is vending machine and other which is 0.05 and 0.01 mean value respectively.
Descriptive Statistics
N Minimum Maximum Mean
Supermarket 225 0 1 .42
Grocery Store 225 0 1 .35
Convenient
32 Vending Machine 225 0 1 .05 Other 225 0 1 .01 Valid N (listwise) 225
Table 4.4: Mean Value for The Way to Purchase Energy Drink
Source: Own Illustration
According to table 4.5, the most reason that respondents purchase energy drink rather than other kind of drinking is awake because the mean value is 0.67 more than others. The second reason is being exhausted which mean value is 0.47. The third reason is refresh which mean value is 0.28. Mixed with liquors is the fourth reason which is 0.16 mean values. The last reason is thirsty and other which mean value is 0.08 and 0.04 respectively.
Descriptive Statistics
N Minimum Maximum Mean
Awake 225 0 1 .67 Being Exhausted 225 0 1 .47 Thirsty 225 0 1 .08 Mixed with liquors 225 0 1 .16 Refresh 225 0 1 .28 Other 225 0 1 .04 Valid N (listwise) 225
Table 4.5: Mean Value of Reasons for Purchasing Energy Drink
Source: Own Illustration
According to table 4.6, the most advertisement that influenced respondents to recognize is TV advertisement because the mean value is 0.87 and the second is sponsorship that got 0.24. The following advertisement that influence respondents are radio and magazine/newspapers
33 which the mean values is 0.19 and 0.16 respectively. The last two advertisement are website (0.09) and other (0.03) for influence the respondents.
Descriptive Statistics
N Minimum Maximum Mean
TV 225 0 1 .87 Radio 225 0 1 .19 Magazine/Newspaper s 225 0 1 .16 Website 225 0 1 .09 Sponsorship 225 0 1 .24 Other 225 0 1 .03 Valid N (listwise) 225
Table 4.6: Mean Value of Influence Advertisement
Source: Own Illustration
Part 3: Influence factors for purchasing energy drink Mean and Standard Deviation
The following table 4.7 will analyze the data by use the mean and standard deviation and ranking from most important or strongly agree to least important or strongly disagree which equal to five ranks. Therefore, the number of mean would start from 1 to 5, and then this part will have four ranges each range will equal to 0.8 because we divided five numbers with four ranges. Hence, the analysis will base on the figure below:
Weight Mean Score Interpretation Interpretation
4.21-5.00 Most important Strongly agree
3.41-4.20 Important Agree
2.61-3.40 Neutral Neutral
1.81-2.60 Unimportant Disagree
1.00-1.80 Least Important Strongly disagree
Table 4.7: The Interpretations of Weight Mean Score
34 According to table 4.8, the respondents chose six factors that importance for them when they drink energy drink which is taste (3.88), quality of product (4.02), reasonable price (3.72), available (3.59), advertising (3.58), and famous of brand (3.76). The neutral factors for respondents are variety of product (3.09) and promotion (3.14).
Important factors Mean value Interpretation
Variety of product 3.09 Neutral
Taste 3.88 Important
Quality of product 4.02 Important
Reasonable price 3.72 Important
Available 3.59 Important
Promotion 3.14 Neutral
Advertising 3.58 Important
Famous of brand 3.76 Important
Table 4.8: Mean Value and Interpretation of Important Factors
Source: Own Illustration
According to the table 4.9 below, shows that taste (4.41) and quality of product (4.23) are the main expect from respondents because they strongly agree with the reasons. Moreover, reasonable price (3.96), available (3.73), advertising (3.63), and famous of brand (3.81) got agree rank from the respondents. Therefore, variety of product (3.37) and promotion (3.36) are the last expect from the respondents which are neutral.
Respondents expect Mean value Interpretation
Variety of product 3.37 Neutral
Taste 4.41 Strongly agree
Quality of product 4.23 Strongly agree
Reasonable price 3.96 Agree
Available 3.73 Agree
Promotion 3.36 Neutral
Advertising 3.63 Agree
Famous of brand 3.81 Agree
Table 4.9: Mean Value and Interpretation of Respondents Expect from Energy Drink
Source: Own Illustration
The following table 4.10, the respondents who perceive Redbull concern and agree about variety of product (3.50), taste (3.66), quality of product (3.82), reasonable price (3.63), available (3.86), advertising (3.71), and famous of brand (4.02). A promotion (3.29) is the last thing that respondents concern about when perceive Redbull which is neutral.