School of Innovation, Design and Engineering
Mälardalen International Master Academy (MIMA
)Master Program in Product and Process Development – Production and
Logistics Management
KPP231- Master Thesis Work, Innovative Production (Advanced
Level 30 hp)
Advisor: Sariya Sripipat Supervisor: Sabah Audo
A Feasibility Study of Setting-Up New Production
Line – Either Partly Outsource a Process or Fully
Produce In-House.
Authors:
Piansiri Cheepweasarash (740621-P180)
Abstract
This paper presents the feasibility study of setting up the new potting tray production line based on the two alternatives: partly outsource a process in the production line or wholly make all processes in-house. Both the qualitative and quantitative approaches have been exploited to analyze and compare between the make or buy decision. Also the nature of business, particularly SMEs, in Thailand has been presented, in which it has certain characteristics that influence the business doing and decision, especially to the supply chain management. The literature relating to the forecasting techniques, outsourcing decision framework, inventory management, and investment analysis have been reviewed and applied with the empirical findings. As this production line has not yet been in place, monthly sales volumes are forecasted within the five years time frame. Based on the forecasted sales volume, simulations are implemented to distribute the probability and project a certain demand required for each month. The projected demand is used as a baseline to determine required safety stock of materials, inventory cost, time between production runs and resources utilization for each option. Finally, in the quantitative analysis, the five years forecasted sales volume is used as a framework and several decision making-techniques such as break-even analysis, cash flow and decision trees are employed to come up with the results in financial aspects
Keywords:
Outsourcing, decision making, inventory cost, SMEs, resourceAcknowledgement
We would like to take this opportunity to thank many people who being so supportive and very much encouraging us in making this thesis possible.
To our supervisor, Sabah Audo, who always gives us the prompt advices and responses on our questions as well as the guidance on the project’s direction.
To K.T Plastics Agriculture Limited., Partnership, for giving us the opportunity to work on this project ,and thus allowing us to apply the literature knowledge to the real situations and practices.
A special thanks is given to Ms Sariya Sripipat, who dedicated her precious time in coordinating and kindly provided all the necessary information, which ease us in doing this project from different location feasible.
To our brothers, sisters, friends, and especially our parents, who always besides us, give valuable advise, and help us get through the difficult times, thanks for all the emotional support and caring.
Table of Contents
ABSTRACT ... I ACKNOWLEDGEMENT ...II TABLE OF CONTENTS ... III
CHAPTER 1: INTRODUCTION ...1 1.1BACKGROUND...1 1.2PROBLEM IDENTIFICATION...2 1.3PURPOSE OF STUDY...2 1.4PRODUCT DESCRIPTION...2 1.5PRODUCTION PROCESS...3
1.5.1 Process Mapping: Potting Trays ...4
1.6PROJECT DIRECTIVES...5
1.7PROJECT LIMITATIONS...5
CHAPTER 2: THEORETICAL BACKGROUND ...6
2.1FORECASTING TECHNIQUES...6
2.1.1 Qualitative Methods...6
2.1.2 Quantitative Methods...6
• Historical Projection or Time Series Methods ...6
• Causal Methods...7
2.2OUTSOURCING...8
2.2.1 Definition of Outsourcing ...8
2.2.2 The reason for outsourcing decision...9
2.2.3 Disadvantage of outsourcing ...12
2.2.4 Methods to avoid the problem of outsourcing...14
2.2.5 Outsourcing decision framework ...14
• A composite outsourcing decision ...14
• A conceptual Framework for evaluating the make or buy decision ...16
2.3INVENTORY...20
2.3.1 Role of Inventory...20
2.3.2 Type of Inventory ...21
2.3.3 Inventory Cost...23
• Non-instantaneous Replenishment ...25
2.3.4 Inventory Control System...26
• Independent Demand...27
• Dependent Demand ...28
2.4FEASIBILITY STUDY AND INVESTMENT ANALYSIS...30
2.4.1 Feasibility Study...30
2.4.2 Investment Analysis...30
• Cash on cash return ...30
• Payback Period ...31
• Internal Rate of Return...31
• Net Present Value...31
CHAPTER 3: EMPIRICAL STUDY...32
3.1SALES FORECAST...32
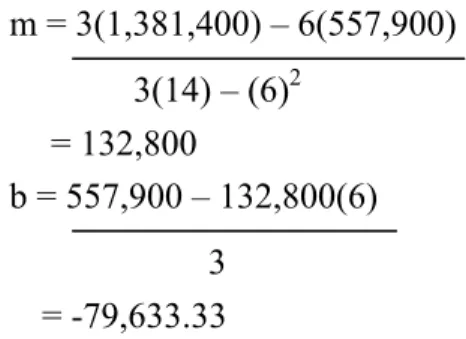
3.1.1 Annual Sales Forecast: Linear Regression...33
3.1.2 Monthly Sales Forecast: Seasonal Patterns...34
3.1.3 Forecast Accuracy ...38
3.2AN OVERVIEW OF BUSINESS IN THAILAND:SMALL AND MEDIUM ENTERPRISE (SMES)...40
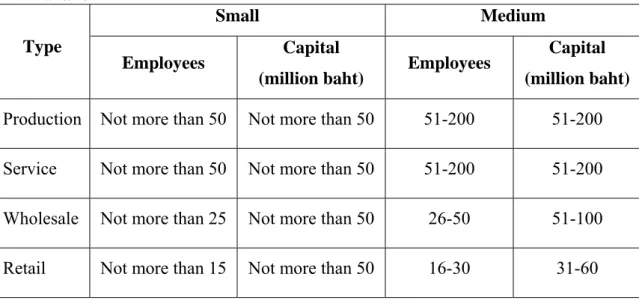
3.2.1 SMEs Definition by Thai Government ...40
3.3.1 Stage one: Define the core activities of the business ...46
3.3.2 Stage two: Profile the appropriate value chain links...49
3.3.3 Stage three: Total cost analysis of core activities ...51
3.3.4 Stage four: Analysis of potential suppliers for partnership ...52
3.4INVENTORY APPLICATION...53
3.4.1 Sales Forecast and Demand Simulation ...53
3.4.2 Inventory Cost...59
• Inventory Carrying cost...59
• Setting-Up Cost ...60
3.4.3 Ordering Quantity (Lot-Sizing)...61
3.4.4 Time between Production Runs (TBP) and Resources Utilization...68
CHAPTER 4: ANALYSIS AND RESULT...73
4.1QUANTITATIVE ANALYSIS:DECISION-MAKING TECHNIQUES...73
4.1.1 Break-Even Analysis: Make or Buy ...73
4.1.2 Cash Flow Analysis...76
4.1.3 Decision Tree Analysis...79
4.2AGGREGATE ANALYSIS AND RESULT...84
CHAPTER 5: CONCLUSIONS AND RECOMMENDATIONS ...85
REFERENCES ...87
Chapter 1: Introduction
1.1 Background
Established since May 2000, KT Plastic Agriculture Limited Partnership is a family own business located in Bangkok, Thailand. With the registered capital of THB 5 million, the company has an approximated turnover of THB 36 million in 2007. KT Plastic Agriculture Ltd. Part. is a manufacturer and a distributor of plastic products using in agricultural field.
Since the aim of the company is to be a one-stop supply point for customers in agricultural industry, it strives to broaden product lines at less cost. Currently, the company have owned manufacturing on the products that fit their core competency, outsources the production of some products to other plastic manufacturers in related industry who can do it in a cost effective way, and become the distributor of some other products such as shade net, mesh netting, nylon net and peat moss that require a huge production scale in which the company has insufficient capability to produce them at this moment. Currently, there is one type of machine, extruder blowing machine, used in the company to produce various products, for example plastic mulching film, plastic bags for agricultural purpose, garbage bags, plastics for green house, etc. For products like plastic potting trays that need to be produced by vacuum forming machine, they are currently outsourced.
The company’s main production line is mulching film. During these years, potting tray is another product which sells along side with mulching film but the company previously does not produce potting trays in-house, due to the lack of technical skills and knowledge in production. The company was previously a trader and later becomes a manufacturer. Thus, in the beginning, the company chose mulching film as their core product and invested on this production line while outsourced potting tray. Manufacturing potting-tray in-house has been in consideration for the company since the company started expanding to manufacturing business. Yet, at that time, with the limited knowledge in technology, technical skills and expertise in manufacturing market, the company has not yet decided to perform the production of the potting tray in-house. Also, at the previous location, the company had lack of space for establishing potting tray production line, but this problem had been eliminated since the company moved to the new factory location on 2006. Another reason that holds the company back from proceeding the in-sourcing of this product line is because the company can still sell potting tray with profit through outsourcing. However, during these years, because the sales of potting tray has increased and a certain market shares are owned by the company, the sales volume of potting trays proves to be relatively high compared to other product lines except mulching films which is still considered as a core product for the company. Thus, the company would like to investigate the feasibility of having their own production for potting trays.
Moreover, recently, the company faces problems from outsourcing of potting tray due to the supplies’ quality, and the threat from suppliers that they become the company’s competitors. The problem has arisen when the company hires other manufacturers to
produce, not only the company has to pay for the creation of new mold but also the suppliers would have the mold for that product. Though these plastic manufacturers whom the company outsource is closed to the company’s business market, yet they in different industry, they can produce the products using the company’s mold and supply it to other customers, becoming the company’s direct competitors. This issue triggers the company to reconsider soberly in acquiring back the production of potting trays in-house.
1.2 Problem Identification
Current situation of outsourcing the whole potting tray production line gives some threats to KT Plastics rather than opportunities. Deciding to backsource the whole production line, with limited resources, the company needs to thoroughly identify the core process of this production line and make sure to keep this process to be performed in-house. However, for the other non-core processes, the company also needs to evaluate the option of outsourcing and in-house making to see which one would offer the best opportunity. The two options the company is considering are as followed:
• Option 1: Company would invest in the thermoforming machine while buying plastic sheets from supplier (partly outsource).
• Option 2: Company would manufacture everything in-house by investing in the sheet extrusion machine and thermoforming machine.
1.3 Purpose of Study
The aim of this study is to help KT Plastics to achieve an effective decision making with regard to the setting up of new potting tray production line, providing both qualitative and quantitative aspects to consider. Since the company decides to invest in this vacuum forming machine (core process), they want to make the most out of their investment. Therefore, the company wants us to perform the feasibility study of establishing the new production line of potting tray, evaluating whether manufacturing all production processes in-house or partly outsourcing a process would be more efficient and yield a better profit.
1.4 Product Description
The plastic potting tray is made by the plastic type PS (polystyrene). The potting tray is used in the agriculture field to grow seeds before planting into the land field. With the dimension of 55cm x 36cm x 70 micron and weight 160 gram, a tray can have different number of holes, yet the potting tray with 72 holes and 104 holes is widely used and highly demanded in the market.
1.5 Production Process
The production line of potting tray consists of two sub-production processes, in which each process will be contained in a production cell that can be separated from each other. There are two main machines used in the potting tray production line; one is the sheet extrusion machine and the other is thermoforming machine.
Sheet extrusion machine
1.5.1 Process Mapping: Potting Trays Packing Trimming & Punching Machine Sheet Extrusion Machine Stock some in inventory Thermoforming Machine Mixing Machine Plastic PS Black Color
As illustrated in the process mapping, the production of potting tray starts with mixing Polystyrene (PS) plastic with mater batches: black color in the mixing machine. This process will take approximately 15 minutes. When the mixture is ready, mixed plastics will be taken out and put into sheet extrusion machine. Then, the extrusion machine will process plastics into a roll of plastic sheet. In this step, it can process 140kg of plastics per an hour, depending on the capacity of machine. After that, a roll of plastic sheet will be taken to a station of thermoforming machine and some of the plastic sheet rolls will be kept in the inventory, waiting to be processed further in the thermoforming machine. At the thermoforming station, a staff will feed plastic sheet into thermoforming machine, processing to be potting tray with the cycle time of approximately 75 seconds per two trays. Then, this potting tray will pass through the process of edges trimming and holes punching, finally, to the packing process with 100 trays per box and ready to be delivered.
Among the production processes of this product line, thermoforming machine is considered as the company’s core competency since forming plastic sheet into shape requires molds. The variation of the product in this production line depends on molds, for example 104 holes potting tray and 72 holes potting tray requires different set of molds whereas these products use the same type of plastic sheet to feed into thermoforming machine.
1.6 Project Directives
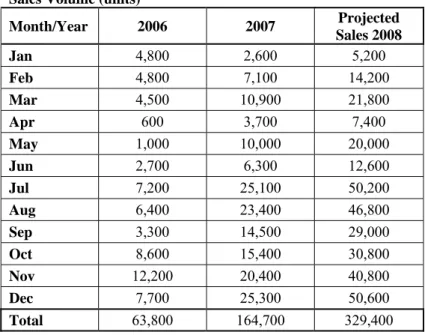
As KT Plastics has to decide between the two options of partly outsource or wholly-produce in-house the potting tray production line, the company has given certain conditions and requirements to use as a scope for this study. Expecting to have a return on investment within five years and the total production cost of product should not exceed the current price of buying from supplier or at least the company should be able to sell to its customers at the same selling price and is still profitable, thus, this study of feasibility is set the timeframe to be within five years. Given a few years historical sales data, five years sales forecast of potting tray is developed to use as framework to compare and evaluate between the two options.
1.7 Project Limitations
Our study present the solution based on the maximum production time available, three working shifts, and the optimism of market trend. Since the production line has not yet been in place, there might be unforeseen circumstances emerging such as unplanned stop-time, machine break-down, market fluctuation, changes in government policy, level of competition, etc., when the actual production line has been setup, thus deviate the result from what has been analyzed and presented. Due to different time zone and location between the company and the authors, there is a difficulty in gathering some data and information from both the suppliers and the company.
Chapter 2: Theoretical Background
2.1 Forecasting Techniques
Forecasting demand levels is essential to the firm as a whole as it provides the basic inputs for the planning and controlling the use of limited resources in all functional areas (Ballou, 2004). The objective of forecasting is to develop a useful forecast by applying information at hand with the forecasting technique that best fit the different pattern of demand, such as spatial/ temporal demand, lumpy/ regular demand, and derived/ independent demand. Forecasting methods are categorized into two types: qualitative and quantitative methods.
2.1.1 Qualitative Methods
Qualitative or judgment methods are those that use intuition e.g. management or expert opinions, surveys, or comparative techniques to produce quantitative estimates about the future. The available information relating to the forecasting factors are nonquantitative and subjective (Ballou, 2004). Judgment method is useful when there is inadequate historical data. Due to the nature of the nonscientific methods, it makes them difficult to standardize and validate for accuracy. However, in some cases like predicting the success of new products, government policy changes, or the impact of new technology, judgment methods are the only practical way to make a forecast. It can be used to modify the forecast that generated by quantitative methods to anticipate the special events so as to reflect and give a more reliable forecasts and to adjust the historical data that will be analyzed with the quantitative method in order to minimize the impact of special events that occurred in the past. Qualitative or judgment methods are likely to be the choice for all time horizons of forecasting: short term, medium term and long term.
2.1.2 Quantitative Methods
Quantitative methods include historical projection methods or time series models and causal methods. They rely heavily on historical information to predict or project the future demand.
• Historical Projection or Time Series Methods
When an adequate amount of historical data is available and the trend and seasonal patterns in the time series are stable and well defined, projecting these data into the future can be an effective way of forecasting for the short-term.
Identifying the underlying patterns of demand that combine, time series analysis produces an observed historical pattern and then develops a model to replicate the past pattern (Krajewski, Ritzmand, Malhotra, 2007). The quantitative nature of the time series encourages the use of mathematical or statistical approach as the primary forecasting tools. Different time series method such as naïve forecast, simple moving averages, weighted moving averages, exponential smoothing, trend, and seasonal forecast are used to address various patterns of demand. The time series models are reactive in nature. They track change by being updated as new data become available, a feature that allows them to adapt to changes in trend and seasonal pattern. Yet, if the change is rapid, the models do not signal the change until after it has occurred (Ballou, 2004). Nevertheless, this limitation is not serious when forecasts are made over short time horizons unless changes are particularly dramatic.
• Causal Methods
Causal methods are used when historical data are available. The fundamental ground on which causal methods are built is that when the relationship between the factor to be forecasted (e.g. sales volume) and other external or internal factors (e.g. government actions or advertising campaign) can be identified as the cause-and-effect relationship. These relationships are expressed in a variety of forms (statistical, e.g. regression and econometric models; and descriptive, e.g. input-output, life cycle, and computer simulation models) and can be complex. Each model is derived its validity from the historical patterns that establish the association between the predicting variables and the variable to be forecasted (Ballou, 2004). Causal methods provide the most sophisticated forecasting tools and are good for predicting turning points in demand and for preparing long-term forecasts (Krajewski, Ritzmand, Malhotra, 2007).
2.2 Outsourcing
The management of an outsourced process is fundamental for the future growth of a firm (Fine and Whitney, 1996; Ruffo, Tuck and Hague, 2007). Outsourcing is the act of transferring the work to an external party. Whether or not to outsource is the decision of whether to make or to buy. Organizations continuously face with the decision of whether to expand with existing to create an asset, resource, product or service internally or to buy it from an external party (Power, Desouza and Bonifazi, 2006). Making the wrong decision for outsourcing can result in cost overruns, project delays, or solution that does not fit business needs.
2.2.1 Definition of Outsourcing
Fill and Visser stated that Hiemstra and van Tilburg (1993) define outsourcing as: subcontracting the custom-made articles and constructions, such as components, sub-assemblies, final products, adaptations and/or services, to another company.
According to Bendor-Samual (1998), outsourcing provides certain leverage that is not available to a company’s internal departments. This leverage may have many dimensions: economies of scale, process expertise, access to capital, access to expensive technology, etc. The combination of these dimensions creates the cost savings inherent in outsourcing.
Mylott (1995) views outsourcing in terms of full outsourcing, selective outsourcing, and everything-in-between outsourcing. Full outsourcing refers to the vendors who are in charge for all activities while, in selective outsourcing, the vendor provides services for one or a few activities such as payroll. Everything-in-between outsourcing is exactly to the meaning of its name.
Mornme (2001) indicates different sourcing strategies: make or buy, outsourcing, in-sourcing, and strategic sourcing.
Doing everything in-house might be manageable, but it is not always efficient. Outsourcing is an effective tool, and when exploits reasonably it can become a key factor for change, irrespective of whether the change is radical or incremental (Rebernik and Bradac, 2006). Outsourcing implies a business relationship between two parties: the outsourcing subject (also called the principal or the client) who makes the decision of whether to outsource or not; and an external outsourcing firm (also called the supplier or subcontractor) (Arnold, 2000). Outsourcing occurs when a company uses an outside firm to provide a necessary business function that might otherwise be done in-house. It is a strategic management tool for transferring part of the business process to another company; its aim is predominantly to make a company more competitive by enabling it to stay focused on core competencies (Rebernik and
Bradac, 2006). Gillley and Rasheed (2000) also point out that outsourcing occurs in two situations. First is when the client outsources activities that were originally sourced internally, resulting from a vertical disintegration decisions. Secondly, when the client sources activities that are within the client’s capabilities, and hence could have been sourced internally, although they have not been completed in-house in the past
The major distinction between outsourcing and subcontracting are when the outsourced activities are specific to the client. The outsourced activities must perform according to a plan, specification, form or design, varying detail, provided by the client (Webster et al., 1997). Hence, a firm buying an off-the-shelf, standardized component or a supplier’s proprietary part is not considered as outsourcing as no customization is performed for the buyer (Sousa and Voss, 2007).
2.2.2 The reason for outsourcing decision
Traditionally, buying by organizations had been done largely on the basis of obtaining the best price, exceptionally taking into account a few other factors such as quality and delivery (Mclvor and Humphreys, 2000). In general, there exist three main clusters of reasons driving the outsourcing decision – reducing cost, improving operational performance and developing competencies (Rebernik and Bradac, 2006). Beulen (1994) defined five drivers of outsourcing which are quality, cost, finance, core-business and cooperation (Fill and Visser, 2000). As well as, Winkleman et al. (1993) stated that there are two basic drivers behind the growth of outsourcing, cost reduction and a strategic shift in the way that organizations are managing their business. However, in many cases, the significant numbers of factors such as delivery reliability, technical capability, cost capability and the financial stability of suppliers were not taken into consideration (Dooley, 1995). Few organizations have taken a strategic view of make or buy decisions while many companies decide to buy rather than make for short-term reasons of cost reduction and capacity (Ford et al., 1993; Humphreys et al., 2000).
Table 1: Drivers for outsourcing
by Beulen et al., 1994
Quality
Actual capacity is temporarily insufficient to comply with demand. The quality motive can be subdivided into three aspects: increase quality demands, shortage of qualified personnel, and outsourcing as a transition period.
Cost
Outsourcing is a possible solution to control increasing costs and to combine it with a cost leadership strategy. By controlling and decreasing costs, a company can increase its competitive position.
Finance
A company has a limited investment budget. The funds must be used for investment in core business activities, which are long-term decisions.
Core-business
Core-business is a primary activity with which an organization generates revenues. A company should pay a strategic attention to the core-business activities, while all subsequent activities are mainly supportive and should be outsourced.
Cooperation
Cooperation between companies can lead to conflict. In order to avoid such conflict those activities that are produced by both organization should be subject to total outsourcing.
Source: Fill C. and Visser E. (2000), “The outsourcing dilemma: a composite approach to the make or buy decision”, Management Decision, Vol. 38 No. 1, pp. 43-50.
Outsourcing can free up assets and reduce cost in the immediate financial period. Outsourcing parts of the in-house operations, organizations report significant savings on operational and capital costs (Harland et al., 2005).
McCarthy and Anagnostou (2004) summarize the reasons for outsourcing, which are:
Exploit external supplier investments, innovations and capacities.
Reduce operating costs, whilst increasing focus on core competencies.
There are several other motivations for outsourcing beyond short-term cost savings. Outsourcing improves flexibility to meet changing business conditions, demand for products, services and technologies (Greaver, 1999). The Outsourcing Institute proposed the reasons when organizations choose outsourcing as an alternative rather than hiring full-time employee. From a Survey of Current and Potential Outsourcing End Users in 1998, there are ten most important reasons for organizations to outsource; (Ashe, 1999)
• Reduced operating costs: Companies trying to do everything themselves may incur very high deployment expenses, all of which are passed on to the customers. An outside provider's lower cost structure, which may be the result of a greater economy of scale or other advantage based on specialization, reduces a company's operating costs and increases its competitive advantage.
• Improved company focus: Outsourcing allows a company to focus on its
core competencies by having operational functions assumed by an outside expert.
• Access to experts and specialists: Experts and specialists make extensive
investments in technology, procedures, and people. Expertise can be gained by working with many clients who face similar obstacles. This combination of specialization and expertise gives customers a competitive advantage and helps them to avoid the cost of investment and training.
• Freeing of resources for other purposes: Every organization has the
limitation on the resources availability. Outsourcing allows an organization to redirect its resources, most often people, from noncore activities toward strategic activities that serve its customers.
• Resources not available internally: Companies outsource because they
do not have access to the required resources within the company. Outsourcing is a good alternative to build the needed capability from the beginning.
• Improved efficiency: To improve efficiency, a company must aim for
dramatic improvements in critical measures of performance such as cost, quality, service, and speed. In some instances, the need to increase efficiency can directly conflict with the need to invest in the primary focus of the business. Outsourcing the non-core functions to a specialist allows the organization to realize the benefits of maximizing efficiency. • Better control over difficult or complex functions: Outsourcing is a smart
option for managing complex tasks. When a function is viewed as complex or out of control, the organization needs to examine the underlying causes. The organization must understand its own needs in order to communicate those needs to an outside provider.
• Reduced capital expenditures: There is an enormous competition within
most organizations for capital funds. Deciding where to invest these funds is one of the most important decisions that top management makes. It is often difficult to justify secondary capital investments when primary departments compete for the same money. Outsourcing can reduce the need to invest capital funds in these secondary business functions.
• Reduced risk: Tremendous risks are associated with the investments an
organization makes. All aspects of the environment—such as markets, competition, government regulations, financial conditions, and technologies—change rapidly.
• Asset infusion: Outsourcing often involves the transfer of assets from the
customer to the provider. Equipment, facilities, vehicles, and licenses used in the internal operations have value and are sold to the supplier. Certain assets sold to the supplier reveal a win–win approach for both parties.
2.2.3 Disadvantage of outsourcing
Although there are many advantages to outsourcing, there are also a number of disadvantages. In some instances, advantages can become disadvantages, depending on the organization and the problems involved. Some organizations do not achieve the expected benefits from outsourcing, Lonsdale (1999) and Mclvor (2000) survey suggested that only 5 percent of companies achieved significant benefits from outsourcing. Fill and Visser (2000) also added that companies that continue to make sourcing decisions based solely on cost will eventually wither and die.
There is an initial tendency to overstate benefits and that the suppliers are likely to perform better in the beginning of the contract to make first good impressions (Schwyn, 1999). Lonsdale (1999) highlighted reasons for this: focusing from achieving short-term benefits; lacking of formal outsource decision-making processes, as well as medium and long-term cost benefit analyzed complexity in the total supply network. Anderson and Anderson (2000) identified three main problem that might occurs which are;
1. The diffusion of secret information.
2. The direct dependence on suppliers; they can cause delays or other problems
3. Losing the knowledge to integrate what has been outsourced, expanding in the long-term, costs of integration.
As quoted by Ashe (1999) in “Outsourcing relationships: why are they difficult to manage?” the research by InfoServer (1999) stated that the drawbacks of outsourcing include the following:
• No benefit from a drop in cost of work outsourced: In some industries,
when a long-term contractual agreement ends, a drop in the cost of outsourcing work does not necessarily mean a lowering of the cost to perform the work internally.
• Problems occurring in the aftermath of layoffs/downsizing: Morale
becomes a concern in the aftermath of some outsourcing deals. The remaining employees might have to work more extensively, struggling with problems such as meeting schedules, budget, and quality specifications while getting the same rate of pay.
• Outsourcing impeding the work of the organization: On rare occasions,
organizations have experienced production delays caused by the outsourcing provider
• Managing long-term relationships: Several factors contribute to a
not-so-perfect outsourcing relationship. The factors include (1) pricing and service levels, (2) differing buyer and supplier cultures, (3) lack of flexibility in long-term contracts leading to increased dissatisfaction, (4) both parties failing to make the most of the relationship at the expense of one another, (5) underestimating the time and attention required to manage the relationship or giving management responsibility to the vendor, and (6) lack of management oversight.
In addition to benefits and risks, Kremic, Tukel and Rom (2006) had analyzed outsourcing literatures and listed factors which may impact outsourcing decisions, showing on the Table 2 below;
Table 2: Expected benefits and Potential risks of outsourcing
Expected benefits Potential risks
Cost saving
Reduce capital expenditures Capital infusion
Transfer fixed costs to variable Quality improvement
Increase speed Greater flexibility
Access to latest technology/infrastructure Access to skills and talent
Augment staff
Increase focus on core functions Get rid of problem functions Copy competitors
Reduced politic pressures or scrutiny Legal compliance
Better accountability/management
Unrealized savings or hidden costs Less flexibility
Poor contract or poor selection of partner Loss of knowledge/skills and/or
cooperate memory and the difficulty in reacquiring a function
Loss of control/core competencies Power shift to supplier
Supplier problems (poor performance or bad relations, opportunistic behavior, not giving access to best talent or technology Lost customers, opportunities, or
reputation
Uncertainty/changing environment Poor morale/employee issues Other:
Loss of synergy Create competitor Conflict of interest Security issues
False sense of irresponsibility Legal obstacles
Skill erosion
Source: Kremic, T., Tukel, O.I. and Rom, W.O. (2006), “Outsourcing decision support: a survey of benefits, risks, and decisions factors”, Supply Chain Management: An International Journal, Vol. 11 No. 6, pp. 467-482.
Harland et al. (2006) reviewed outsourcing literatures and assessed the risks and benefits on outsourcing, adding more benefits/opportunities in organizations unit such as increasing ability to meet changing market needs, providing benefit through economies of scale and scope, freeing constraints of in-house cultures and attitudes, and providing fresh ideas and objective creativity. However, it also notes that the risks of failure to identify core and non-core activities can lead organizations to outsource their competitive advantage. Once an organizational competency is lost, it is difficult to rebuild. Combining strategic aspects with a rigorous cost analysis, organizations are in better positions that move them closer to their longer term goals (Fill and Visser, 2000).
2.2.4 Methods to avoid the problem of outsourcing
Ruffo, Tuck and Hague (2007) suggested methods to avoid these problems include:
Taking long-term view.
Never outsource core capabilities.
Prudently examine if any critical activities need to be outsourced, though only partially.
If outsourcing is made on a critical function, use two or more suppliers, in order to maintain quality and price competition. However, this will also increase the opportunity of technology diffusion.
Joint ventures.
2.2.5 Outsourcing decision framework
• A composite outsourcing decision
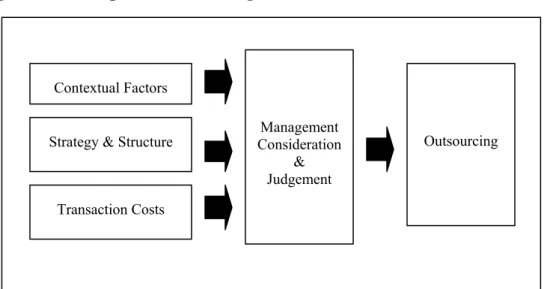
Figure 1: A Composite Outsourcing Decision Framework
Contextual Factors Strategy & Structure
Transaction Costs Management Consideration & Judgement Outsourcing
Source: Chris Fill and Elke Visser (2000), The outsourcing dilemma: a composite approach to the make or buy decision., Management Decision, No. 38, Issue 1, page. 43-50
Fill and Visser (2000) proposed a manufacturing outsourcing decision framework named “composite outsourcing decision framework” (CODF), by examining previous literature on the outsourcing decision that bring together the key decision criteria that management needs to regard when making outsourcing decisions. CODF consists of three main key aspects:
Element 1 – contextual factors
The contextual factors associated with both quantifiable (costs, investments, revenues, etc.) and non-quantifiable contextual factors (strategic interest, confidentiality, stability of employment, manageability, etc.). These factors can be internal and/or external conditions, analyzing by using Likert scale from 1 to
5, where it ranges from having low to high desirability for outsourcing 1 is low desirability for outsourcing respectively.
Element 2 – strategy and structure
The strategic and structural aspects associated with the company’s decision are based on a set of question proposed by Ewaltz in 1991. The question discusses the properties of production processes (e.g. uniqueness, capital needs, and idiosyncrasy), market conditions (e.g. cycles and customer behaviour), as well as supplier capabilities and corporate culture. The conclusion about outsourcing can be drawn from these answers (Palva, 2007). The nine guideline questions are developed to help the organization to consider the structural aspects associated with the decision and, in particular, to focus on how integrated the organization should be.
Table 3: Nine Guideline Questions
1. How unique are the production processes?
2. How severe are the market cycles? And how frequent? 3. Just how much capital does internal manufacturing require?
4. How does geographic dispersion of customers influence resourcing decisions? 5. Does the market expect the firm to be a manufacturer?
6. How long will the process be viable?
7. Are these suppliers capable of doing the work, in terms of both technology and capacity?
8. Are there idiosyncrasies in the product, the manufacturing processes, or the market that force a sourcing decision?
9. Can the corporate culture be changed?
Source: Ewaltz, D.B. (1991), “How integrated should your company be?”, Journal of Business Strategy, Vol.12 No. 4, pp. 52-55.
Element 3 – costs
The costs associated with two types of costs classified in production costs and coordination or transaction costs, as proposed by Williamson in 1979. Transaction cost analysis combines economics theory with management theory to determine the best type of relationship a firm should develop in the marketplace.(McIvor, 2000) Economic of scale for standardized products may obtain a lower production cost advantages. However, a high degree of customization involved in in-house production costs may be advantageous. Fill and Visser (2000) pointed out that it is difficult for decision-maker to narrow down whether which products are standard and which products require high customization. Regarding the coordination costs, high costs may incur when only a few alternative suppliers are available and monitoring of supplier behavior is required.
Williamson (1992) assumed that markets provide cheaper production costs than hierarchies through economic of scale and that markets cause companies to incur higher coordination costs than if the transaction was handled internally (Fill and Visser, 2000). In order to make this assessment, Williamson (1992) categorized transactions into two dimensions, frequency and asset specificity.
Fill’s and Visser’s framework proved to be useful and helpful in their case study of a real outsourcing decision which is effective in encouraging managers to consider the aspects other than cost when making outsourcing decision. However Fill and Visser stated that the limitations of the model are apparent when the cast for (against) outsourcing is not so clear cut and hard to estimate and know beforehand as in some scenarios.
To identify core competencies, apart from nine guidelines questions, there are other four key questions that might be useful. Once an organization understands its customer needs and success factors, its needs to develop and align its core competencies to meet these needs (Fawcett, Ellram and Ogden, 2007). The set of questions is asked in order to demonstrate and identify an organization’s core competencies.
Key questions to consider in identifying a core competency
1. Does the identified skill set contribute significantly to what customers perceive as our organizations value-added?
2. Is the skill set difficult for others to replicate or imitate?
3. Are we particularly good at the skill set, or willing to invest the resources to become excellent?
4. Is the skill set board enough that it allows us the opportunity to enter many diverse markets or businesses?
Source: Fawcett, Ellram and Ogden (2007), Supply Chain Management: From vision to implementation, New Jursey, Pearson Prentice Hall, page 281.
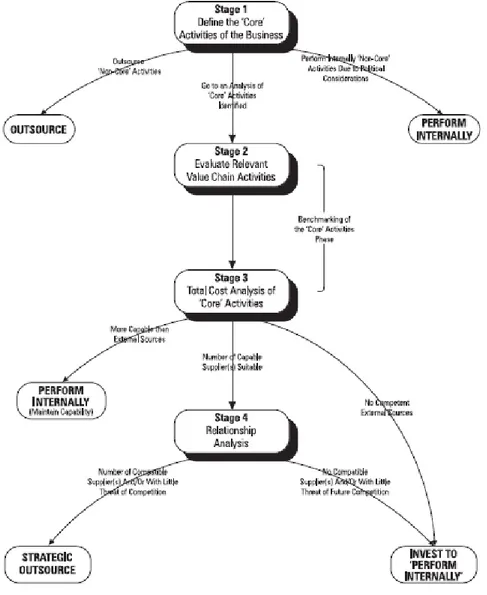
• A conceptual Framework for evaluating the make or buy decision
This practical framework model for evaluating make or buy decision is developed by R.T Mclvor as to assist an organization to overcome some of the problems associated with outsourcing decision. The framework integrates three key aspects of the value chain, core competency thinking and supply base influences into a decision making process. In the past, there is no formal method in evaluating the sourcing decision. Many organizations make sourcing decision primarily on the basis of short-term cost reduction with little consideration on its long-run strategic business direction. The inadequacy of existing cost system is another factor that can also lead to an ineffective sourcing decision. Many companies’ accounting system do not keep pace with the industrial changes and production technology, thus it may not provide a clear marginal decision on
either to make or to buy. An over-estimation in internal cost saving or production cost may then favor the buy decision. A core business definition also designates which activities to outsource or to make in-house. As the companies may define core activities as those things that they can do best, the decision may vary from one company to another depends on each company’s core competencies. However, if companies just base their decision on this alone, there is a clear risk that it may lead them to outsourcing activities with which they are having problems. Thus, the important implication of this model is that the organizations should give more strategic attention to the make or buy decision.
Figure 2: A Conceptual Framework for Evaluating Outsourcing Decsion
Source: McIvor R. (2000), A practical framework for understanding the outsourcing process, Supply Chain Management: An International Journal, Vol.5 No.1, pp.29.
This framework model is divided into four stages. The first stage is to identify the core and non-core activities of the organization. Core activity is the activity
performed by an organization that is able to serve the needs of potential customers in each market and is perceived by the customers as adding value, thus become a major determinant of a company’s competitive advantage. The process of identifying core activities need to be done by top management, however, inputs from the team in lower level of the organization are also required. The aim of this process is to maintain the control of the core activities within the business. Therefore, this model advises that a company should build the strategies around its core activities and outsource as many of the rest of the activities as possible. In general, all non-core activities are to be outsourced. Once all the core and non-core activities have been identified, next two stages are concerned with analyzing a company’s competency in terms of capability and cost to perform these core activities in relation to the potential external providers. A strategic issue of the make or buy decision is whether a company can maintain its competitive advantage by performing a core activity internally on an ongoing basis. In stage 2, a company considering outsourcing must evaluate the company’s capabilities in relation to both the suppliers and competitors. In the context of outsourcing decision, each company is in competition with all the potential suppliers of each activity in its value chain. Each selected core activity must be benchmarked against the competency of all potential providers of the activity regardless of which industry the provider might be in. Using benchmarking allows a company to look beyond the products to the operating and management skills which produce products. It concerns with the searching of best practice of a process or skill.
Further, in stage 3 is to do a total cost analysis for core activities. It includes all the cost associated with the attainment of the activity throughout the entire supply chain not just the purchasing price. In order to have a proper evaluation, management team must break down the functional cost into a cost of performing specific activity. The cost for the same activity for each competitor must be estimated in order to benchmark a company’s cost position against its competitor. The main purpose of stage 2 and 3 is to understand the current best practice in carrying out these core activities and how the actual cost can be achieved and to use this information to take appropriate action in relation to the make or buy decision. The benefit of doing this analysis is that the company can focus on using the limited available resources with activities that it can perform uniquely well and provide customers the most perceived value. For those activities that a company has neither significant strategic need nor the special capabilities, they should be outsourced.
When a company has completed benchmarking the competencies in performing the core activities, it will face with either of these two scenarios. One scenario is that a company is more competent than any other potential external sources. For another scenario, there are external sources that are more competent than in-house performance. Within each scenario, a company has two options: either make / invest to make or strategic outsource. For the first situation, if a company has the capabilities to perform a core activity uniquely well, then it is obvious that it should continue to keep this activity in-house. However, if the activity is currently outsourced, a company may want to acquire it back and perform it
internally in order to have and maintain its competitive advantage in this core activity.
On the other hand, in the second situation where the external providers are more competent, the company may need to invest on necessary resources to eliminate the difference between the company and the more competent external providers of the activity. However, if the company’s capabilities lag considerably behind those of external providers, it may be difficult to justify a substantial investment of resources in order to match or advance over the external capabilities. If this is the case, the option to outsource may be considered further.
Under both circumstances (scenario 1 &2), the option of strategic outsourcing is available. The company may decide to outsource a core activity to the most competent external sources if it sees the possibility that it may not be able to sustain its competency in this activity in the future. Through this strategic outsourcing option, a competitive advantage can also be achieved in the activity of specifying and integrating other external service and other purchases, rather than assembling and producing products themselves. One thing is that a company believes to be in a better position to react rapidly to the market changes and be more responsive to customers’ change, being more flexible by outsourcing. In this case, it should proceed to stage 4 – analysis of potential suppliers for partnership.
When the company considers outsourcing a core activity or the strategic item, the supplier assessment process is crucial. A careful analysis of potential supplier’s organization has to be executed. They should attempt to build a partnership type relationship or strategic alliances with a supplier in order to utilize their capabilities. Effective partnership relations require a clear understanding of expectations, open communication, mutual trust and commitment, and a sharing of information and risks. From this analysis of potential suppliers, the company will filter out any unqualified suppliers. If the company cannot find a suitable supplier with which to initiate a partnership relationship, they may have to pursue an invest-to-make strategy. However, if a company can find a suitable supplier, then a partnership relationship needs to be established so that the company can focus their own capabilities and resources on the value added activities.
2.3 Inventory
2.3.1 Role of Inventory
Inventory holding has played an important role in modern supply chains. Traditionally, inventory in form of safety stock is used as a buffer against uncertainty and to maintain customer service level. High inventory levels obviously reduce potential for stockouts and backorders, in which results in loss of sale and low customer satisfaction respectively. However, there has been some concern about the true cost of inventory and whether the companies do realize it fully (Baker, 2007). Whilst inventory provides some security against the fluctuation in the level of customer demand, there is concern that it may reduce the companies’ ‘quick response’, ability to react to the changes in demand such as responsiveness to new technology and speed to market for new product (Etienne, 2005). The logic of quick response (QR) is that demand is captured in as close to real-time as possible and as close to the final consumer as possible (Christopher, 2005). Since there are certain merits and some drawbacks of both low and high inventories, the companies must weigh the benefits of holding inventory and the cost of holding it. The challenge is to determine the optimum level of inventory to achieve competitive priorities of the business most efficiently - to provide the desired service level to customer at the minimized cost.
There are widely varying views about the inventory holding level in literature. While the aim of the traditional inventory control theory tends to optimize the inventory level, the lean and agile supply chain is emphasized on the minimization of inventory levels. Regardless of the different role of inventory playing in these theories, however, it is required to understand the part that inventory may play in some risk mitigation strategies. Some reasons for obtaining and holding inventory are:
• Predictability – To smoothen and synchronizing the capacity planning and production scheduling, you need to control the level of on-hand materials, parts, and subassemblies.
• Fluctuation of demand – Although every members in the supply chain needs to make a forecast of the downstream demand for its own production planning, the demand forecasting usually includes demand variability, in which it may cause a demand amplification- “bullwhip effect”. The bullwhip effect is a phenomenon when the variability of an upstream member’s demand is greater than that of the downstream member. (Yu, Yan, Cheng, 2001). Yet, inventory holding by the upstream member can, to a certain degree, secure the demand fluctuation from the downstream member. However, this effect can be eliminated through the increase of information sharing between members of a supply chain.
• Unreliability of supply – When an item is scarce and it is difficult to ensure the steady supply, inventory holding continue to be very significant component in a supply chain. This unreliability of supply is not referred to only the quantity and quality of supply, but also to the delivery lead-time. The supplier lead-time for replenishment is often unmatched with customer lead-time. The wide difference between the supplier lead-time and customer lead-time is known as lead-time gap (Harrison & van Hoek, 2005). The longer the supplier lead-time, the greater would be the level of safety stock (Baker, 2007).
• Price protection – Contracting to buy quantities of inventory in an appropriate time help avoid the impact of cost inflation. For example, a company issues blanket purchase order to lock in favorable pricing, while actual delivery does not require at the time of purchase, yet link with periodic release and receiving dates of the SKUs called for. (Muller, 2002)
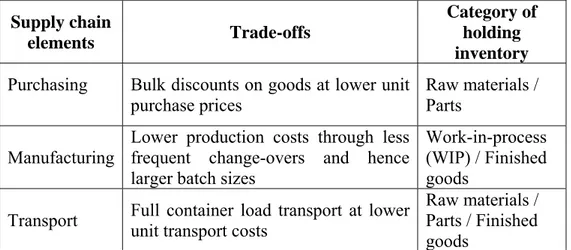
As the optimum level of inventory need to be identified, the full inventory cost has to be analyzed thoroughly. To assess and calculate the cost of inventory correctly, it is essential to identify the trade-offs between inventory and other supply chain elements shown in Table 4 (Baker, 2007). Nevertheless, the companies have to consider about the other associated cost that would occur relating to acquiring inventory, in which it will be clarified more in latter section, inventory cost.Having explored these trade-offs and associated cost, the appropriate level of inventory can be calculated using established inventory control theory.
Table 4: Trade-offs between Inventory and Supply Chain Elements Supply chain
elements Trade-offs
Category of holding inventory
Purchasing Bulk discounts on goods at lower unit purchase prices
Raw materials / Parts
Manufacturing
Lower production costs through less frequent change-overs and hence larger batch sizes
Work-in-process (WIP) / Finished goods
Transport Full container load transport at lower unit transport costs
Raw materials / Parts / Finished goods
2.3.2 Type of Inventory
Prior to further explore the inventory cost, the roles for each type of inventory in the supply chain need to be defined comprehended as each type has different accounting factors to take into consideration and calculation. Inventory
generally falls into three basic categories of raw materials, work-in-process (WIP), and finished goods.
• Raw materials: Goods that are purchased by an organization and used to produce partial or completed products.
• Work-in-process (WIP): Items that are converted from raw materials into partial product and subassemblies. They have been partly manufactured and had some value added. WIP occurs from such things as work delay, long movement between operations, and queuing bottlenecks. Ideally, WIP should be kept to a minimum.
• Finished goods: Completed products that are ready for sales or shipment to customers.
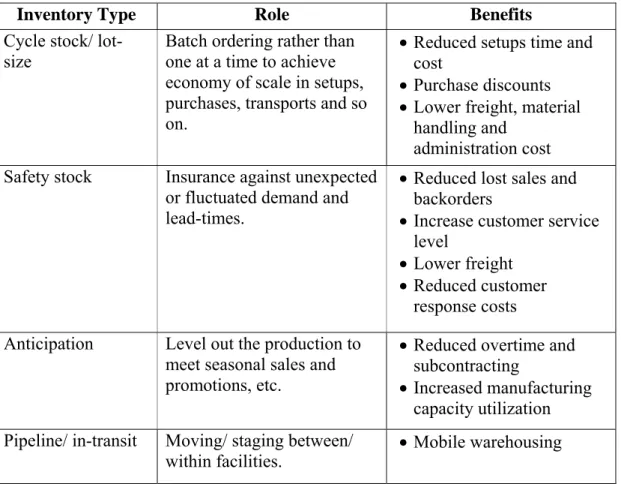
These three categories should be classified and considered from a functional standpoint. In this perspective, inventory takes four forms in general: (1) cycle, (2) safety stock, (3) anticipation, and (4) pipeline. Table 5 exhibits these types of inventory and the beneficial role that each type of inventory plays in the supply chain. (Frazelle, 2001)
Table 5: Inventory Types and Roles of Inventory in the Supply Chain
Inventory Type Role Benefits
Cycle stock/ lot-size
Batch ordering rather than one at a time to achieve economy of scale in setups, purchases, transports and so on.
• Reduced setups time and cost
• Purchase discounts • Lower freight, material
handling and administration cost Safety stock Insurance against unexpected
or fluctuated demand and lead-times.
• Reduced lost sales and backorders
• Increase customer service level
• Lower freight • Reduced customer
response costs Anticipation Level out the production to
meet seasonal sales and promotions, etc.
• Reduced overtime and subcontracting
• Increased manufacturing capacity utilization Pipeline/ in-transit Moving/ staging between/
2.3.3 Inventory Cost
Inventory cost can be classified mainly into ordering costs and holding costs. Ordering cost is the expense associated with buying things that come about regardless of the actual value of the purchased items. Expenses related to purchasing include salaries of purchasing staff, overhead expenses (e.g. rent and utilities), and expediting and tracking purchase orders. “In manufacturing, the purchase order cost corresponds to the setup cost of a machine or an entire production line” (Frazelle, 2001). This refers to the cost of setting-up and/or changing over the machinery.
Holding cost is the cost that ties up in carrying a quantity of inventory on-hand. Inventory carrying cost comprises of several components as shown in Figure 3 What Costs Go into Inventory Carrying Cost? (Adapted from Lambert, Douglas M., The Development of an inventory Costing Methodology; A Study of the Costs Associated with Holding Inventory, National Council of Physical Distribution Management, 1976, p.68)]
Figure 3: The Components of Inventory Carrying Cost
Inventory Carrying Cost Storage Space Costs Inventory Investment Insurance Taxes Obsolescence Damage Pilferage Relocation Costs Plant Warehouses Public Warehouses Rented Warehouses Company-Owned Warehouses Capital Costs Inventory Service Costs Inventory Risk Costs
Source: Goldsby, Thomas J. (2005), Lean Six Sigma Logistics, Ross Publishing, Inc., Florida, p.24.
Capital costs – is the largest factor of inventory carrying cost. As mentioned by
Christopher (2005), fifty percent or more of a company’s current assets will often be tied up in inventory. Inventory carrying cost directly reflects the opportunity cost of capital. “The cost of capital is the opportunity cost of investing in an asset relative to the expected return on assets of similar risk” (Krajewski, Ritzman, Maholtra, 2007). What else could you do with the amount of money if it not tied up with inventory? Hence, it is suggested that debt rate, cost of acquiring capital in order to invest in inventory, can be applied to this component.
Inventory service costs – Since inventory is regarded as one of assets, thus the
property tax rate and an insurance rate to provide coverage against loss and damage to the assets have to be applied in the inventory carrying cost percentage.
Inventory risk costs – Highly valuable products have high risk exposure to pilfer
and damage, thus they have higher cost attached to them than the lesser valuable items.
Storage space costs – is the cost associated with handling inventory and variable
storage cost. This cost incur when a firm rents space for storage and it varies due to the change of volume of inventory. It does not include fixed warehousing cost.
Since “inventory carrying cost is the most expensive cost in logistics” (Frazelle, 2001), there is the need to analyze the inventory holding cost trade-offs against ordering /set up cost and other supply chain elements. Preferably, they strive to be balanced, having the correct amount of product at the overall lowest cost. It is advised that “an EOQ analysis should be completed as a part of any inventory strategy” (Frazelle, 2001).
• Annual holding cost = Ch(Q/2)
Where Q/2 is the average inventory level • Annual ordering/ setting up cost = Co(D/Q)
Where D/Q is the number of order or setup per year (D = annual usage, Q = lot size in units)
• Total annual cost = Ch(Q/2) + Co(D/Q)
Total annual cost is the function that is to be minimized by choosing appropriate value of Q. Thus, EOQ is derived from the formula of total cost from any lot size Q. “EOQ is a point at which your cost of carrying inventory matches cost of purchasing.” (Muller, 2002)
2 D Co
Ch
• Non-instantaneous Replenishment
The methods discussed above are employed to calculate the total inventory cost and efficient lot size of items purchased from suppliers. However, if the items are produced internally rather than purchased, other methods have to be applied in order to reflect the true cost of work-in-process or finished goods inventory. After the items are produced internally, they can be used or sold as soon as they are completed without waiting until the full lot is completed. Thus, the maximum cycle inventory is defined:
Imax = Q/p (p-d) = Q (p-d/p) Where:
p = production rate per time period d = demand rate per time period
If p=d, production would be continuous with no build up of cycle inventory. If p<d, loss of sales opportunities is occurred on an ongoing basis. If p>d, the production rate occur faster than the demand rate, accumulating the cycle inventory and build up p-d units per time period. This build up continues at Q/p until the lot size, Q, has been produced, thereafter, inventory depletes at the constant rate of demand and reaches 0, the next production interval begins. The total annual cost equation for this production situation is:
C = Imax/2 (Ch) + D/Q (Co)
= Q/2 (p-d/p) (Ch) + D/Q (Co)
Note: Cycle inventory is no longer Q/2 as it was with the basic EOQ method,
but it is Imax/2
In a manufacturing environment, if the setup cost is high, having a large production run is justified as to minimize the total number and costs of setups in exchange of inventory building up as a result of the large production runs. The production run size that minimizes the total setup cost and inventory carrying cost is the economic production lot size (ELS). Based on the cost function, ELS formula is:
2 D Co
Ch
ELS = p
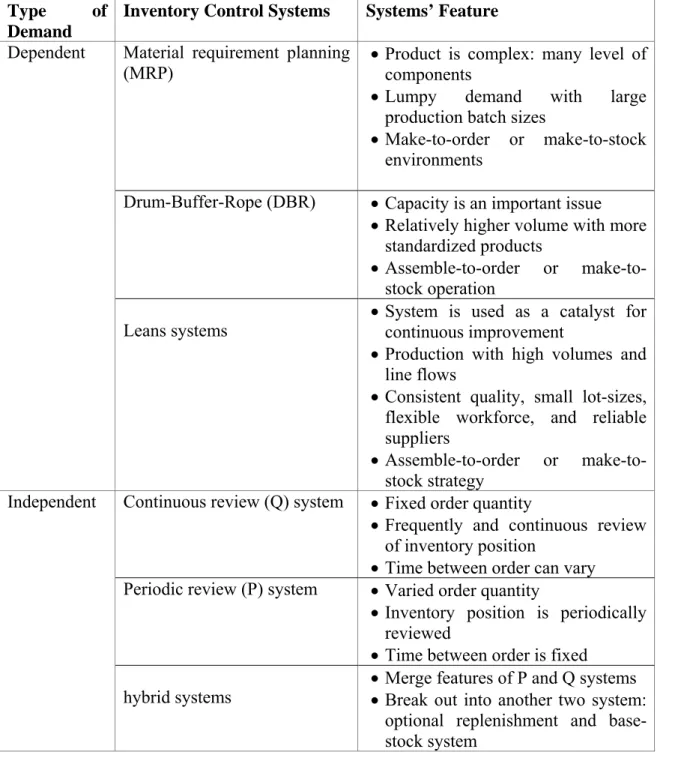
2.3.4 Inventory Control System
The objective of inventory management is to determine the optimized inventory level that is required for any organization to profitably and effectively operate. Basic principle of implementing inventory control system is to manage to have the right item, in the right quantity, at the right place and in the right time. There are several methods of inventory control system that assist you in forecasting the procurement needs. However, in selecting an appropriate inventory control system, a comprehensive knowledge on the nature of demand imposed on inventory items is required.
Most inventory fits into one of the above three categories: raw material, WIP, or finished goods, yet the amount of each category varies greatly depends on the specific industry and business. Distribution businesses tend to carry mostly finished goods for resale whereas manufacturing companies tend to have less finished goods and more raw materials and work-in-process (Muller, 2002). Other than the difference of distribution and manufacturing business nature and practices, there is the distinction of demand for the type of inventory they hold. Demand for finished goods, wholesale and resale merchandise, and replacement parts are said to be “independent”, while demand for items, required as components or inputs to a service or product, in manufacturing business are said to be “dependent”.
Generally dependent and independent demand, exhibiting different usage and demand patterns, thus must be managed with different techniques. Various inventory control system is selected for a particular application. Some of the prominent systems are shown in Table 6. The suggested systems are not restricted to apply to a specific type of demand; nevertheless the principles of several systems can be melded together. Each system is more effective in some situation than in the others, depending on the product complexity and the systems’ features.
Table 6: Inventory Control Systems and Systems’ Features Type of
Demand
Inventory Control Systems Systems’ Feature
Material requirement planning
(MRP) • Product is complex: many level of components • Lumpy demand with large
production batch sizes
• Make-to-order or make-to-stock environments
Drum-Buffer-Rope (DBR) • Capacity is an important issue • Relatively higher volume with more
standardized products
• Assemble-to-order or make-to-stock operation
Dependent
Leans systems • System is used as a catalyst for continuous improvement • Production with high volumes and
line flows
• Consistent quality, small lot-sizes, flexible workforce, and reliable suppliers
• Assemble-to-order or make-to-stock strategy
Continuous review (Q) system • Fixed order quantity
• Frequently and continuous review of inventory position
• Time between order can vary Periodic review (P) system • Varied order quantity
• Inventory position is periodically reviewed
• Time between order is fixed Independent
hybrid systems • Merge features of P and Q systems • Break out into another two system: optional replenishment and base-stock system
• Independent Demand
Independent demand – replenishment approach – “is influenced by market conditions and is not related to the inventory decision for any other item held in stock” (Krajewski, Ritzmand, Malhotra, 2007). Basically, in independent demand inventory management, the company needs to know how much the ordering quantity is required for each order by calculating the EOQ or lot-sizing and when the order needs to be placed by defining the inventory position where
a new order must be made, reorder point (ROP). The objective of ROP rules is high customer service level and low operating costs (Muller, 2002). However, to be able to answer these two questions, we need to identify how the organization reviews their inventory, either on a continuous review (Q system) or a periodic review (P system).
Q system has fixed order quantity in which the review of the remaining inventory of an item is done frequently and often continuously to determine whether it is time to reorder, while P system has fixed interval (P) of review where various lot-size or order quantity is made to reach the target inventory level (T) in order to sufficiently cover the expected demand during that fixed interval of review and delivery lead-time. In both systems, yet, safety stock must be set to provide acceptable customer service level for random demand during replenishment lead-times.
Q System:
ROP = (Average Demand x Lead Time) + Safety Stock
= (D x L) + S
P System:
T = Average Demand (Fixed Reviewing Interval + Lead Time) + Safety Stock for the Protection Interval
= D (P + L) + S (P + L)
Q system with a fixed order quantity has ROP as a determinant point of when to make a new order. Whenever the inventory level reaches ROP, it signals the need to place a new order. Thus, in Q system, the time between orders may vary depending on when ROP is arrived. However, P System with fixed order interval has T inventory level as a target quantity in making an order. When P period is arrived, the inventory position is reviewed. Hence, in P system, each order quantity or lot-size may be different depending on the inventory level at the time of review. The fundamental difference between Q and P systems is the length of time needed for protection interval, a period over which safety stock must protect the company from running out of stock. A Q system needs stockout protection only during the lead time period because order can be placed as soon as they need and will be received L period later. On the other hand, a P system needs stockout protection for a longer P+L protection interval as orders can be placed only at the fixed intervals and the inventory position is not checked until the next designated review time (Krajewski, Ritzman, Malhotra, 2007). Thus, the total annual cost formula including safety stock is:
Total annual cost = Ch(Q/2) + Co(D/Q) + Ch(S)
• Dependent Demand
Dependent demand – requirement approach – is the demand for items such as raw materials, components and assemblies that is dependent on the demand for
the final product. One of the dependent demand inventory control system that has been around for the longest is material requirements planning (MRP). Key elements of MRP:
Master production schedule (MPS) – sets out the quantity of finished
products that will be produced within specified period of time.
Bill of materials (BOM) – is the recipe of raw materials, components,
subassemblies and so on required to build or to make the finished products. It should specify the quantities required for each part.
The objective of MRP is to support the master production schedule. It translates master production schedule into the requirement for all subassemblies, parts and raw materials that needed to produce the required end items. MRP is best used when product is complex that is for a product which has many components which in turn have many components of their own, and so on. (Krajewski, Ritzman, Malhotra, 2007).
2.4 Feasibility Study and Investment Analysis
2.4.1 Feasibility Study
According to Small Business Encyclopedia, a feasibility study is a detailed analysis of a company and its operations that is conducted in order to predict the results of a specific future course of action. Small business owners may find it helpful to conduct a feasibility study whenever they anticipate making an important strategic decision.
The term of feasibility study is also used to refer to the resulting document. The results of this study are used to make a decision whether or not to proceed with the project (Wikipedia). The feasibility study is also used as an analysis of possible alternative solutions to a problem and a recommendation on the best alternative.
The main objective of this feasibility study is to determine whether a certain plan of action is feasible and whether or not it is worth doing economically. This study should focus on the proposed plan of action and also provide a detailed estimate of its costs and benefits in order to assist the management in making the right decision.
In this feasibility study, the authors used the investment analysis to clarify and present the costs and benefits between the two project alternatives so that the management can determine on which alternative is the best solution for the company.
2.4.2 Investment Analysis
A study of the likely return from a proposed investment with the objective of evaluating the amount an investor may pay for it, the investment’s suitability to that investor (quoted from www.answer.com) There are various methods of investment analysis, for example, cash on cash return, payback period, internal rate of return and net present value which each of them provides some measurement of the estimated return on an investment.
• Cash on cash return
The calculation determines the cash income on the cash investment. This method is often used in real estate investment in order to evaluate the cash flow from income-producing assets.
Cash on cash return = Annual Income Total Investment