ARCTIC
ARRCTCTICIC
CONTENTS
PUBLISHED BY THE SWEDISH ENVIRONMENTAL PROTECTION AGENCY
Swedish Environmental Protection Agency Working Group: Helena Sabelström (project leader), Pelle Boberg, Lars Klintwall, Titus Kyrklund and Linda Linderholm.
Editor: Maria Lewander, Grön idé AB
Graphic production: BNG Communication/Reform Act Translation: Semantix, www.semantix.se
Cover photograph: Mark Marissink. Kongsfjorden near Ny-Ålesund, Svalbard. The authors are responsible for the substance of the report.
The document was prepared with the support of appropriations from the national environmental monitoring programme, Swedish Environment Protection Agency.
ORDERING:
Order line: +46 (0)8 505 933 40. Order fax: +46 (0)8 505 933 99. E-mail: natur@cm.se Postal address: Arkitektkopia AB, Box 110 93, SE-161 11 BROMMA
www.naturvardsverket.se/publikationer ISBN 978-91-620-1299-1
The Arctic – the canary of climate change
5
Polluted air is changing the Arctic climate
11
Accessibility and pressure increasing in the Arctic
16
Is ground-level ozone a growing problem in the Arctic?
21
Methane in the Arctic
27
The ozone layer over the Arctic - past, present and future
31
Mercury is being transported to the Arctic
36
Mercury transport and deposition in Sweden
42
Environmental pollutants are being transported to the
Arctic via the atmosphere
46
How ocean acidification affects the Arctic
49
The effect of Arctic climate changes on the weather in Sweden 52
The Arctic Council
54
Sweden’s 16 environmental quality objectives
58
AIR & ENVIRONMENT
WE AFFECT THE ARCTIC. THE ARCTIC AFFECTS US.
There have always been air pollutants on Earth, but until the industrial revolution they were primarily of natural origin. For example, major volcanic eruptions and forest fires have historically had a substantial impact on the environment and the living conditions of mankind. However, with the emergence of the industrial world, we now face a very different situation, where in many cases air pollutants1 have a very adverse impact on the environment and human health and to a much
greater extent than was previously the case.
These pollutants do not remain where they are formed, but are transported by winds both regionally and globally. Until now, the Arctic has in many respects been situated a long way from the emission sources, yet it has still not escaped the effects of air pollutants. Because of its sensitive environment and extreme climate, the Arctic is particularly vulnerable to air pollutants. Such pollu-tants can accumulate in the environment and in the atmosphere of the polar regions and, in the case of environmental pollutants, they can also accumulate in food webs. Both the climate and the living environment can therefore be affected.
The Arctic is particularly vulnerable to climate changes. The Arctic climate is warming approx-imately twice as fast as the rest of the planet. Conversely, changes in the Arctic climate are also impacting on Sweden and the rest of the world.
The environmental monitoring programme monitors the state of the environment. Sweden’s northerly location means that the monitoring programme also provides us with important informa-tion which can help us to understand the possible consequences for the Arctic. The Swedish Envi-ronmental Protection Agency (EPA) has been monitoring air quality in Sweden for almost 40 years. The municipalities are responsible for monitoring in urban areas, while the responsibility rests with the EPA in the regional background, i.e. rural areas. This responsibility has increased over time, par-ticularly since Sweden joined the EU in 1995, and now encompasses the monitoring of a large num-ber of air pollutants across the country. Since 1989, the EPA has also been involved in the funding of monitoring on Svalbard, with a growing focus on climate issues over the past twenty years. The air monitoring carried out by the EPA is managed within the framework of the national air monitoring programme. See the end of this report for more information about this.
This report aims to highlight and raise the profile of environmental monitoring, both nationally and in a wider context. Without environmental monitoring, we would be unable to monitor the processes that are taking place in the Arctic or to reverse trends which are heading in the wrong direction. International collaboration is vital, not only with regard to measures, but also as regards environmental monitoring.
We hope you will find the report both interesting and useful!
The editorial team
PHOTOGRAPH: MARK MARISSINK
FACTS: The canary of climate change
This expression refers to the use of canaries by mine workers in the past as an indicator of how dangerous the air in the mine shafts was. If the canary reacted to the air or even died, it was time to get out of the mine shafts quickly. In a similar way, the Arctic can act as an indicator for the climate changes that are occurring.
The Arctic has been inhabited by indigenous peoples for thousands of years. During the 16th century, European interest in the Arctic grew, in the first instance as an easier trade route between Europe and Asia. A E Nordenskiöld’s Vega expedition from 1878 to 1880 was the first to
pass through the Northeast Passage, but the conclusion drawn from this expedition was that the route was unsuitable for use as a trade route. A decade later, construction of the Trans-Siberian railway began. The railway diverted thoughts away from using the Northeast Passage as a
regular trade route for a long time afterwards. Some commercial ship-ping undoubtedly passed through the passage during the 20th century, but it was not until the ice cap began to shrink more continuously that the idea of using the Northeast Passage as a trade route began to be taken
The Arctic
– the canary of climate change
The Arctic is situated far from the major population centres, yet it is still very exposed to
the effects of air pollutants and greenhouse gases. Over the past 100 years, the mean
temperature of the Arctic has risen by approximately twice as much as the global mean
temperature. The Arctic can be considered to be the ‘canary of climate change’. The
ma-jor changes which are already taking place will have an increasing impact on the climate
and environment elsewhere in the world. We affect the Arctic and the Arctic affects us.
USA
CANADA
NORTH POLE RUSSIA
GREENLAND ICELAND SWEDEN NORWAY SWEDEN FINLAND
FACTS: The Arctic
Unlike Antarctica, which is a clearly defined land mass, the Arctic consists of a marine area with an ice cover of varying extent and a number of adja-cent land areas. As a result, there is no clear definition of the Arctic. One common definition is that the Arctic covers all the oceans and land north of the Arctic Circle (the 66th parallel north). Another common definition is that it encompasses all areas above the tree line. Another way of defining it is that it covers all areas with a mean temperature in July not excee-ding 10°C. The Arctic is sometimes also divided into the High Arctic, the Low Arctic and the Subarctic.
Under some of these
definitions, Sweden is not actually in the Arctic, unlike Svalbard, where some of the EPA’s environmental monitoring is carried out. In political contexts, reference is often made to “the Arctic and the Arctic States”, i.e. the region north of the Arctic Circle and the eight States which belong to this region: Denmark including Greenland, Finland, Iceland, Canada, Norway, Russia, USA and Sweden. Various definitions may have been used in the articles in this report. Source: The Encyclopedia of Earth, AMAP, CAFF.
High Arctic Low Arctic Subarctic
Arctic Circle Tree line
seriously again. The possibility of also using the Northwest Passage as a trade route lies somewhat further into the future.
NEW SITUATION
The Arctic has a harsh climate and a large proportion of the region is dark for many months of the year.
Despite this, the region is attractive, partly because of its minerals deposits and energy and oil resources, but also because of the potential time gains for shipping between Europe, Asia and North America.
As the ice cover shrinks, the re-gion becomes increasingly accessible for such activities. The proximity of the industrial world and access to energy thus makes the region both attractive and vulnerable, and many countries have developed an interest in the Arctic region (Read more on page 16).
Of the world’s as yet undiscove-red oil resources, only a small pro-portion is believed to be located in the Arctic, but the gas resources may
be as much as a third. Interest in extracting the Arctic’s resources and the search for new shipping routes are impacting on the environment and could threaten the natural envi-ronment and traditional lifestyles.
These activities are also having an impact on the countries around the Arctic and may also have a global effect. A number of international collaborations have been established to protect the Arctic insofar as pos-sible and to monitor trends (Read more on page 54).
CURRENT PROBLEMS
In addition to carbon dioxide emissions, air pollutants such as particulate matter and ground-level ozone are contributing to climate change and adversely affecting the environment in the Arctic and subar-ctic regions. High concentrations of air pollutants and climate changes in the Arctic are for example affecting ecosystem services and threatening traditional lifestyles. The conditions for reindeer husbandry, fishing and hunting may change.
The Arctic’s cold climate also contributes to the deposition and accumulation of environmental pollutants such as mercury and organic environmental pollutants in food webs. (Read more on pages 36 and 46). This particularly affects animals and people who live on fish and seal. The exploitation of oil and gas and the increase in shipping and tourism are also affecting the living conditions of people in the Arctic in different ways.
The climate changes are taking place especially quickly in the Arctic and the natural environment in the region is particularly sensitive, partly because species adapted to the cold climate cannot move further north as the temperature rises. The region is also particularly vulnerable to oce-an acidification, which is also caused by our atmospheric emissions of carbon dioxide, in addition to the changes in climate (Read more on page 49).
The warming of the Arctic is af-fecting the rest of the world. Melting of the Greenland inland ice, together
with the Antarctic ice, may result in substantial sea level rises globally. The Arctic permafrost also holds a substantial proportion of the world’s carbon stocks. As the Arctic thaws, a proportion of the carbon stock is re-leased in the form of carbon dioxide and methane, a process which can further accelerate global warming (Read more on page 27).
To slow down the climate changes that are occurring in the Arctic and globally, the most important measure is to substantially reduce emissions of greenhouse gases, particularly carbon dioxide, methane, nitrous oxide and the air pollutants (including methane) which form ground-level ozone. As regards the reduction of ground-level ozone, there is also a combined effect which will lead both to better air qua-lity, as ozone is harmful to health and vegetation, and also to reduced climatic impact. A combination effect similarly exists with regard to the reduction of particulate soot emissions, but not for particulate sulphate, whose occur-rence in the atmosphere reduces the warming (Read more on page 10).
The group of substances which both impact on air quality and contribute to warming of the climate is often known as ‘climate forcers’ or SLCP – Short-Lived Climate Pollutants, because of their short life in the atmosphere compared with carbon dioxide, for example.
With regard to the ozone layer high up in the stratosphere, there are also complex links and interactions with other environmental problems. For example, some greenhouse gases deplete ozone, which is itself a greenhouse gas. There is also a clear interaction between the thickness of the ozone layer, the temperature of the atmosphere and global wind patterns. As far as the Arctic is concerned, however, it is the greenhouse effect itself which has the greatest impact, as ozone depletion is increasing
in the cold stratosphere, which paradoxically is actually becoming colder. (Read more on page 31.)
The ozone in the stratosphere also affects the ground-level ozone, as some of the ozone in this layer can be transported down to the troposphere over the Arctic, and thereby contribute to an increase in ground-level ozone concentrations.
THE IMPORTANCE OF
ENVIRONMENTAL MONITORING
Under the EPA’s national air moni-toring programme, a large number of air parameters are monitored in rural areas in Sweden, e.g. nitrogen and sulphur compounds, particulate matter, ground-level ozone, organic environmental pollutants, pesticides, UV radiation and the thickness of
THERMOSPHERE 120 110 100 90 80 70 60 50 40 30 20 10 0 M ES OS PH ERE ST RATO SPH ERE TR OPO SPH ER E
THE VARIOUS LAYERS OF THE ATMOSPHERE (outline division)
The troposphere – a 6 to 18 km high layer, depending on where on the Earth you
are. The temperature decreases with distance from the Earth’s surface and is around -50°C in the upper part of the layer. The troposphere contains virtually all the water that occurs in the atmosphere and it is in this layer that what we call ‘weather’ hap-pens. It is primarily in this layer that air pollutants are transported.
The stratosphere – up to an altitude of around 50 km. In the lower part of the
stratos-phere, the temperature is relatively constant (approx. -50°C), while in the upper part, the temperature rises to close to 0°C when ozone absorbs the sun’s rays and warms the atmosphere.
The mesosphere – at an altitude of 50 – 85 km; the coldest layer with temperatures
down to approx. -90°C; this layer is at its coldest during the summer.
The thermosphere – from an altitude of 85 km to several hundred kilometres out
from the Earth’s surface. A few tens of kilometres up, the temperature rises rapidly; how much depends on the activity of the sun. This air is very thin here and is easily heated to well over 1500°C in the upper part of the thermosphere. Source: Swedish Meteorological and Hydrological Institute (SMHI).
the ozone layer. This monitoring takes place through measurements, sampling and modelling. The pro-gramme also carries out monitoring outside Sweden, in Pallas on the border between Sweden and Finland and on Svalbard. These are our most northerly monitoring stations and are situated closest to the Arctic. (Read more on page 60.)
In addition to the air monitoring carried out by the EPA, Swedish environmental monitoring and research are also carried out under the direction of other organisations in the Arctic. A topical example is SWERUS-C3, an international re-search expedition involving the ice-breaker Oden in the Arctic Ocean. In a Swedish-Russian-American collaboration during 2014, a total of around 80 researchers conducted research in various fields, including climate change and in particular the importance of the methane that oc-curs in the Arctic and how the Arctic was formed.
A fundamental motivation
be-hind the environmental monitoring is to demonstrate the link between impact and effects in order to propose the right measures. It is also important to be able to carry out follow-up to ensure that measures and decisions are having the desired effect and to identify new distur-bances. A cornerstone of Sweden’s strategy for the Arctic region is to continue to improve the coordina-tion of environmental monitoring in the Arctic.
FUTURE DEVELOPMENT
The Arctic is a unique region which has a harsh climate just like Antarc-tica, but it is not as isolated from the rest of the world. Unlike Antarctica, the Arctic also does not have a common protection system like the Antarctic Treaty. According to the Antarctic Treaty, Antarctica may only be used for peaceful and scien-tific purposes. Fifty states worldwide have acceded to the treaty. A cor-responding Arctic Treaty has been discussed by the European
Parliament and others, but rejected by the USA, for example, on the basis of the differences between the regions.
Sweden and other Arctic countries have developed national strategies concerning their approach to the Arctic. Common to the policy expres-sed in these national strategies is that the region must be stable from the perspective of security policy and characterised by environmental con-siderations, but other than this, the strategies differ somewhat, primarily as a result of special national inte-rests, such as energy extraction and shipping channels. Sweden wishes to reinforce the Arctic Council both institutionally and politically by expanding its mandate to also cover issues other than the environment and climate, e.g. common security, infrastructure and social and econo-mic development. Helena Sabelström helena.sabelstrom@naturvardsverket.se Pelle Boberg pelle.boberg@naturvardsverket.se Lars Klintwall lars.klintwall@naturvardsverket.se Titus Kyrklund titus.kyrklund@naturvardsverket.se Swedish Environmental Protection Agency
PHOTOGRAPH: KJELL PETERSON
National air monitoring in Bredkälen, Jämtland County.
SUGGESTED READING:
Polar Research Secretariat www.polar.se
Polaris – möte med världens poler www.polarisen.se
The Antarctic Treaty. Secretariat of the Antarctic Treaty, www.ats.aq
Olja och gas i ett nytt och förändrat Arktis. Swedish Defence Research
Agency FOI (2010). www.foi.se under Våra tjänster/FOI:s rapporter & publikationer
Sweden’s strategy for the Arctic Region.
Ministry for Foreign Affairs. www.regeringen.se under Publikationer
PHOTOGRAPH: MARK MARISSINK
Black-legged kittiwake (Rissa tridactyla), Svalbard.
PHOTOGRAPH: MARK MARISSINK
The reason why climate changes in the Arctic are taking place so rapidly compared with the rest of the world is still largely unknown. One hypothesis is that a small rise in temperature results in melting of the sea ice, which dramatically reduces the albedo (see fact box), which in turn accelerates the warming process considerably. Other observations
indicate major changes in cloud cover, which increases the reflection of outgoing thermal radiation during the winter. This means that the cloud cover acts like an extra layer of ther-mal insulation over the Arctic in the winter and results in a higher mean temperature during the winter.
Carbon dioxide concentrations in the atmosphere are continuing to
rise by about 2 ppm per year and are now above 400 ppm throug-hout the winter. Short-lived climate pollutants, such as soot, could be a contributory factor behind the rapid pace of climate change, but soot con-centrations have actually fallen and then stabilised over the past decade. Concentrations of air pollutants in the Arctic are generally low and most pollutants originate from sour-ces thousands of kilometres away. They primarily consist of airborne particulate matter, often sulphates, organic pollutants and soot, fre-quently mixed together in a single particle.
In addition to the fact that the particulate matter transports pol-lutants which are deposited in and affect the Arctic environment, the Arctic climate is also affected, but in a different way than at lower latitudes.
The Arctic’s extreme climate makes the environment very
sensitive to changes. In recent decades, the rate of
war-ming of the Arctic has been two to three times that of the
global temperature and the mean winter temperature on
Svalbard has risen by 6°C over the past 20 years. New
climate models based on environmental monitoring data
have now started to give us an insight into how and why the
Arctic climate is changing so rapidly. These models also
show how air pollutants have affected and will continue to
affect the climate in the region.
Polluted air is changing the Arctic climate
FACTS: Albedo
Albedo is an indication of reflectivity or the proportion of radiation that is reflected by an illuminated body. The more ice that melts, the more reflec-tion decreases, as pale surfaces are replaced by darker surfaces, which increases the warming even more.
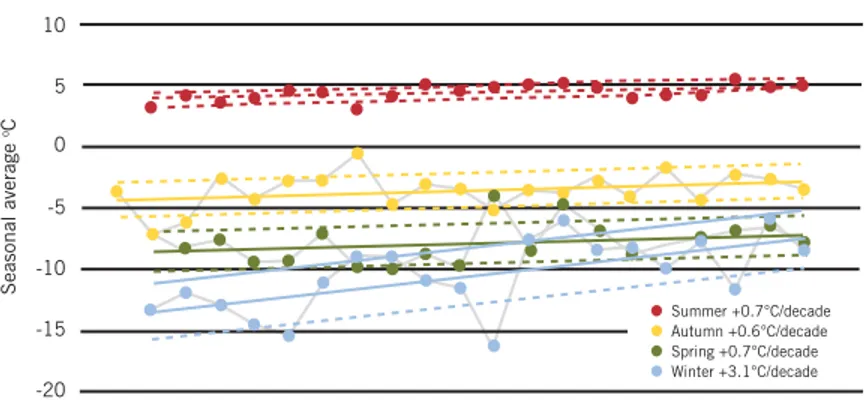
FIGURE 1. Change in seasonal mean temperatures measured in Ny-Ålesund, Svalbard.
Source: Maturilli et al., 2014.
1992 1994 1999 2010 2012 Seasonal average oC 1998 1996 2000 2002 2004 2006 2008 Summer +0.7°C/decade Autumn +0.6°C/decade Spring +0.7°C/decade Winter +3.1°C/decade Change in seasonal mean temperatures, Svalbard
Winter SPRING SUMMER Impact on thermal radiation
Effect of soot on snow, reduces reflection of solar radiation
Dirty air absorbs more solar radiation and becomes warmer
Dirty clouds insulate better through increased reflection of
thermal radiation
Less solar radiation reaching the surface results in cooling, but the net effect is small
as the surface is primarily white
Net effect on surface can be either cooling or warming
depending on the pollutant concerned
Earlier melting
Dirty clouds reflect more solar radiation
Deposited soot
FIGURE 3. Airborne particulate matter and its size and quantity distri-
butions. Mean of day concentrations measured at the Zeppelin re-search station. Ny-Ålesund, Svalbard, March 2000 – December 2010. Source: Tunved et al., 2013.
FIGURE 4. Aerosols,
inclu-ding soot, affect the Arctic climate. The figure shows the various climate-chang-ing atmospheric processes which occur in the Arctic at different times of the year Source: AMAP, 2011.
TRENDS IN THE ARCTIC CLIMATE
Measurements taken in Ny- Ålesund on Svalbard since 1992 indicate that the annual mean tem-perature has risen by an average of 1.3°C per decade. The winter mean temperature has increased by 3.1°C per decade – a dramatic change in the Arctic climate (see Figure 1). The reason for these substantial changes compared with the global temperature change is as yet unclear.
RISING CARBON DIOXIDE CONCENTRATIONS
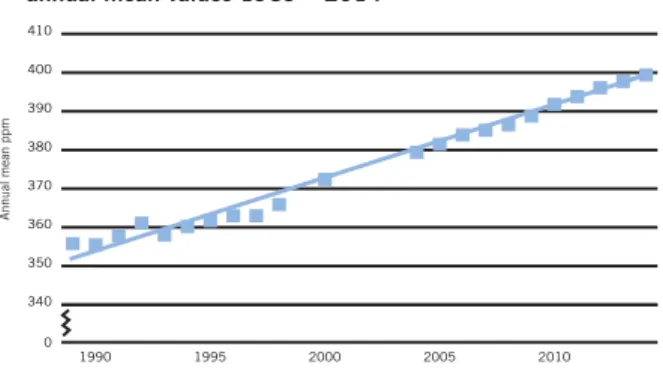
With funding from the EPA and others, Stockholm University has been measuring carbon dioxide con-centrations at the Zeppelin research station in Ny-Ålesund on Svalbard since 1989. In 2013, winter concen-trations passed the 400 ppm mark. The increase has stabilised at around 0.5 percent or 2 ppm per year and during 2015 the mean value will
pass 400 ppm (see Figure 2). Carbon dioxide concentrations on Svalbard follow concentrations at other measuring stations, such as on Mauna Loa on Hawaii, which has the world’s longest data series for atmospheric carbon dioxide con-centrations. That the concentrations follow the same trend is down to the fact that carbon dioxide is a long-lived, and therefore well-mixed, gas in the atmosphere. Concentrations
Particulate matter size and quantity. Svalbard 2000-2010
Particle diameter (m)
Jan Feb Mar April May June July Aug Sep Oct Nov Dec
Number particles / cm3 10-8 10-7 100 10 ILLU: A MULDER Annual mean ppm 1990 1995 2000 2005 2010 340 0 350 360 370 380 390 400 410
Concentrations of carbon dioxide in the atmosphere, annual mean values 1989 – 2014
FIGURE 2. Annual mean values of carbon dioxide concentrations
at the Zeppelin research station, Ny-Ålesund, Svalbard. Source: Aces, Stockholm University within the environmental monitoring programme
on Svalbard are somewhat higher compared with Mauna Loa, as the measurements are taken further north and at a lower height above sea level, but the trend is the same.
HIGH CONCENTRATIONS ARE RESULTING IN ARCTIC HAZE
In the most northerly parts of the Arctic, there is total darkness for about four months of the winter. The length of the days then increases to 24 hours in about two months and the midnight sun then lasts for about four months, followed by a two month-long autumn. When the spring arrives and the temperature rises, large quantities of warm air are transported northwards to the Arctic from Northern Eurasia, particularly Central Europe, which usually re-sults in some cloud formation. There is no precipitation here either. This makes the transport of air pollutants very effective and leads to very high concentrations of air pollutants in the Arctic. This phenomenon has
been observed since the 1950s and is known as ‘Arctic Haze’. This yel-lowy brown haze primarily contains particulate sulphur and soot.
During the summer, the parti-culate mass in the air is very low and largely only originates from local sources, as there are very few oc-casions when long-distance transport takes place. In addition, the deposi-tion of particulate matter is high as a result of increased precipitation in the Arctic, which further reduces particulate concentrations in the Arctic. In the autumn, long-distance transport gradually increases and precipitation decreases, thereby resulting in an increase in concentra-tions in the atmosphere.
This is clearly apparent from mea-surements of the particulate matter and its size distribution (see Figure 3). During the winter and spring, there are many large particles. As the particulate matter is being transpor-ted over long distances, gases con-dense onto them, so increasing their
size. During the summer, the number of particles remains approximately the same, but they are only a quarter of the size compared with the rest of the year, which results in a conside-rably lower particulate mass during the summer. The size difference indicates that the particulate matter is newly formed in the summer and older in the winter.
The substantial seasonal variations and the generally white land surface in the Arctic means that local climates are affected in a unique way (see Figure 4). The cloud cover during the winter insulates the ground surface by reflecting outgoing thermal radia-tion, which leads to higher winter temperatures.
With the Arctic Haze during the spring, the reflection of solar radia-tion by the cloud cover and ground surface changes. Particulate soot on the white surface of the snow has been put forward as an important factor behind increased melting. The dark particulate soot causes the sun’s
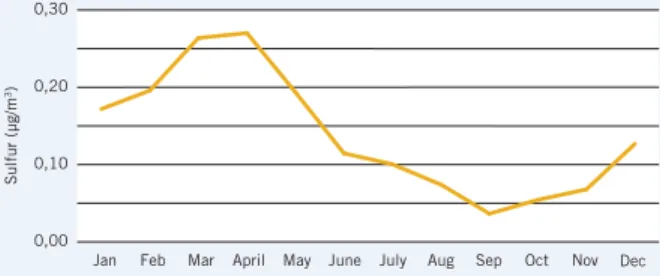
FIGURE 5. Concentrations of particulate sulphur and soot measured at the Zeppelin research station in Ny-Ålesund on Svalbard
Source: EBAS, NILU and Stockholm University.
Sulfur (μg/m 3) 0,05 0,10 0,15 0,20 1993 1995 1997 1999 2001 2003 2005 2007 2009 2011 2013 Sulfur (μg/m 3)
Jan Feb Mar April May June July Aug Sep Oct Nov Dec 0,00 0,10 0,20 0,30 0 0,10 0,15 0,20 2006 2007 2008 2009 2010 2011 2012 2013 2014 Absorption (mm-1) Absorption (mm-1) 0,00 0,10 0,20 0,30 0,40
Jan Feb Mar April May June July Aug Sep Oct Nov Dec Airborne sulphur, 1993 – 2013 (annual mean concentrations) Seasonal variation of sulphur (monthly mean values)
Absorbent particulate matter, 2006 – 2014 (annual mean concentrations)
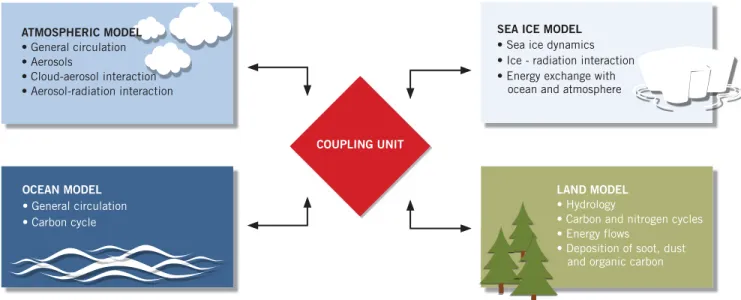
FIGURE 6. Description of the model components in the Norwegian Earth System model NorESM. Source: Kirkevåg et al., 2013.
rays to be absorbed more readily, rather than reflected.
This causes the snow and ice to melt even faster. Overall, these processes result in faster warming, with rising concentrations of parti-culate matter, regardless of chemical composition, during the winter, while light-dispersing particulate matter such as sulphur cause cooling, and absorbent particulate matter such as soot cause warming during the summer.
SULPHATE AND SOOT TRENDS
Arctic Haze is clearly apparent in the seasonal variation of sulphate and soot concentrations (see Figure 5). Concentrations during the spring (April-May) are almost ten times higher than during the late summer. However, sulphur concentrations during Arctic Haze have fallen by around 25 percent since 1993, although they have not changed sig-nificantly over the past decade. The latter trend also applies to soot and
it is therefore unlikely that the clima-tic impact of the parclima-ticulate matter has changed, at least not during the past ten years.
MODELS OF THE CLIMATIC IMPACT OF AIR POLLUTANTS
The specific meteorology of the Arctic and the limited number of observation sites make it difficult to model the transport and concentra-tions of air pollutants, and there fore how they impact on the Arctic
ATMOSPHERIC MODEL • General circulation • Aerosols • Cloud-aerosol interaction • Aerosol-radiation interaction OCEAN MODEL • General circulation • Carbon cycle
SEA ICE MODEL
• Sea ice dynamics • Ice - radiation interaction • Energy exchange with ocean and atmosphere
COUPLING UNIT
LAND MODEL • Hydrology
• Carbon and nitrogen cycles • Energy flows
• Deposition of soot, dust and organic carbon •
•
FIGURE 7. The figure shows simulations
using the Earth System model NorESM of how reduced sulphur emissions have contributed to the change in temperature. The map shows the modelled temperature changes during the period 1980 – 2005. The temperature change is only significant within the dotted area. The tempera-ture change during the same period in Ny-Ålesund-Svalbard is +2.6°C. Source: Acosta & Varma et al., 2015.
Modelled relationship between reduced sulphur emissions and temperature, 1980 – 2005
Measured temperature increase +2.6°C, Zeppelin station, Svalbard
Temperatur (°C)
climate. The Arctic climate is also strongly dependent on the transport of heat from the south. The heat is carried on ocean and air currents, changes in which are caused by clima-te changes elsewhere in the northern hemisphere, which in turn can be the result of climate forcers outside the Arctic. To attempt to show how all these various processes impact on the Arctic, global ‘Earth System mo-dels’ are needed. These models link together the oceans, atmosphere, land and ecosystems and how they affect and are affected by climate in order to provide as complete a description of the climate system as possible (see Figure 6). The aim is a more accurate description of the climate, which will enable more accurate forecasts of future climate developments.
HISTORICAL AND FUTURE IMPACTS
Since the 1980s, sulphur emissions from Europe have fallen by about 80 percent. This development has had a substantial impact on sul-phate concentrations across Europe and the Arctic. Sulphur emissions have also risen elsewhere in the world, particularly China. However, the global load of sulphur in the atmosphere has fallen by around 25 percent overall since 1980. Particula-te sulphur generally has a cooling effect on the atmosphere. NorESM calculations show that the decreasing sulphur emissions have probably contributed to warming of the Arctic by about 0.5 (see Figure 7). Howe-ver, as Figure 1 shows, the Arctic is warming at a much faster rate, most likely as a result of rising carbon dioxide concentrations.
Particulate soot is often consi-dered to be a factor in to the rapid pace of climate change in the Arctic, but simulations using NorESM and other models show that the occur-rence of particulate soot only has a relatively small impact compared
with sulphur. These findings differ from those of previous models, but our understanding of the impact of particulate soot on the Arctic climate is still insufficient to draw any certain conclusions concerning their actual impact on the climate.
Today’s models all indicate that European emissions of particulate matter have an impact on the cli-mate, particularly in the Arctic, while the impact in the emissions area itself is relatively modest, particularly in Eastern Europe. This is probably be-cause the air pollutants are changing the radiation balance, i.e. the sum of incoming and outgoing radiation. This process is impacting on entire weather systems, increasing the transport of heat to the Arctic, which in turn is limiting climate change in Europe. Air pollutants in Europe therefore have an indirect impact on the climate in the Arctic. A substantial global reduction in emissions through the introduc-tion of the best possible technology in accordance with IIASA’s ”Maxi-mum Feasible Reduction” scenario, entailing a reduction of around 70 – 80 percent of emissions of sulphur, particulate matter and particulate matter-forming gases, would probably result in further warming of around 1°C in the Arctic. However, it should be noted that the increase in carbon dioxide alone will result in warming equivalent to at least 3°C in the Arctic.
AIR POLLUTANTS NOT DECISIVE
Climate changes cannot be stopped by reducing air pollutants. Model simulations undoubtedly show that substantial reductions in emissions can have a significant impact on the climate in certain regions, but carbon dioxide emissions are set to completely dominate climate change in the future. This will be the case even if such emissions are limited to ensure that the 2°C target for global warming is not exceeded.
Modelling climate changes is very complicated. The monitoring of climate-changing key parameters is absolutely vital to enable the develop-ment and evaluation of the models in a way which enables future deve-lopments in the Arctic climate to be predicted with sufficient accuracy.
Hans-Christen Hansson,
Stockholm University
hanschristen.hansson@aces.su.se
SUGGESTED READING:
AMAP, 2011. The Impact of Black
Carbon on Arctic Climate (2011).
P.K. Quinn, A. Stohl, A. Arneth, T. Berntsen, J. F. Burkhart, J. Christen-sen, M. Flanner, K. Kupiainen, H. Lihavainen, M. Shepherd, V. Shev-chenko, H. Skov, and V. Vestreng. Arctic Monitoring and Assessment Programme (AMAP), Oslo. 72 pp.
J. Acosta Navarro, V. Varma, A. Ekman, I. Riipinen, Ø. Seland, A. Kirkevåg, H. Struthers, M. Gauss, T. Iversen & H-C. Hansson, 2015.
Amplification of Arctic warming by air pollution reductions in Europe, submitted to Nature Geoscience.
A. Kirkevåg, T. Iversen, Ø. Seland, C. Hoose, J. E. Kristjansson, H. Struthers, A. M. L. Ekman, S. Ghan, J. Griesfeller, E. D. Nilsson & M. Schulz, 2013. Aerosol – climate
interactions in the Norwegian Earth System Model – NorESM1-M, Geosci. Model Dev., 6, 207 – 244.
M. Maturilli, A. Herber, & G. König-Langlo, 2014. Surface radiation
climatology for Ny-Ålesund, Svalbard (78.9° N), basic observations for trend detection, Theor Appl Climatol
DOI 10.1007/s00704-014-1173-4.
P. Tunved, J. Ström, & R. Krejci, 2013.
Arctic aerosol life cycle: linking aerosol size distributions observed between 2000 and 2010 with air mass tran-sport and precipitation at Zeppelin station, Ny-Ålesund, Svalbard, Atmos.
Chem. Phys., 13, 3643 – 3660.
Stockholm University’s measure-ments of air pollutants in the Arctic: www.aces.su.se/zeppelin
Norwegian Institute for Air Research: www.nilu.no
The impact of climate changes is clearly apparent in the Arctic, where the ice is melting and
shrinking. As the ice shrinks, it becomes easier to shipping to reach new locations for oil and
mineral extraction, and new shipping routes between Europe, Asia and North America open
up. The increased exploitation of the Arctic would have a further negative impact on the
climate and atmosphere, particularly as a result of higher carbon dioxide emissions.
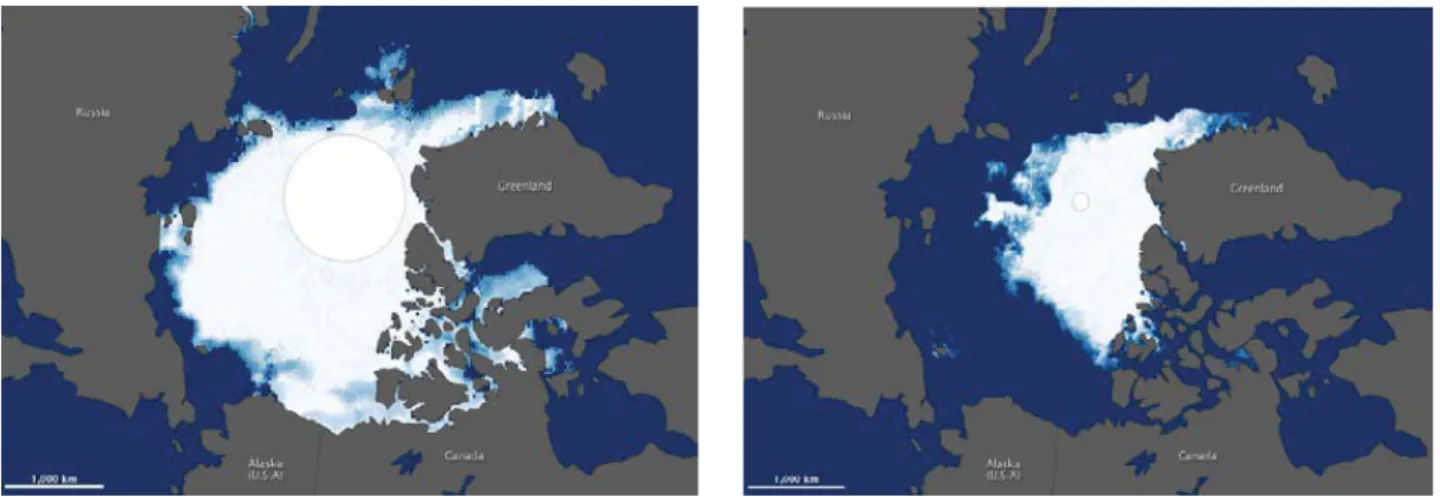
The Arctic is a vulnerable region and is affected by the global war-ming which is causing the sea ice to melt. It is the extent of the summer ice in particular which is shrinking. Photographs of the summer ice taken at 20-year intervals show a substan-tial reduction in the ice cover.
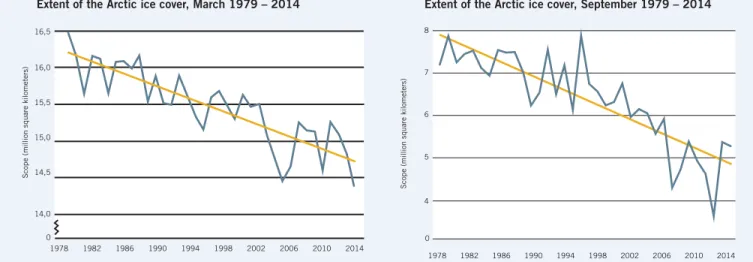
Since 1979, the extent of the sum-mer ice has decreased by about 40 percent; the ice has also continually become both thinner and younger. However, the extent of the winter ice has only decreased by about 8 percent. Figure 2 shows the reduc-tions in the winter ice (March) and
summer ice (September) respectively during the period 1979 – 2014.
FUTURE EXPLOITATION A THREAT
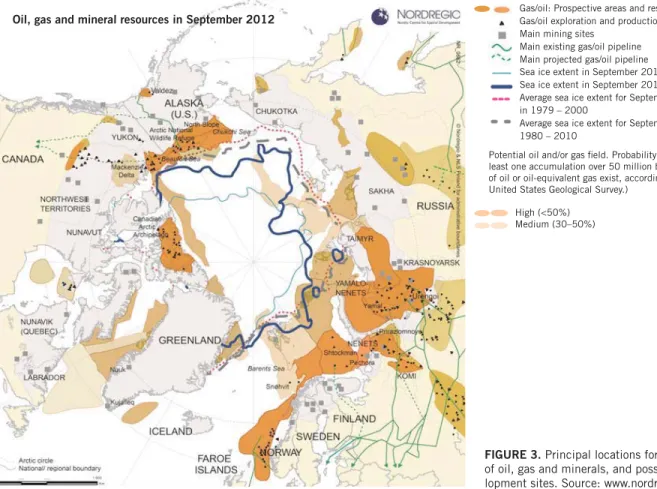
A high proportion of the world’s oil and natural gas resources can be found in the Arctic region. Ten percent of the world’s oil production and 25 percent of global natural gas production already take place in the region. The majority is extracted from coastal areas in Russia and Alaska (see map). Locations far from the coast have been difficult to reach, as the sea ice not only prevents trans-port but is also hazardous for vessels
which are carrying oil. Floating ice and ice bergs can cause substantial damage. The shrinking ice cover in the Arctic in recent years has opened up new shipping channels, making it possible to discover previously unexplored natural resources.
Together with improved techno-logy for oil extraction, this opens up new opportunities for explorers, and many oil companies are planning to expand their operations in the Arctic over the coming years. However, fal-ling oil prices mean that the situation is uncertain at present and many oil companies are therefore awaiting
Accessibility and pressure
increasing in the Arctic
FIGURE 1. Extent of the ice in September 1984 compared with September 2014. Source: Smith & Stephenson, New Trans-Arctic
FIGURE 2. Reduction in the ice cover during the period 1979 – 2014 for March and September. Source: nsidc.org/arcticseaicenews.
PHOTOGRAPH: MARK MARISSINK
Extent of the Arctic ice cover, March 1979 – 2014 Extent of the Arctic ice cover, September 1979 – 2014
14,5 15,0 15,5 16,0 16,5 14,0 1978 1982 1986 1990 1994 1998 2002 2006 2010 2014
Scope (million square kilometers)
0 4 5 6 7 8 1978 1982 1986 1990 1994 1998 2002 2006 2010 2014
Scope (million square kilometers)
0
further developments before acting. It is also clear that more oil extraction in sensitive Arctic ronments will have a major envi-ronmental impact on the oceans, the land and the air. There are also risks associated with oil spills which could have catastrophic consequences, as oil degrades much more slowly in the low temperatures and clean-up operations are hampered by the harsh climate.
TEMPTING MINERAL RICHES
The Arctic is also very rich in mine-rals and sees the extraction of 40 percent of the world’s palladium, 25 percent of the world’s diamonds, 15 percent of the world’s platinum and 10 percent of the world’s apatite and tungsten. There is also a lot of zinc, lead and chromium. Mineral extraction has become much easier because of the shrinking of the sea ice. It has also become both easier
and cheaper to transport the minerals to market, which could encourage further mineral extraction.
It is not just because of develop-ments within oil and mineral extraction that shipping in the Arctic has increased; tourism is also genera-ting more shipping. There are strong driving forces in the region for the expansion of shipping in the waters which now remain navigable over a longer season.
NEW SHIPPING CHANNELS A REALITY
There are now two possible shipping channels in the Arctic, one via the Northeast Passage, which extends past Norway, Russia and Alaska, and one via the Northwest Passage, ex-tends past Canada and Alaska. There is also interest in sailing directly over the North Pole, via the central Arctic Ocean route, in the future. The Northeast Passage is the most
attrac-tive route for shipping today, partly because of better ice conditions and the infrastructure left behind after the Soviet period, which includes nuclear-powered ice breakers.
The Northwest Passage has more problems with ice and inferior in-frastructure for shipping, and there is also no clear political view as to how the passage should be developed.
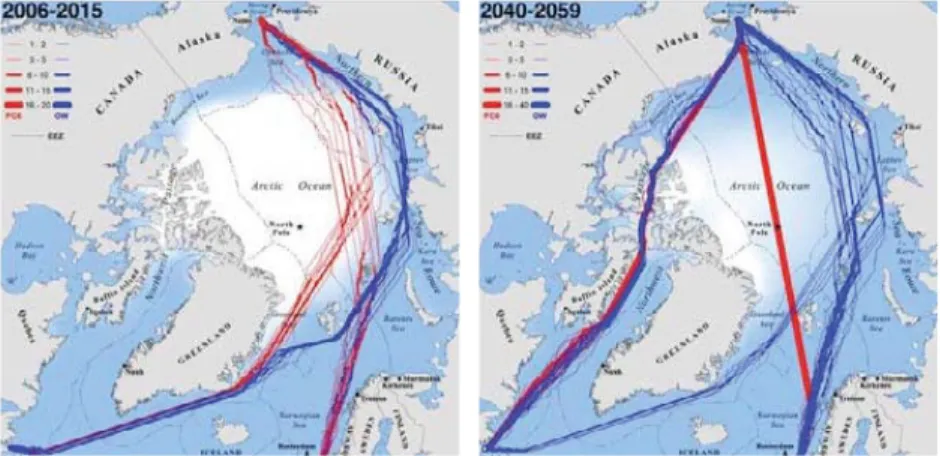
Based on the estimated rate of shrinking of the summer ice, both the Northwest Passage and the route over the North Pole will be navigable by the middle of this century. The maps show current shipping channels and the channels which are expected to be navigable by the middle of the 21st century.
GREENHOUSE GAS EMISSIONS SET TO RISE
As mentioned previously, the in-crease in oil and mineral extraction and more shipping in the Arctic are
FIGURE 3. Principal locations for extraction
of oil, gas and minerals, and possible deve-lopment sites. Source: www.nordregio.se
Oil, gas and mineral resources in September 2012
Potential oil and/or gas field. Probability that at least one accumulation over 50 million barrels of oil or oil-equivalent gas exist, according to the United States Geological Survey.)
High (<50%) Medium (30–50%)
Sea ice extent in September 2012 Sea ice extent in September 2014 Average sea ice extent for September in 1979 – 2000
Average sea ice extent for September 1980 – 2010
Gas/oil: Prospective areas and reserves Gas/oil exploration and production Main mining sites
Main existing gas/oil pipeline Main projected gas/oil pipeline
PHOTOGRAPH: SHUTTERSTOCK
having an adverse impact on the atmosphere in both the Arctic and elsewhere. Increases in the produc-tion and use of many hydrocarbon resources, such as oil and natural gas, is giving rise to more emissions of greenhouse gases and making it harder to achieve the so-called ‘2°C target’. This target is based on the EU’s common climate policy and means that global warming will be limited to less than 2°C compared with the pre-industrial age. Since 2010, the 2°C target has been a globally agreed target. If global emis-sions start to fall by no later than 2020, the 2°C target can be achieved by 2050, but a high proportion of the world’s fossil hydrocarbon resources will then have to be left unutilised.
THE ARCTIC ATMOSPHERE IS POLLUTED
During drilling for oil, gas is often released up through the borehole and, as such drilling often takes pla-ce far from a location where the gas could be used as fuel, it is combusted directly on-site instead. This process is called ‘gas flaring’ and gives rise to substantial emissions of air pol-lutants, such as carbon dioxide, soot and sometimes unburned methane.
Shipping traffic is also a source of pollutants. Exhaust gas emissions from vessels contain a wide variety of
gases and particulate matter, which in their original form and through reactions with other substances can affect the quality of the air, and in turn both the environment and hu-man health, in hu-many different ways.
Carbon dioxide, nitrous oxide and methane are some of the green-house gases discharged during gas flaring and by shipping. Sulphur and nitrogen oxides, which are dischar-ged by shipping in particular, form particulate matter which affects cloud formation, a phenomenon that is known to contribute to the
climate changes occurring in the Arctic atmosphere. When soot (black particulate carbon) from gas flaring and exhaust fumes from vessels are deposited on the snow, they absorb more sunlight than the clean snow, so accelerating the melting process. Carbon dioxide, a long-lived green-house gas, allow the sun’s shortwave rays to pass through, but absorbs the longwave rays. This has a strong warming effect on the atmosphere, and carbon dioxide also contributes to ocean acidification (Read more on pages 10 and 49).
ENVIRONMENTAL POLLUTANTS ARE TRANSPORTED A LONG WAY
The Arctic region is already exposed to many organic environmental pol-lutants and heavy metals, particular-ly mercury. These pollutants largeparticular-ly originate from the industrialised world and have reached the Arctic via long-distance transport. In the Russian part of the Arctic, there are also local industries and landfill sites which are possible sources. Many environmental pollutants are bioac-cumulated in marine food webs and can reach high concentrations in
FIGURE 4. Shipping channels today compared with probable shipping channels in the
mid-21st century. Source: Smith & Stephenson, New Trans-Arctic shipping routes naviga-ble by midcentury, 2013.
larger fish and marine mammals. The latter are important food sources for the population in the Arctic.
The risks of exposure and health effects are therefore often higher for the population in the Arctic than in the Nordic region for example, despite the greater distance from the emission sources. (Read more about mercury and environmental pol-lutants in the Arctic in the articles on pages 36 and 46).
Climate change can itself affect the transport of environmental pollutants to the Arctic and the way in which they are distributed between different parts of the ecosystems, but for many substances, changes in the emissions themselves are a more important fac-tor than climate change. Melting sea ice and glaciers and thawing perma-frost can however release environmen-tal pollutants. This can lead to further exposure for the marine ecosystems and ultimately humans.
With the greater exploitation of the Arctic, it is likely that the dispersal patterns of environmental pollutants will change and that new local sour-ces will arise.
CHALLENGES
There is much evidence to suggest that oil and mineral extraction in the Arctic will increase. There are also arguments against such development. The international efforts being made
to reduce greenhouse gas emissions are one, the high cost in terms of capital and energy is another, as is the harsh climate. The increased exploitation of the Arctic’s natural resources entails substantial risks for the environment.
Exactly how and to what extent the environment will be affected is difficult to assess at present, as it is not known what effect the pollutants will have in such a cold climate. More research is needed within this area.
COLLABORATIONS TO PROTECT THE ARCTIC
The Arctic is a hot topic in the media, and many organisations are working to stop the exploitation of the Arctic’s resources. The Arctic Council is an international forum in which the eight Arctic countries (Denmark, Finland, Iceland, Norway, Sweden, Canada, Russia and the USA) are working together to ensure the sustainable development of the Arctic. This work is being carried out within four main areas: environ-ment and climate, plant and animal life, the oceans and the indigenous population. (Read more on page 54). In 2014, the IMO (International Maritime Organizationn) drew up the Polar Code for safer shipping in the waters surrounding the North and South Poles. It is also important to make the current oil production in
the Arctic regions safer in order to prevent accidents. The development of renewable energy and reduced demand for fossil fuels should also make oil extraction in the Arctic of less interest.
Karin Sjöberg, IVL Swedish
Environmental Research Institute karin.sjoberg@ivl.se
Malin Fredricsson, IVL Swedish
Environmental Research Institute malin.fredricsson@ivl.se
SUGGESTED READING:
AMAP, 2011. AMAP Assessment
2011: Mercury in the Arctic.
Arctic Monitoring and Assessment Programme (AMAP), Oslo, Norway. xiv + 193 pp.
AMAP, 2010. AMAP Assessment
2009: Persistent Organic Pollutants (POPs) in the Arctic. Science of the
Total Environment Special Issue. 408:2851-3051. Elsevier, 2010. Andrew, R., 2014. Socio-Economic
Drivers of Change in the Arctic.
AMAP Technical Report No. 9. 2014, Arctic Monitoring and Assessment Programme (AMAP), Oslo, Norway. Results of the project ArcRisk 2009 – 2013. www.arcrisk.eu/results/ Fact sheet: Developing Oil and Gas Resources in Arctic Waters: The Final Frontier?
Changes in Arctic Maritime Trans-port, Climate Change in the Arctic. www.arcticinfo.eu
earthobservatory.nasa.gov www.nordregio.se
US National Sea and Ice Data Centre. nsidc.org/arcticseaicenews
Ground-level ozone is a gas which can harm health, damage plants and cultural heritage
and affect the climate. Average concentrations of ground-level ozone in the Arctic are not
as high as they are further south, but peaks with high ozone concentration occur during
the spring. These peaks could become increasingly important if the climate changes
cause the growing season in the north to start earlier in the year.
Ground-level ozone
a growing problem in the Arctic?
FACTS: How ozone is formed
Ozone can be formed in a number of different ways in the troposphere and stratosphere. In the stratosphere, sunlight contains energy-rich UV radiation, which can split oxygen into two free oxygen atoms (O2 + UV-C ¬ 2O). The free oxygen atoms can react with oxygen and form ozone (O + O2
¬ O3), which leads to high concentra-tions of ozone in the stratosphere. When the sunlight reaches the troposphere, the most energy-rich component of the solar radiation is filtered out. Free oxygen atoms can alternatively be formed through less energy-rich UV radiation in sunlight splitting the air pollutant nitrogen dioxide into nitrogen monoxide and a free oxygen atom (NO2 + UV-A ¬ NO + O), which then forms ozone in the same way as in the stratosphere through joining with an oxygen molecule.
Ozone formation in the troposphere is strongly accelerated by other air pollutants, particularly volatile orga-nic pollutants and carbon monoxide.
Within environmental monito-ring, research and modelling, resear-chers have long been studying the occurrence of ground-level ozone. However, not as much attention has been directed at the Arctic and Subar-ctic regions and mountainous areas. However, in recent years, both mea-surements and modelling have shown that ground-level ozone can be an important problem in the north.
Concentrations of ground-level ozone in northern Scandinavia show a rising trend, rather than a decrea-sing one. Ozone concentrations in the air at ground level during the spring (March - May) are consis-tently higher in the north compared with southern Sweden (see Figure 1). In the far north, at Nikkaluokta and Palovare measuring stations, monthly mean concentrations are
around 100 μg/m3 (50 ppb) during
this period. To protect human health, the World Health Organization (WHO) has set a target according to which mean concentrations over a period of eight hours must not exceed 100 μg/m3.
In the future, high ozone concen-trations in the spring may also be of importance to vegetation, as the growing season in northern Sweden is starting earlier in the year due to the climate changes.
In isolated cases, ozone concen-trations in the north can be very high and even approach the levels where the EU Directive states that the general public must be informed, i.e. when the hourly mean concen-trations exceed 180 μg/m3. Figure 2
shows short periods with peak ozone concentrations, known as ‘ozone
episodes’. In May 2006, ozone concentrations in northern Sweden and Norway rose to around 160 ug/m3. At the time, the air with its
constituent ozone-forming substan-ces originated from large forest fires in Russia.
On this occasion, unusual leaf damage was found on bushes and trees in northern Sweden and Nor-way, probably as a result of the high ozone concentrations.
OZONE MODELS FOR
CONCENTRATIONS IN THE NORTH
Today’s large-scale atmospheric chemistry models simulate the varia-tion of ground-level ozone concen-trations in the Arctic with a maxi-mum during the spring. Model-based research has shown that the propor-tion of ground-level ozone in the
PHOTOGRAPH: MA
TS BJÖRKMAN
Latnjajaure in the mountains of Lapland, where measurements of ground-level ozone have been taken. The station is situated approximately 1000 m above sea level.
FIGURE 2. Ozone episodes in 2006 at
Esrange in northern Sweden just outside Kiruna, and at Tustervatn in central Norway between Trondheim and Narvik.
FIGURE 1. Monthly mean concentrations
of groundlevel ozone broken down between the months of the year, as mean values for the period 2004-2008. The values are shown for four sites in Norrbotten County (Nikkaluokta, Palovare, Myrberg and Esrange) and one site in Västerbotten County (Vindeln), and one site by the coast in Halland County (Råö).
Source: The Swedish throughfall moni-toring network for Nikkaluokta, Palovare and Myrberg. Other data from the national ozone monitoring programme.
FIGURE 3. Trajectory analysis for air
masses which swept in over Tustervatn in early May 2006. The trajectories, which show the path of the air masses through to a particular point, were calculated using NILU’s Flextra model.
The symbols show trajectories for air mas-ses and their altitude when they arrive at the location concerned.
The colours indicate the altitude while the air masses are being transported.
Ground-level ozone, mean concentrations 2004 – 2008
20 40 60 80 100 January July June May April March February September August NovemberDecember October Nikkaluokta Palovaara Myrberg Esrange Råö Vindeln μg/m 3 0
Ground-level ozone in northern Sweden and Norway
0 40 80 120 160 200 1 Jan 29 Aug 28 Oct 31 May 1 May 1 April 2 March
31 Jan 30 June 30 July 28 Sep 27 Nov 27 Dec
Tustervatn Esrange μg/m 3 Tustervatn 500 m 1000 m 1500 m 2 may 2006 kl. 18.00
Height during transport (m)
500 1500 2500 3500 4500 5500 6500 7500
VVOQ
Downy birch (Betula pubsecnes ssp.
czerepanovii) with ozone-damaged, red-
and brown-coloured leaves, Karasjok, Northern Norway, August 2006.
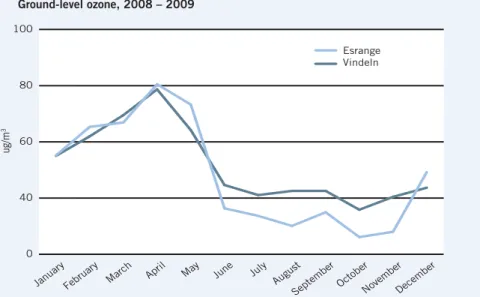
FIGURE 4. Simulated monthly mean concentrations of ozone at Esrange outside Kiruna
and Vindeln in the Umeå area, as mean values for the period 2008 – 2009. Source: Data from simulations described in Monks et al. 2014.
Ground-level ozone, 2008 – 2009 0 40 60 80 100 Esrange Vindeln January July June May April March February September August NovemberDecember October ug/m 3
FACTS: Ground-level ozone
The ozone that exists in the air layers closest to the ground is called ‘ground-level ozone’ and should not be confused with the protective ozone layer up in the stratosphere.
The concentration of ground-level ozone at a particular location depends on a number of factors. The chemical formation of the ozone is of course of decisive importance, as are the pro-cesses which consume ozone which is deposited on the Earth’s surface as atmospheric deposition. For example, snow, ice and water surfaces absorb considerably less ozone than vegeta-tion, which absorbs large quantities, particularly during the growing season in the spring and summer.
The horizontal transport of air containing high or low concentrations of ozone and ozone-forming substan-ces, over the Earth’s surface is also of major importance. This type of transport can take place over great distances.
Arctic which is transported from the stratosphere is highest in the spring, sometimes up to 10 percent, whereas the contribution during the summer is small. In the stratosphere (the layer of air above the troposphere, see page 7), ozone concentrations are very high, but the air masses of the tro-posphere and stratosphere do not mix with each other to any great extent.
In 2014, the Swedish Meteoro-logical and HydroMeteoro-logical Institute (SMHI) presented simulations of the northern hemisphere carried out using the MATCH model. The monthly mean values of ozone from the simulations for the stations at Esrange outside Kiruna and Vindeln near Umeå are shown in Figure 4. The simulations show a seasonal variation which corresponds with the measured concentrations i Figure 1, although the concentrations ac-cording to the model are generally somewhat lower. Our current under-standing of how the ozone is formed and transported can to some extent explain how ozone concentrations in some parts of the Arctic vary during
the year. Further model experiments are needed to establish in more detail which processes govern the seaso-nal variation and the high ozone concentrations during the spring in northern Sweden.
However, the primary cause of the high ozone concentrations during the spring in northern Sweden and in the European part of the Arctic is the activation by sunlight of ozone-forming substances, particularly per-oxyacyl nitrate (PAN), nitric acid and carbon monoxide, which build up over the winter. This process, combi-ned with low deposition on surfaces covered by snow and ice and some transport of ozone-rich air from the stratosphere, is causing atmospheric concentrations of ozone to rise
A BETTER UNDERSTANDING IS NEEDED
Deposition has very little effect on the air high up in the troposphere, as the distance to the ground is so great. Other factors can also affect the amount of ozone that is available in the air at high altitude,
but ozone concentrations at high altitude appear to be higher compared with those at ground level globally. In addition, our understanding of the ozone load at high altitude in moun-tainous areas and other upland areas at northerly latitudes remains poor. High ozone concentrations 24-hours a day, combined with long, light nights, enables virtually continuous ozone uptake and affects the life pro-cesses of plants during the summer.
Ozone-forming substances can also be transported very long distan-ces by winds. While ozone-forming substances in the northern hemisphe-re, including emissions from industry and traffic in southern and central Europe and from major fires such as in Russia, continue to be emitted, the high ozone load in the north will continue. Any future increase in ship-ping through the Northeast Passage will also result in an increase in
PHOTOGRAPH: HANS TÖMMER
VIK/ NINA TROMSÖ
Ground-level ozone (O3) is inhaled by humans and can be taken up by the leaves and needles of plants. Ozone uptake in leaves inhibits photosynthesis and causes premature ageing of leaves, needles and maturing seeds. This can cause substantial harvest losses within agriculture and reduce timber production in the forestry sector.
Respiratory problems caused by ground-level ozone and other effects amongst humans annually result in a large number of hospital admissions and even premature deaths. The strong oxidative capacity of ozone also contributes to the weathering of house façades and stone and concrete statues, for example. It can be both difficult and expensive to restore this cultural heritage.
“Ozone uptake in leaves
inhibits photosynthesis”
SUGGESTED READING:
Karlsson, P.E., Tang, L., Sundberg, J., Chen, D., Lindskog, A. and Pleijel, H. 2007. Increasing risk for negative
ozo-ne impacts on vegetation in northern Sweden. Environmental Pollution
150, 96-106.
Karlsson, P.E., Ferm, M., Tømmervik, H., Hole, L.R., Pihl Karlsson, P., Truoho-Airola, T., Aas, W., Hellsten, S., Akselsson, C., Nørgaard Mikkelsen, T. and Nihlgård, B. 2013. Biomass
burning in Eastern Europe during spring 2006 caused high deposition of ammonium in northern Fennos-candia. Environmental Pollution 176,
71 – 79.
Klingberg, J. Björkman, M., Pihl Karlsson, G. and Pleijel, H. 2009.
Observations of ground-level ozone
and NO2 in northernmost Sweden,
including the Scandian Mountain Range. Ambio 38, 448-451.
Lindskog, A., Karlsson, P.E., Grenn-felt, P., Solberg, S., Forster, C. 2007.
An exceptional ozone episode in northern Fennoscandia. Atmospheric
Environment 41, 950-958.
Monks, S. A., Arnold, S. R., Emmons, L. K., Law, K. S., Turquety, S., Dun-can, B. N., Flemming, J., Huijnen, V., Tilmes, S., Langner, J., Mao, J., Long, Y., Thomas, J. L., Steenrod, S. D., Raut, J. C., Wilson, C., Chipperfield, M. P., Diskin, G. S., Weinheimer, A., Schlager, H., and Ancellet, G.:
Multi-model study of chemical and physical controls on transport of anthropogenic and biomass burning pollution to the Arctic, Atmos. Chem. Phys. 15,
3575-3603, doi:10.5194/acp-15-3575-2015, 2015.
About trajectory analysis:
www.nilu.no/projects/ccc/trajectories
emissions of ozone-forming substan-ces, which could worsen the situation.
One serious deficiency is that we currently know little about ozone load levels in mountainous areas. Measurements taken at Latnjajaure field station at around 1000 met-res above sea level and elsewhere indicate that such levels may be considerably higher there than at Esrange outside Kiruna, for example. Our understanding of the large-scale atmospheric chemistry in the Arctic is also limited by a lack of regular mea-surements of ozone and ozone-for-ming substances in the Russian part of the Arctic and at high altitudes in the atmosphere.
There are many interesting re-search issues concerning ground- level ozone and the specific condi-tions which prevail in the Arctic. Some of the questions we hope to be able to answer over the next few
years are: how will the high ozone concentrations in the spring increa-singly impact on plants as the green-house effect increases in intensity? How high are the ozone concentra-tions at high altitude, e.g. in moun-tainous areas? What trends are there with regard to moderate and high ozone concentrations in the north and how can we explain any trends? The answers to these questions can provide us with a considerably better understanding of the nature of envi-ronmental risks such as ground-level ozone in the Arctic.
Per Erik Karlsson, IVL Swedish
Environmental Research Institute pererik.karlsson@ivl.se
Joakim Langner, Swedish Meteorological
and Hydrological Institute (SMHI) joakim.langner@smhi.se
Håkan Pleijel, Gothenburg University
hakan.pleijel@bioenv.gu.se
PHOTOGRAPH: PH O T OGR R R R R RRR R R R RARRA R RRRA RA A AAA A A A AAA A AAAAAA A A P P PPP PH: P P PH PH: PPPH: PH: H H:H :
Methane can be released from Arctic permafrost layers
on land and in bottom sediments. Our understanding of
how methane and carbon dioxide behave and interact in
the Arctic is limited, but progress is particularly being
made as regards our understanding of the many different
sources of methane.
Methane in the Arctic
FACTS: Methane and methane emissions
Methane (CH4) is a colour- and odour-less gas consisting of carbon and hydrogen, which reaches the at-mosphere from a wide variety of sour-ces and then disappears, primarily through various chemical reactions. Around 90 percent of the methane reacts with the hydroxy radical in the troposphere. As the residence time of methane in the troposphere is almost ten years, the gas is relatively well-mixed in this layer of the atmosphere.
Methane emissions can be classi-fied on the basis of different sources: biogenic, thermogenic and pyrogenic.
Biogenic methane is produced by
bacteria through the degradation of organic matter in environments with a low oxygen concentration, such as wetlands, landfill sites, rice fields and cattle farms.
Thermogenic methane is formed
geologically, deep in the Earth’s crust where organic matter under high pressure and temperature forms fossil reservoirs, e.g. natural gas, oil and carbon pools. These fossil fuels can then reach the atmosphere both via natural leakage or through deliberate extraction by industry, as well as through refining and transport.
Pyrogenic methane is formed through
incomplete combustion, e.g. in con-nection with tundra fires.
In turn, all these three sources can be divided into natural and anthropo-genic sources. The sum of all natural sources and the sum of all anthro-pogenic sources are estimated to be approximately equal. However, this estimate is associated with conside-rably uncertainty, particularly with regard to natural emissions. Thawing permafrost tens of thousands
of years old is being released along the northeastern Siberian coast.
The highest mean concentrations anywhere in the atmosphere occur directly over the Arctic (see Figure 1). This is the result of the way in which the atmosphere is layered and local sources. Global methane concentra-tions in the atmosphere have more than doubled since the early 19th century, from 770 ppb to 1800 ppb, probably primarily because of emis-sions from human activity.
NATURAL METHANE EMISSIONS
Natural methane sources are pro-bably dominated by emissions from wetlands, but lakes, watercourses and bogs and geological sources, known as thermogenic methane, are also sources (see facts). The emissions which mankind gives rise to, either directly or indirectly, are dominated by emissions from cattle farming, landfill sites and incomplete combustion of fossil fuels.
Sources of methane in the Arctic and its proximity, e.g. Sweden, can be found on land, in the oceans and in society. In the land areas surrounding the Arctic, particularly in Russia and Canada, there are enormous wetlands where permafrost either partially or completely dominates the landscape. Many studies of methane have focussed on these
wetland systems and the uppermost layer of permafrost, which thaws every summer. These studies have in-cluded laboratory experiments, field experiments, flow measurements and long-term measurements from high towers known as “footprints”, where it is possible to consider methane flows over large areas. These studies have resulted in real progress being
made in our understanding of how methane behaves in wet tundra, dry tundra and lakes. However, it would be difficult to take similar large-scale measurements in the Arctic in order to predict future emissions from these systems.
Emissions of methane from marine sources in the Arctic occur from the permafrost on the seabed in the large shallow seas of eastern Siberia. This permafrost was originally situated on land, but was flooded when glaciers melted and sea levels rose at the end of the ice age. These shallow seas contain almost 80 percent of the permafrost that exists on the seabed globally. Within and beneath these permafrost layers, gas hydrates, a type of frozen water-methane com-plex, and natural gas are also stored. Along the continental margins of the Arctic Ocean, there are also large quantities of methane in ordinary marine gas hydrates. Over a period of many years, measurements taken by research vessels during summer
FIGURE 1. Increase in global methane concentrations during the period 2000 – 2010.
The further north on the globe one goes (increasing northerly latitudes), the higher the methane concentrations and the greater the increase over time.
Beaufort Sea
Barents Sea Kara Sea Presumed areas with gas hydrates
Ice/ocean/land Permafrost Full cover Partial cover Sporadic Individual areas Arctic Ocean East Siberian Sea Laptev Sea
The Zeppelin research station on Svalbard. A major international collaboration concerning atmospheric monitoring is taking place here.
expeditions have revealed extremely elevated concentrations of methane in the seawater and in the air above the Arctic Ocean of eastern Siberia. Like emissions on land, these marine emis-sions are also difficult to quantify.
METHANE EMISSIONS CAUSED BY HUMANS
It is difficult to determine the mag-nitude of methane emissions from individual sources or areas using measurements of concentrations in the air. This is partly because the gas mixes rapidly in the atmosphere and partly because the measurements, particularly those taken in the Arctic, are usually taken a long way from the emission areas.
The International Institute of Applied Systems Analysis (IIASA) has prepared a scenario for future anthropogenic methane emissions. The study, which was based on assumptions concerning how much methane is released by different sec-tors, indicates that global emissions will rise over the coming decades. Major contributions are especially expected from coal production in China and shale gas extraction in North America. Technologies and
methods are now available which can limit and recycle methane emis-sions from sources such as oil pro-duction, gas production and leaking gas pipes, as well as from biodegra-dable waste. The eight member countries in the Arctic Council account for around a fifth of global methane emissions. It would be reasonable to expect these countries to aim to reduce methane emissions as much as possible in connection with current and future oil and gas extraction in the Arctic.
LONG-TERM STUDIES AND MEASUREMENTS OF METHANE IN THE ARCTIC
Measurements of methane and car-bon dioxide in the actual atmosphe-re, as well as on land and at sea, are vital in improving our understan-ding of sources, effects, long-term trends and impacts on the Arctic climate. Measurements of methane and carbon dioxide are being taken continually at three stations on Svalbard, and in Alaska and Canada. Sweden contributes indirectly to the measurements on Svalbard via the international collaboration in which the EPA is a participant. A measuring
station has recently been established in northeastern Siberia (Tiksi). This station will soon start contributing the first series of measurements from a region which previously had few land-based observations. Continual measurements are also being taken in Finnish Lapland and at a number of other stations situated around the Arctic Circle. These measurements have shown that since 2007 methane concentrations in the Arctic have risen at approximately the same rate as global methane concentrations.
During the winter, the stations in the Arctic are affected by methane transport from sources at more southerly latitudes. In the summer, methane concentrations vary conside-rably over the course of the day, and maximum methane concentrations tend to occur in the late summer and early autumn. The reason for this trend is unclear. It may be due to emissions from either wetlands or the shallow seas of eastern Siberia.
Various isotopes of methane may be able to tell us more about the sources that it originates from. The first studies of methane occurrences in the Arctic were conducted on Svalbard in 2011, but more