Full Terms & Conditions of access and use can be found at
http://www.tandfonline.com/action/journalInformation?journalCode=sehr20
ISSN: 0358-5522 (Print) 1750-2837 (Online) Journal homepage: http://www.tandfonline.com/loi/sehr20
Getting a job when times are bad: recruitment
practices in Sweden before, during and after the
Great Recession
Peter Håkansson & Anders Nilsson
To cite this article: Peter Håkansson & Anders Nilsson (2018): Getting a job when times are bad: recruitment practices in Sweden before, during and after the Great Recession, Scandinavian Economic History Review, DOI: 10.1080/03585522.2018.1543729
To link to this article: https://doi.org/10.1080/03585522.2018.1543729
© 2018 The Author(s). Published by Informa UK Limited, trading as Taylor & Francis Group
View supplementary material
Published online: 22 Nov 2018.
Submit your article to this journal
Article views: 161
Getting a job when times are bad: recruitment practices in Sweden
before, during and after the Great Recession
Peter Håkanssonaand Anders Nilssonb
a
Department of Urban Studies, Malmö University, Malmö, Sweden;bDepartment of Economic History, Lund University, Lund, Sweden
ABSTRACT
Research on recruitment shows that networks matter and are effective as search channels. The aim of this article is to analyse how recruitment practices varies over time, and specifically, how it has varied before, during, and after the Great Recession 2008–2009. The findings are that recruitment practices change both in the short term, in relation to labour supply, which we can call a cyclical effect, but also in accordance to a long-term, structural effects. Informal recruitment practices, such as recruitment through ‘friends and acquaintances’ and ‘employer made contact’, seem to increase during bad times. In the long run, the recruitment practices‘direct application’, ‘friends and acquaintances’ and ‘formal private’ increase in relation to recruitment through the Swedish Public Employment Agency (SPEA). A reason for this may be that the labour market in the new knowledge economy demands a heterogenic workforce with high demands on non-cognitive skills and customisation. Here the new network recruitment practices seem tofit in.
ARTICLE HISTORY
Received 27 March 2017 Accepted 28 October 2018
KEYWORDS
Network recruitment; recruitment practice; social capital; social network; unemployment; Great Recession
JEL CODES
N34; M51; J64; Z13
1. Introduction
The labour market changed dramatically in the 1990s. The deep economic andfinancial crises at the onset of the decade caused unemployment to increase rapidly in most OECD countries. To some extent, the consequences were similar to the reactions to the crises in the 1970s, which have been interpreted as a game-changer in the development of the welfare state, not least in the Nordic countries (Esping-Andersen,1990; Lindert,2004). These countries, however, were affected very differently by the early 1990s crisis. Finland in particular but also Sweden were severely hit (Jonung, Tson Söderström, & Stymme,1996), whereas the effects in Denmark and Norway were much less drastic (Goul Andersen, 2011; Steigum,2003). The differences were reflected in the labour market, in particular for young people. Despite the subsequent and considerable economic growth from the mid-1990s to the 2008 crisis, most countries are still struggling with persistent high unemployment, particularly‘vulnerable groups’, i.e. young people, people with low education and, in most countries, foreign-born (OECD,2006,2012). In general, these groups have been characterised by low skills in relation to labour market demand. Although various programmes have been launched to address the problems of these‘vulnerable groups’, they have had limited success in general (Engdahl & Forslund,2016). Consequently, there have been calls for new perspectives on unemployment. It is only recently that the connection between recruitment
© 2018 The Author(s). Published by Informa UK Limited, trading as Taylor & Francis Group
This is an Open Access article distributed under the terms of the Creative Commons Attribution-NonCommercial-NoDerivatives License (http:// creativecommons.org/licenses/by-nc-nd/4.0/), which permits non-commercial re-use, distribution, and reproduction in any medium, provided the original work is properly cited, and is not altered, transformed, or built upon in any way.
CONTACT Peter Håkansson peter.hakansson@mau.se Department of Urban Studies, Malmö University, 205 06 Malmö, Sweden
and unemployment has been acknowledged (see, for example, Hällsten, Edling, & Rydgren,2017). How-ever, there is fairly little research to describe if and why recruitment practices can vary over time. In Håkansson and Tovatt (2017), this question is analysed from a long-term perspective, using qualitative methods in the form of working-life narratives. The results from that study indicate that changes occur in response to structural changes in the economy. Using quantitative data, the present article aims to analyse how recruitment practices vary over time. We analyse the effect of a macro-economic shock – the Great Recession – on possible changes in recruitment practices against the backdrop of changes that could be inferred from the previous crises in the early 1990s.
In the empirical analysis, we use data from the Swedish Public Employment Administration (SPEA) [Arbetsförmedlingen]. This unique data gives information about all the different kinds of recruitment practices, and it concerns people age 18–64, i.e. a wider range both when it comes to recruitment prac-tices and respondents than with previous studies (see, for example, Hensvik, Müller, & Nordström Skans,2017). The period covers 2006–2013, which makes it possible to analyse how the use of different recruitment practices has changed over time and, specifically, how it has varied over the Great Reces-sion 2008–2009. Because this period covers a time span both before and after the recession, it is thus interesting from different perspectives. Not only does it cover a full business cycle, but it also captures the effects of on-going structural change. This allows the possibility to ask two central research ques-tions: (1) Do recruitment practices vary cyclically and have they varied over the last business cycle? (2) Can changes in recruitment practices be related to structural change, i.e. change in the long term?
The data contain some obvious limitations: they cover only a short period (2006–2013). However, the data are discussed in a longer time perspective by taking into account the economic and labour market development in Sweden in a Nordic context since the early 1990s. Another limitation is that the data do not contain any employer information. Further, as will be described later, Sweden may be an extreme case with its history of having a highly active Public Employment Administration (SPEA) and a centralised employment policy. We see this as an advantage as we can study network recruit-ment in a society where this behaviour would be expected to be marginal.
2. Theoretical framework
Recruitment practices, i.e. how jobseekers and vacancies are matched, can be formal (information from SPEA, internet and newspaper advertisements, and private employment services) or informal (networks and contacts). However, this is a dichotomisation, and as with all dichotomisations, a sim-plification. In reality, formal and informal recruitment intertwine.
In addition, there are differences between the various forms of informal recruitment practices; for example, a substantial difference remains between an applicant being contacted by the employer and an applicantfinding out about a job through family and friends. The former is about being known, while the latter is about knowing someone. One could also claim that the former concerns being selected and having access, while the latter concerns information dissemination.
A third form of recruitment practice that can be defined as informal is when the jobseeker applies directly to the employer even though no vacancies are available; although some kind of network information may be involved, it is not necessary. In this case, a network recruitment practice cannot be ruled out, but neither can it be confirmed.
Formal recruitment practices can be divided into formal recruitment practices under SPEA and private recruitment practices. Formal recruitment under SPEA is government-sponsored job match-ing through a government agency, whereas the other is employer-controlled recruitment channels (advertising and the use of private employment agencies). Conclusively, recruitment practices in this article will be divided intofive categories: formal (SPEA), formal (private), employer made con-tact, information through friends and acquaintances, and lastly, direct application by the jobseeker. The role of social networks in the recruitment process has been examined in many studies. One early study was conducted by Albert Rees (1966), who asserts that the informal networks have much to offer because they reduce risk and offer information at low cost. Mark Granovetter (1974)
explored this further in his epic book Getting a Job. According to him,‘ … personal contacts are of paramount importance in connecting people with jobs’ (Granovetter,1974, p. 22). He studied pro-fessional, technical and managerial workers (PTM workers) and then interviewed them about their search methods and how they obtained their jobs. He divided these methods into‘formal means’, ‘personal contacts’, ‘direct application’ and ‘other’. The most common method was ‘personal con-tacts’ (56 percent), which was more than twice as common as ‘formal means’, and ‘direct application’ (around 19 percent, respectively).
The role of networks has been increasingly acknowledged in current research (Calvó-Armengol & Jackson, 2004; Calvó-Armengol & Zenou, 2005; Hällsten et al.,2017; Håkansson, 2011; Hensvik et al., 2017; Hensvik & Nordström Skans,2013; Korpi,2001; Kramarz & Nordström Skans,2014; Tovatt,2013; Wennberg, Lindberg, & Fergin,2013). In search theory, the channels of the jobseekers and the effectiveness of these channels are of interest. Already in1988, Holzer had shown that the most effective search method was to use the informal search method of friends and family, both in terms of outcome (number of job offers) and search time (Holzer,1988). Search theory identifies informal networks as an important source of information, and therefore a rational recruitment prac-tice. These theories suggest that employers should prefer to use informal networks, if given the choice. The networks carry information. If employers can use this information, they do not have to pay the full market value (Montgomery,1991).
In later years, many studies within search theory have investigated informal search channels (see, for example, Battu, Seaman, & Zenou,2011; Bentolila, Michelacci, & Suarez, 2010; Bramoullé & Saint-Paul,2010; Calvó-Armengol & Jackson,2004; Calvó-Armengol & Zenou,2005). A common result from these studies is that informal recruitment practise is a commonly-used, efficient search channel. For example, information access plays an important role in the Diamond-Mortensen-Pis-sarides model (Mortensen & PisDiamond-Mortensen-Pis-sarides,1994). Though imperfect information influences the location of new job opportunities, job-seekers’ and employers’ access to good information is likely to bring down aggregate unemployment by shortening periods of unemployment (see, for example, Andol-fatto, 2008). Calvó-Armengol and Jackson (2004) developed a model where agents obtain infor-mation about job opportunities through a network of social contacts. They conclude that without employment, the access to useful networks decreases. Conclusively, the probability of obtaining a job decreases with the length of time that a person has been unemployed.
Another theoretical approach often used in discussions on the advantages of networks, is the one suggested by Robert |Putnam (1993,2000). In short, Putnam suggests that people engaging in associ-ations or socialising in networks create trust. When people meet, they learn how to trust each other. It is especially important to meet across class, ethnicity and age because meeting people across bar-riers creates bridging social capital (in contrast to bonding social capital when people socialise with people they know well and are alike). This means that people who are active in networks not only trust others, they are also more trustworthy.1 However, this perspective is not fully useful here, because we want to study network recruitment (recruitment practices) and not the possibility to become recruited because of intensive networking.
The aim of this paper is to analyse how recruitment practices change over time. The economic historian Ylva Hasselberg (2009) has discussed that process in terms of long-term change, which clo-sely relates to economic structural change and a change in norms. Hasselberg describes the transition from a pre-modern to a modern society as partly due to institutionalisation: an increasing number of institutions came to answer for issues settled previously by personal networks. In thefinancial mar-kets, credit laws and modern banking replaced personal networks used to obtain credit. In the labour market, the Public Employment Agency, formal education and collective agreements gained impor-tance and replaced informal measures and a laissez-faire labour market (Lundh,2010).
In late modern society, personal social networks have once again increased in importance due to the new information society and the major changes that ICT and social media have brought about.
1
Personal networks are easily kept and maintained with the help of social media and the Internet, according to Hasselberg.
If we use this perspective on recruitment practices– and if we recall Holzer’s and other search theorists’ findings about efficiency in the search channels – we may conclude that in the long run, technical change and innovation have improved the efficiency in using networks, i.e. with ICT it is easier and cheaper to uphold a network (see Håkansson & Tovatt,2017). However, the question remains if this could be estimated also in the short run, i.e. over the business cycle?
In the recruitment of labour, we may identify two types of costs: informational costs (search costs) and risk. Informal channels carry superior private information that may be otherwise difficult to measure, and they offer it at a low cost. This suggests that firms may rely more on information from informal channels when workers have fewer possibilities tofind other jobs. In a model devel-oped by Jovanovic (1979), workers choose between jobs that match their productivity. Since wages (and the possibility to increase one’s wages) reflect productivity, and workers risk being laid-off if their productivity does not match the expected level, there is an incentive for workers tofind jobs that match their productivity. Jovanovic’s model predicts that workers remain in jobs where their productivity is revealed as relatively high and that they select themselves out of jobs where their pro-ductivity is revealed as low. However, this self-selection becomes less effective when there is a lack of vacancies. In such cases, the employer has to spend more time gathering information about a job seeker, i.e. the risk is higher that a person without the right qualifications applies for the job.
Further, high unemployment will increase competition for each vacancy, which changes power relations in favour of the employers, and employers prefer informal recruitment, as pointed out by search theorists (see, for example, Hensvik et al., 2017; Montgomery, 1991). Another side effect is that because more people are seeking jobs, there will be more candidates for each vacancy, which will, from the employer’s position, increase the costs of formal recruiting. By using informal recruiting, these costs could be lowered.
Conclusively, we can formulate two hypotheses: Thefirst hypothesis is that informal recruitment practices should increase over time, due to structural change. The second hypothesis is that informal recruitment practices should increase if competition increases, for example, in a recession or if com-petition increases for a specific kind of job or for specific groups.
3. Crisis and recovery – the Swedish economy and labour market 1990–2015 in a Nordic context
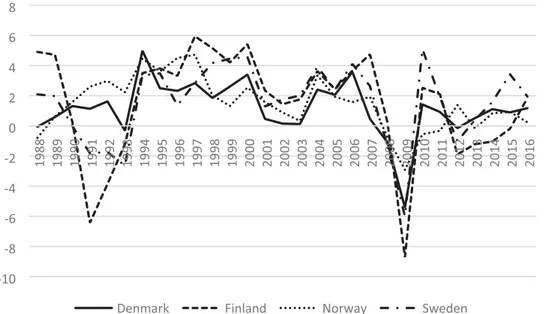
The early 1990s were characterised by an international economic crisis, but the effects varied sub-stantially in the different Nordic countries (seeFigure 1). Sweden was, together with Finland, one of the most severely affected countries. Both countries had recently deregulated their financial mar-kets, which had led to over-valued asset prices that dropped dramatically. This contributed to a banking crisis with serious spin-off effects in the entire financial system (Jonung et al., 1996). Both countries had further protected their labour markets through repeated devaluations of their currencies in the 1970s and 1980s, with the consequence that they both had a large low-productivity industrial sector. Finland’s situation was further aggravated by the implosion of the Soviet Union and the country lost a part of its foreign trade almost overnight (Magnusson,2016). Denmark and Nor-way were much less affected by the international crisis (seeFigure 1). Norway, too, experienced a banking crisis but its economic downturn was quite mild, due to stronger macroeconomic perform-ance and a large increase in oil production after 1989 (Steigum,2003). Denmark came‘in between’, with slow (but positive) economic growth and a– by Danish standards – fairly high unemployment rate that reached a historic high with 11.9 percent in 1993 (Goul Andersen,2011).
The consequences were drastic in many areas. Household disposable income stagnated or even fell (in Finland) and government debt as a percentage of GDP increased dramatically, with repercus-sions in several policy areas. In Sweden, welfare benefits became less generous, charges were raised for public services, and privatisation took place in parts of the public sector (Schön,2010). From the
perspective of this article, drastic changes took place also on the labour market. In contrast to most other industrialised countries, Sweden had managed to maintain low unemployment rates in the 1970s and 1980s. The crisis, however, implied that numerousfirms were forced to shut down. Fur-thermore, in enterprises that managed to survive, rationalisation with frequent lay-offs was intense. Rationalisation also occurred in the debt-ridden public sector. As a result, unemployment rates rose to levels unseen since the economic depression of the 1930s (seeFigure 2).
After the mid-1990s, the economy recovered quickly and strongly. Sweden’s export-oriented economy benefitted from strong international demand, helped by the low-valued Swedish currency. The country’s entry into the European Union in 1995 also contributed to increasing exports
Figure 1.Annual change in GDP per capita, 1988–2016. Source. World Bank National Accounts Data.
(Magnusson,2016). Another contributing factor was the severity of the crisis in the early 1990s, as it eradicated weak enterprises and made room for new possibilities (Schön,2010). Still, imbalances remained on the labour market. Even though unemployment rates diminished after 1997, they did not return to the previous low levels. In addition, the employment rate was much lower than before the crisis (Magnusson,2016). During the crisis, a large number of low skill jobs had disap-peared, and the skill requirements for the new jobs that were created were generally much higher (Åberg,2015). Finland’s development was similar but accentuated by the strong growth of the infor-mation and communications sector, largely thanks to the outstanding performance of Nokia. This contributed to high growth in labour productivity, driven by technological progress and a movement of individuals from lower-productivity firms and establishments towards high-productivity ones. However, far from all people that lost their low-productivity jobs were able tofind new ones (Var-tiainen,2011). In other words, a structural transformation similar to the Swedish one took place in Finland, with high rates of economic growth but also grave imbalances in the labour market.
In contrast, the imbalances in the labour market in Denmark were reduced after the 1990s crisis. The Danish economy prospered on a wide basis, stimulated by a diversified export boom and increasing oil revenues (Goul Andersen, 2011). In Norway, exploitation of the vast oil fields in the North Sea had provided a boost to the economy since the 1970s, but also exposed the country to overheating from easy access to capital. In 1990, a petroleum fund was set up to secure pensions as well as to shield the economy from the dangers of resource curse. Even so, the stimulus to the economy was profound and in Norway, as in Denmark, labour demand tended to surpass labour supply from the mid-1990s. As a result, the development in the labour market was beneficial in the two countries. In Norway, access to cheap migrant labour held back inflationary tendencies (Mjøset & Cappelen,2011). The situation in Denmark was further improved with the strengthening of theflexicurity system, where employees are easily dismissed in downturns (flexibility) but with a high level of unemployment benefits (security). That system was highly praised and promoted as an ideal also for other countries, but its reputation was shaken by the effects of the Great Recession, when unemployment increased sharply also in Denmark. In its aftermath, it has become evident that vulnerable groups (young people, foreign-borns, and unskilled workers) are poorly protected (Madsen Kongshøj,2013). This is shown by the development of youth unemployment in Denmark, which increased sharply in 2009 and 2010 (seeFigure 2).
Denmark was not, of course, the only Nordic country that suffered from the Great Recession. The period 2006–2013 was a turbulent period in the global economy, including a collapse in international trade (Eichengreen,2015). The Nordic countries are all export-dependent and Finland saw a large drop in output. In fact, the collapse in world trade hit the country harder than most other OECD countries. This could to a large extent be attributed to Finland’s high dependence on information and communication technology (ICT) and capital goods exports, and its exceptional exposure to hard-hit markets such as Russia. For Denmark, deteriorating exports was aggravated by losses in thefinancial sector as well as by the ending of a previous property boom. Nevertheless, Denmark entered the recession with a strong fiscal position (built up in previous years) which helped the country through the crisis (Lin, Edvinsson, Chen, & Beding, 2014). In Norway, oil investments played a stabilising role, supporting the economy when the industry was hit hard by a large decline in exports. In addition, the Norwegian government had largefinancial reserves in its petroleum fund, which allowed the government to introduce labour-intense stimulation packages. (Mjøset & Cappe-len,2011).
To sum up, the Nordic countries exhibit similarities as well as differences in their reaction to the crisis in the early 1990s and to the Great Recession. Finland and Sweden were hit hard in the early 1990s and one of the most noteworthy consequences was a sharp increase in unemployment, in par-ticular among young people. Furthermore, in both countries, it proved extremely difficult to press youth unemployment down to the previous low levels and that development was accentuated during and after the Great Recession. The effects of the early 1990s crisis in Denmark and Norway were less severe and the increase in youth unemployment was much less pronounced in these two countries.
Norway’s oil and Denmark’s flexicurity helped to keep unemployment low, but the effects of the Great Recession are clearly noticeable in Denmark. The country’s youth unemployment figures, although still well below the OECD average, has started to resemble those of Finland and Sweden. Even in Norway, youth unemployment has seldom been below 10 percent (seeFigure 2). Other vulnerable groups also have problems in the labour market and it seems safe to say that neither a much-admired labour market model (flexicurity) nor rich resources (oil) is a guarantee that the labour market works smoothly in the Nordic countries, certainly not during a crisis. That is a general experience. Other research has convincingly demonstrated that the Great Recession of 2008–2009 hit the labour market hard internationally, especially for young people (Bell & Blanchflower,2011). We, therefore, turn our attention to the focus of this article, Sweden, to see in more detail how vulnerable groups fared immediately before, during, and after the Great Recession.
As Figure 1shows, the Great Recession hit Sweden hard in 2009, when real GDP per capita dropped by aroundfive percent. This was the result of a drop in aggregate demand, which began during the fourth quartile 2007 (National Institute of Economic Research, Forecast Database), and the effects of the international financial crisis of 2008. As a consequence, unemployment increased in 2009 and 2010. In the adult labour force, unemployment rose from around four percent in 2008 to about six percent in 2009 and 2010. Even though aggregate demand and the number of vacancies increased from 2010 onwards, the unemployment rate remained at around 5.5 percent for that age group.
We have already seen that the young were severely affected by unemployment during the reces-sion. Also for other vulnerable groups unemployment increased. For the foreign-born, unemploy-ment rose from 12 percent to over 16 percent in 2010 (Figure 3(a)). Similar tendencies are seen in the employment rate (Figure 3(b)). Although the overall employment rate fell in 2009 and in 2010, it returned to the previous level already in 2011. The fall in employment was more pronounced for the foreign-born and, in particular, for the young (here aged 20–24). However, the most impor-tant difference was that the employment rate did not recover after 2010, neither for the foreign-born nor for the young. A similar pattern is found for people with a low education level. The recession led to increased unemployment (seeFigure 3(c)). For people with primary-school education, unemploy-ment grew from 14 percent (year 2008) to 18 percent in 2010, and it continued to rise after the recession years (2011–2013). In 2013, unemployment in this group was actually higher than it had been during the recession. For people with secondary-school education, the trend looks di ffer-ent: the recession led to an increase in unemployment. However, unemployment decreased after 2009 and remained stable at around 8 percent up to 2013. For people with a tertiary education, the recession was hardly noticeable, with the unemployment rate remaining stable throughout the whole period.
Conclusively, even though the Swedish economy recovered during 2010, unemployment remained high, specifically for the young, the foreign-born and the less educated. Further, when we study the Swedish Beveridge curve (Figure 4), it seems that an outward shift occurred during this period. As the Beveridge curve shows– regarding the relationship between the unemployment rate and the job vacancy rate (vacancies in relation to the labour force)– a shift outward can be inter-preted as a decrease in the efficiency of the labour market and, more specifically, the matching pro-cess. This shift took place after the Great Recession. During the recession, there was movement downwards on the Beveridge curve, just as expected. In 2007 and 2008, there were more vacancies and less unemployment. As the recession went on, there were less vacancies and higher ment. However, from 2010 there has been not only a high vacancy rate, but also a high unemploy-ment rate.
A similar development has taken place in the European Union. A clear outward shift in the aggre-gated European Beveridge curve took place after the Great Recession, indicating a worsening of the matching process. Since 2014, movements have taken place along the Swedish as well as the Euro-pean Beveridge curve, as vacancies have increased along with decreasing unemployment rates. How-ever, since no inward shift has taken place, matching problems remain large. Furthermore, judging
from the situation in 2017, both Sweden and Finland have a matching efficiency, which is poorer than the European trend curve2(Eurostat,2018).
The cyclical effects over this period are obvious. However, due to observations in the change of the composition of the labour force and the shift outwards on the Beveridge curve, there are reasons also to discuss the structural change. One way of analysing structural change is to use Schön’s Schumpe-tarian concept (see, for example, Schön,2009,2010). In this approach, technical innovation and the creation of new complementarities around macro innovations are central. The development can be sorted into two growth periods interrupted by crises. Thefirst growth period is characterised by
Figure 3.(a) Unemployment rate (number of unemployed in relation to the labour force) in Sweden 2006–2013. Source: Statistics Sweden, Labour Force Survey [Arbetskraftsundersökningen]. (b). Employment rate (number of employed in relation to the popu-lation) in Sweden 2006–2013. Source: Statistics Sweden, Labour Force Survey [Arbetskraftsundersökningen]. (c). Unemployment rate (number of unemployed in relation to the labour force (age 15–74) in Sweden 2006–2013 and education level. Source: Stat-istics Sweden, Labour Force Survey [Arbetskraftsundersökningen].
2Denmark is not included in this investigation since their job vacancy statistics do not cover the whole economy (Eurostat,2018),
transformation. This period is around 20–25 years long. During this period, development is uneven and unbalanced. The second period is characterised by rationalisation. During this period, growth accelerates. This period is around 15–20 years long.
In this perspective, the so-called third industrial revolution– when the micro-chip and its comple-mentarities started a new technological wave– began after the structural crisis in 1975–1980. The trans-formational period of structural changes lasted from the late 1970s up to the beginning of the 1990s, followed by a transformational crisis in the beginning of the 1990s. The high growth rate that Sweden has experienced since the mid-1990s indicates that the rationalisation phase has been in place during the following 15 years. In this perspective, the Great Recession signals the end of this rationalisation period, and it should be interpreted as a structural crisis. The shift of the Beveridge curve shows that something has happened to the efficiency of the labour market and, specifically, the matching process. This could be interpreted as a structural shift with possible far-reaching consequences.
To summarise, the structural crisis in the early 1990s had profound effects on the Swedish economy and labour market. Low-skilled jobs were squeezed out from the labour market and unemployment reached unprecedented high levels (Åberg,2015). The following 12–13 years were characterised by a relatively high economic growth – brought about, to large extent, by continued rationalisation. This entailed a continued out-squeezing of low-skilled jobs (specifically within manufacturing), which was detrimental to the employment of young people, foreign-born and people with low edu-cation, whereas the situation for‘core workers’ and the high-skilled gradually become quite favourable. The unemployment rate for workers 25+ yearsfluctuated between four and five percent from 2000– 2008, whereas it doubled from 10 to 20 percent for young workers in the same period. It is reasonable therefore to think that this situation led to increased competition on the low-skill labour market. Fol-lowing our theoretical outline, informal recruitment practices will become more popular when com-petition increases and higher comcom-petition for low-skill jobs would lead to an increase in the use of network recruitment. The question remains if this also is the case empirically.
4. Recruitment in Sweden
4.1. Formal and informal recruitment practices
The role of the Swedish Public Employment Agency (SPEA) is interesting in terms of recruitment policy. The first public employment services were introduced in 1902 in Helsingborg and
Figure 4.Swedish Beveridge curve 2001–2014. Source: Statistics Sweden, Job Vacancy Survey [Konjunkturstatistik över vakanser]; Labour Force Survey [Arbetskraftsundersökningen].
Gothenburg. These services were run by the municipalities; and from 1907 onwards, they were funded by the state. Although private employment services were established before 1902, they were banned in 1935 (Wadauer, Buchner, & Mejstrik,2015). In 1934 a new law for public employ-ment offices came into play. According to the new law, counties and municipalities were obliged to offer public employment service. At the same time, state funding of the public employment agencies increased. This led to an expansion in the number of public employment offices nation-wide, and together with a positive economic situation from the mid-1930s, resulted in an increase in the num-ber of mediated jobs. A new national organisation (The National Labour Market Commission [Sta-tens arbetsmarknadskommission]) came into play in 1940; in 1948 reorganised as The Labour Market Board [Arbetsmarknadsstyrelsen] (Delander, Thoursie, & Wadensjö,1991).
In 1976 a law was enforced in Sweden requiring all vacancies to be reported to the public employ-ment office (Lag1976:157). Although the law was officially abandoned in 2007, it had, in reality, stopped working long before and had no practical meaning. Nevertheless, it is evident that the Swed-ish labour market had been institutionalised to facilitate formal recruitment and, specifically, formal recruitment provided by the state.
The new centre-liberal-conservative government that took office in the autumn of 2006 had ambitious plans to reform the public employment administration. In March 2007, the govern-ment proposed to convert the decentralised organisation into a centralised Swedish Public Employ-ment Administration (SPEA) [Arbetsförmedlingen]. The reason for this was that the agency’s structure ‘ … complicates management and reduces operational efficiency’ (Regeringens Prop-osition, 2006/07, p. 72). Further, more efforts were to be focused on matching and mediating jobs. Private actors were brought in and a new form of job coaching was tried out (Forslund & Vik-ström,2011).
To conclude, the period 2006–2013 saw institutional and organisational changes. During this time, a variation in unemployment rates and vacancies was observed; and although the ambition from the government was to improve the efficiency of the SPEA, not much seems to have happened. This is a starting-point for our investigation of the variation of network recruit-ment in this period.
4.2. Previous research on recruitment in Sweden
There are several studies on networks and recruitment practises in the Swedish context. Korpi (2001) analysed whether the jobseekers used weak and/or strong ties while searching for employment. Strong ties were defined as people you meet at least twice a month, and weak ties people you met less. Korpi pointed out that there are methodological issues when studying networks and their connection to recruitment practises. One example is that the individual’s network size has to be acknowledged to exclude selection bias. To elude this problem, Korpi did the following: (1) used longitudinal data where questions about the informants’ social life and (in the second interview) how they found a job were asked; and (2) added three sets of control variables. Korpi’s conclusion is that social relations have an impact on recruitment. Moreover, the size of a network has a positive effect on the likelihood of finding a job and, in terms of network structure, strong ties seem to be better than weak ties.
According to Hensvik and Nordström Skans (2013), three forms of the network could lead to recruitment: (1) family contacts; (2) summer jobs or/and extra jobs; and (3) social programmes, i.e. activities within the school or public employment services. The researchers investigated the role of summer jobs in Sweden and found that they have a positive correlation concerning the prob-ability offinding a permanent job five months after graduation from secondary school.
Hällsten et al. (2017) researched the effect of social capital on unemployment risk concerning 19-year-olds of Swedish, Iranian and Yugoslavian origin living in Sweden. They define two dimensions of social capital: occupational contact networks and friendship networks. The survey was conducted approximately half a year after the informants had left school. The results were as follows: (1) a per-son’s unemployment risk connects to friends’ unemployment for people with the Swedish and
Yugoslavian origin, but not for people with Iranian origin; (2) occupational networks reduce unem-ployment risk for all groups.
In summary, we know quite a lot about network recruitment, but fairly little about how network recruitment has changed over time in Sweden. Two recent studies have a temporal dimension, though. In a study based on interviews and work life narratives, Håkansson and Tovatt (2017) describe how changes in recruitment practises have connected to institutional and structural change over the last century. The study also shows that in periods of high unemployment, personal networks (social capital) become more important when competition for a declining number of jobs becomes high.
Hensvik et al. (2017) investigate the relationship between young people’s summer jobs and later employment. They use these summer jobs to estimate two types of informal ties: (1) direct link, if the respondent is employed in the workplace after the temporary summer job; (2) indirect link, if the respondent is employed at a former co-worker’s new workplace. Their results show that the impact of informal ties is twice as large during a recession as during an economic boom.
Though the results from Hensvik et al. (2017) are very interesting, the study also has some weak-nesses. It defines informal ties very narrowly, by only studying summer jobs and contacts with co-workers. Further, it only studies young people (age 19–20) leaving vocational programmes. To get a full picture, we need to look at, and compare, different recruitment practices and, not least, the role of the Swedish Public Employment Agency (SPEA).
5. Data
5.1. Search methods
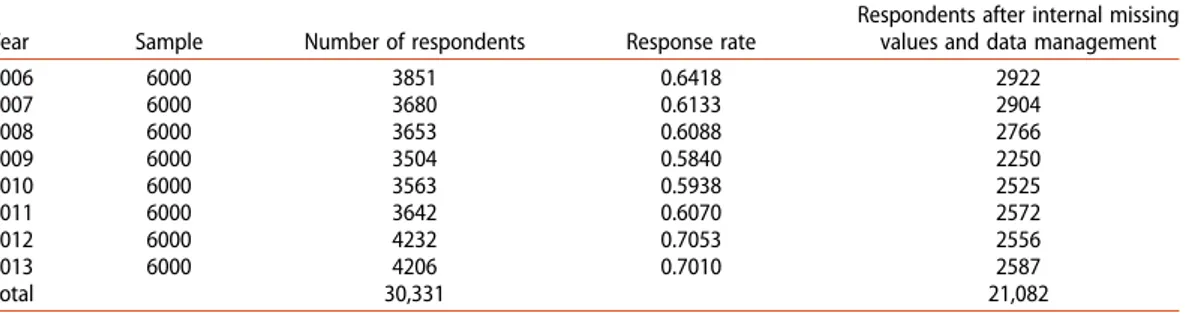
Since 2006, SPEA [Arbetsförmedlingen] has conducted a Leavers’ survey [Lämnatundersökningen], where people who have left the employment service because they obtained a job, or have switched to a category of applicants involving work, are interviewed about how they received the information about the job. Other criteria are that the applicant was registered at SPEA as unemployed or as par-ticipant in an unemployment programme. The survey was conducted twice every year in autumn and spring. The sample design was Simple Random Sampling, and the sample size was 6000 per year, sampled from a yearly population of around 50,000 (2006) and up to around 75,000 (2010) (Nilsson, 2011). Table 1 shows more details concerning the population each year, sample size, response rate, and observations left after internal missing values and data management.3
There are strengths and weaknesses in the data. The strength is that its validity is high: it actually measures the issue to be measured, namely, recruitment practices. Quite often, studies on recruit-ment practices and network recruitrecruit-ment (see, for example, Håkansson,2011; Hensvik & Nordström Skans,2013) use a variable for network and then connect it to employment/unemployment; but whether or not the network really had anything to do with employment is impossible to say. This survey asked the respondents directly about how they were recruited; therefore, the validity of this data is higher. Another reason is that the data set is large (21,082).
One weakness is that the respondents who took part had to be registered at SPEA, which may bring some bias into the data. However, in Sweden, all unemployed persons must register at SPEA to get unemployment benefits. Even persons with private insurance have to register with SPEA to get their private insurance. Still, among the unemployed, a bias may occur with people with-out unemployment insurance, such as the young, who therefore receive low unemployment benefits. If they live with their parents, for example, they may notfind it worthwhile to register at all, as they are only eligible to receive low unemployment benefits.
3In the data management phase, some observations had to be dropped. For example, shipping and culture have their own regional
code, which could not be integrated with labour supply per county. Thus, these observations had to be dropped, but these where less than 600 observations. The primary difference between column 2 (Number of respondents) and column 4 (respondents after internal missing values and data management), however, is internal missing value.
Table 2shows the descriptive for the period 2006–2013, categorised by age, education, origin and gender. The information sources are divided into the following categories: ‘formal SPEA’ (infor-mation through SPEA’s different information channels), ‘formal private’ (ads on Internet and in the newspapers, private employment services),‘direct application’ (contacting the employer them-selves), ‘employer made contact’, and ‘information through friends and acquaintances’. Pearson’s chi-squared test has been used to test for significant differences. For each cell, chi2’s contribution to Pearson’s chi-squared has been calculated (cchi2).
Table 2shows that there are significant differences in recruitment practices when it comes to age, education level, origin and gender. For example, young people tend to lean more on friends and acquaintances than older persons do. Among the young, close to 40 percent use friends and acquain-tances; but among people, 25–64 years of age, 26 percent used this method. This is contrary to what Granovetter found in 1974, where it was most common among people over 34 years to use personal contacts. Granovetter interpreted this as younger persons not having good contacts. We interpret the results from the leavers’ survey as a change among the young according to the hypothesis discussed previously. This is also in line with Håkansson and Tovatt’s (2017)findings. In Sweden, from the beginning of the 1990s, it became more common for a person’s first job, which is often a low-skilled job, to be mediated through friends and family (Håkansson & Tovatt,2017).
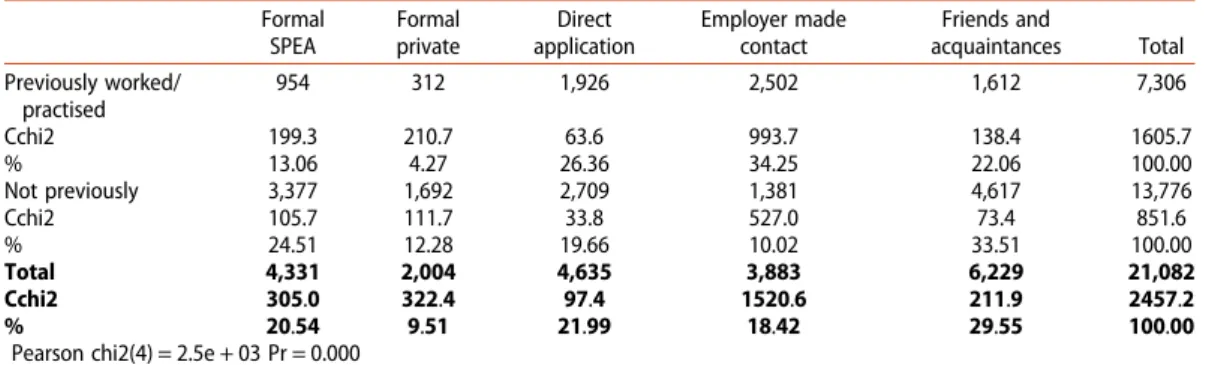
Also noteworthy is that the recruitment practice of the employer making contact with the jobsee-ker is more common among older respondents than among the young. As previously stated, a differ-ence is observed between the two practices of ‘employer made contact’ and ‘friends and acquaintances’: the former leads to access, while the latter is about the distribution of information. Further, asTable 3shows, two of the recruitment practices indicated it advantageous to have pre-viously worked for the same employer. The majority of the respondents who stated that the employer made contact with them had previously worked for that employer. Moreover, for the recruitment practice‘direct application’, there is a difference between respondents who had previous experience with the employer and those who had none. For the other recruitment practices, there were di ffer-ences pointing to the other direction, i.e. it was more common not to have worked at the workplace. Other interesting results are that respondents with tertiary education tend to use formal sources more and friends and acquaintances less. Specifically, this goes for ‘formal private’ when people with tertiary and primary education are compared. A possible explanation is that these positions more often have to meet the requirements of formal merits and qualifications. In these cases, it may be necessary to abolish the personal network and advertise the position as widely as possible.
In terms of national origin, significant differences can be found between the respondents born outside of Sweden and those born in Sweden, when it comes to‘formal SPEA’, ‘direct application’ (people born outside Sweden use these methods more), and ‘employer made contact’ (people born outside Sweden use less). Significant differences can also be found between men and women: men use friends and acquaintances more than women do, while women use formal practices more.
Table 1. Leavers’ survey [Lämnatundersökningen]. Sample size, response rate, and number of respondents left after data management.
Year Sample Number of respondents Response rate
Respondents after internal missing values and data management 2006 6000 3851 0.6418 2922 2007 6000 3680 0.6133 2904 2008 6000 3653 0.6088 2766 2009 6000 3504 0.5840 2250 2010 6000 3563 0.5938 2525 2011 6000 3642 0.6070 2572 2012 6000 4232 0.7053 2556 2013 6000 4206 0.7010 2587 Total 30,331 21,082
5.2. Labour supply
The variable‘labour supply’ is measured by the total number of vacancies per county divided by the number of unemployed (15–74 years) per county. The vacancies cover private as well as public sec-tors and are defined as ongoing recruitment at the company/workplace at the time. It covers pos-itions where the employer has started external recruitment (i.e. not limited to the company), but has not yet appointed anyone. The variable corresponds to the Eurostat definition of vacancies. The data is collected by Statistics Sweden in the Job Vacancy Survey [Konjunkturstatistik över vakanser] and is defined in a way that is consistent with the number of unemployed in the Labour
Table 2.How did you obtain the information about your new job? Formal SPEA Formal private Direct application Employer made contact Friends and acquaintances Total Age 18–24 years (n) 1,019 419 1,117 750 2,183 5,488 Cchi2 10.4 20.2 6.6 67.3 194.4 299.0 % 18.57 7.63 20.35 13.67 39.78 100.00 25–64 years (n) 3,312 1,585 3,518 3,133 4,046 15,594 Cchi2 3.7 7.1 2.3 23.7 68.4 105.2 % 21.24 10.16 22.56 20.09 25.95 100.00 Total 4,331 2,004 4,635 3,883 6,229 21,082 Cchi2 14.1 27.3 9.0 91.0 262.9 404.2 % 20.54 9.51 21.99 18.42 29.55 100.00 Pearson chi2(4) = 404.2380 Pr = 0.000 Education level Primary education (n) 723 151 853 656 1,077 3,460 Cchi2 0.2 96.2 11.2 0.5 2.9 111.1 % 20.90 4.36 24.65 18.96 31.13 100.00 Secondary (n) 2,075 919 2,541 2,091 3,772 11,398 Cchi2 30.3 25.0 0.5 0.0 48.5 104.4 % 18.20 8.06 22.29 18.35 33.09 100.00 Tertiary (n) 1,533 934 1,241 1,136 1,380 6,224 Cchi2 50.6 198.1 11.9 0.1 114.6 375.2 % 24.63 15.01 19.94 18.25 22.17 100.00 Total 4,331 2,004 4,635 3,883 6,229 21,082 Cchi2 81.2 319.3 23.5 0.7 166.0 590.7 % 20.54 9.51 21.99 18.42 29.55 100.00 Pearson chi2(8) = 590.6970 Pr = 0.000 Origin
Born outside Sweden (n) 905 342 982 494 1,124 3,847 Cchi2 16.6 1.5 21.9 65.0 0.1 105.2 % 23.52 8.89 25.53 12.84 29.22 100.00 Born in Sweden (n) 3,426 1,662 3,653 3,389 5,105 17,235 Cchi2 3.7 0.3 4.9 14.5 0.0 23.5 % 19.88 9.64 21.20 19.66 29.62 100.00 Total 4,331 2,004 4,635 3,883 6,229 21,082 Cchi2 20.4 1.9 26.8 79.5 0.2 128.7 % 20.54 9.51 21.99 18.42 29.55 100.00 Pearson chi2(4) = 128.7158 Pr = 0.000 Gender Men (n) 1,959 1,002 2,324 2,008 3,834 11,127 Cchi2 46.7 2.9 6.1 0.8 90.8 147.4 % 17.61 9.01 20.89 18.05 34.46 100.00 Women (n) 2,372 1,002 2,311 1,875 2,395 9,955 Cchi2 52.2 3.3 6.8 0.9 101.5 164.8 % 23.83 10.07 23.21 18.83 24.06 100.00 Total 4,331 2,004 4,635 3,883 6,229 21,082 Cchi2 99.0 6.2 13.0 1.8 192.3 312.2 % 20.54 9.51 21.99 18.42 29.55 100.00 Pearson chi2(4) = 312.2181 Pr = 0.000
Force Survey [Arbetskraftsundersökningen] (Statistics Sweden,2016). The number of unemployed, as well as the unemployment rate, derives from the Labour Force Survey, Statistics Sweden.
Figure 5shows vacancies per unemployed on the national level. Just as the unemployment rates showed earlier, this measurement shows less tightness on the labour market during the years 2009 and 2010.
6. Model, method and results
As pointed out earlier, the aim of this article is to analyse how the use of different recruitment practices has varied over the period 2006–2013. For this purpose, we specify five different models to explain recruitment practice. In these models, we use time; cyclical variation; and a vector of individual charac-teristics (Zi), namely education level, age, gender, national origin, and the geographic region.
The methodological issues that Korpi pointed out, concerning measuring network size and net-work structure, are not fully viable here. First, the respondent’s network structure and size is not studied. In fact, we have no information about the respondent’s network. Second, yes, there may be selection bias (for example, the Swedish-born have more contacts than the foreign-born), but that is a part of the explanation. Third, the main aim is to study variation over time; and if there is selection bias, it is reasonable to assume that this is constant over time.
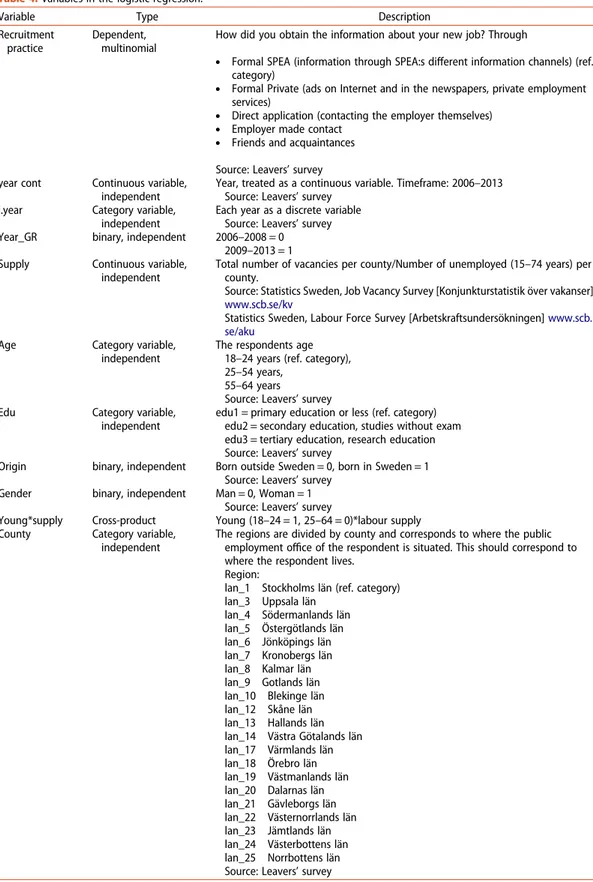
To estimate simultaneous and multiple effects, a multinomial regression model is used.Table 4 shows the variables used in the regression model. The recruitment practices estimated are thefive presented earlier: ‘formal SPEA’, ‘formal private’ ‘direct application’, ‘employer made contact’, and ‘friends and acquaintances’. The explanatory variable to estimate these recruitment practices is‘labour supply’, but the time effect is also important here. To analyse time, three different time variables are constructed. In thefirst regression (Model 1), year is used as a continuous variable. In the second (Model 2), each year is estimated as discrete variables, estimating parameter values for each and every year. The continuous year variable (Model 1) aims to estimate change over time in a continuous way, i.e. a structural effect. Due to multicollinearity (which was detected when testing for variance inflation factor (VIF)), we add the variable ‘labour supply’ in Model 3, without including other time variables. The Swedish Beveridge curve (Figure 4) indicates that some-thing happened in 2009, so we have constructed a dummy variable where 2006–2008 = 0 and 2009– 2013 = 1. In Model 4, we run the regression with this dummy variable. Our descriptive statistics sig-nalled that there may be cross-product significance for some variables, for example, that network recruitment could have hit young people harder during recession. In Model 5, we try out a model using a cross-product between age and labour supply. The socio-economic variables and region are control variables in all models.
The two hypotheses were as follows: (1) informal recruitment practices should increase over time, i.e. a positive association with time; (2) informal recruitment practices should increase if competition
Table 3.Had you previously worked or practised at your present employer? Formal SPEA Formal private Direct application Employer made contact Friends and acquaintances Total Previously worked/ practised 954 312 1,926 2,502 1,612 7,306 Cchi2 199.3 210.7 63.6 993.7 138.4 1605.7 % 13.06 4.27 26.36 34.25 22.06 100.00 Not previously 3,377 1,692 2,709 1,381 4,617 13,776 Cchi2 105.7 111.7 33.8 527.0 73.4 851.6 % 24.51 12.28 19.66 10.02 33.51 100.00 Total 4,331 2,004 4,635 3,883 6,229 21,082 Cchi2 305.0 322.4 97.4 1520.6 211.9 2457.2 % 20.54 9.51 21.99 18.42 29.55 100.00
Pearson chi2(4) = 2.5e + 03 Pr = 0.000
increases, for example, in a recession or if competition increases for a specific kind of job.Table 5 shows an extract of results from the regressions for our most important study variables. A table of the full results is presented in Appendix 1 (published online).
Model 1 shows the result when the year is treated as a continuous variable. The results for the different recruitment practices should be compared to the reference category of ‘formal SPEA’. Thefirst practice, ‘formal private’, shows a positive association to time (showing that the practice has increased over time) and positive associations with the time category variables, telling us that the recruitment practice is significantly different from the base year 2006. Concerning the control variables, the formal private recruitment practice is positively associated with education level, mean-ing that people with higher education levels use formal private recruitment more. Formal private recruitment also shows a positive association with the Swedish-born and a negative one towards women, meaning that the Swedish-born and men use the recruitment practice more. Labour supply (Model 3) is not significantly different from the reference (formal SPEA), which suggests that this recruitment practice moves as SPEA does in a recession. The year-dummy (Model 4), on the other hand, is significant, showing that ‘formal private’ increased more from 2009 and onwards (after the Great Recession) than formal SPEA.
For the second practice,‘direct application’, the continuous year variable (year_cont) is still posi-tive and significant, even if the significance is a bit weaker. The interpretation of year as a category variable is not clear. Some years are significantly different from the base year; some are not. Labour supply, however, is not significant, showing that this recruitment practice is not used significantly more in bad times, then what SPEA is. However, it was used more after 2009, which the significant year-dummy tells us. Further, since the cross-product variable (age multiplied by labour supply) is insignificant, we cannot draw any conclusions whether or not the young uses this practice more or less when times are bad. For the control variables, the recruitment practice shows a negative signifi-cant difference to ‘formal SPEA’ when it comes tertiary education. The education variable shows that higher educated people use‘direct application’ less than ‘formal SPEA’, which is what the descriptive statistics showed earlier. However, for people with secondary-school education, results are not sig-nificant. When it comes to gender, women use direct application less than men, in relation to ‘formal SPEA’.
The third recruitment practice shows‘employer made contact’. This recruitment practice does not increase with time (more than SPEA), as the continuous year variable not is significantly
Figure 5.Vacancies per unemployed in Sweden, 2006–2013. Source: Statistics Sweden, Job Vacancy Survey [Konjunkturstatistik över vakanser]; Labour Force Survey [Arbetskraftsundersökningen].
Table 4.Variables in the logistic regression.
Variable Type Description Recruitment
practice
Dependent, multinomial
How did you obtain the information about your new job? Through
. Formal SPEA (information through SPEA:s different information channels) (ref. category)
. Formal Private (ads on Internet and in the newspapers, private employment services)
. Direct application (contacting the employer themselves)
. Employer made contact
. Friends and acquaintances Source: Leavers’ survey year cont Continuous variable,
independent
Year, treated as a continuous variable. Timeframe: 2006–2013 Source: Leavers’ survey
i.year Category variable, independent
Each year as a discrete variable Source: Leavers’ survey Year_GR binary, independent 2006–2008 = 0
2009–2013 = 1 Supply Continuous variable,
independent
Total number of vacancies per county/Number of unemployed (15–74 years) per county.
Source: Statistics Sweden, Job Vacancy Survey [Konjunkturstatistik över vakanser]
www.scb.se/kv
Statistics Sweden, Labour Force Survey [Arbetskraftsundersökningen]www.scb. se/aku
Age Category variable, independent
The respondents age 18–24 years (ref. category), 25–54 years,
55–64 years
Source: Leavers’ survey Edu Category variable,
independent
edu1 = primary education or less (ref. category) edu2 = secondary education, studies without exam edu3 = tertiary education, research education Source: Leavers’ survey
Origin binary, independent Born outside Sweden = 0, born in Sweden = 1 Source: Leavers’ survey
Gender binary, independent Man = 0, Woman = 1 Source: Leavers’ survey
Young*supply Cross-product Young (18–24 = 1, 25–64 = 0)*labour supply County Category variable,
independent
The regions are divided by county and corresponds to where the public employment office of the respondent is situated. This should correspond to where the respondent lives.
Region:
lan_1 Stockholms län (ref. category) lan_3 Uppsala län lan_4 Södermanlands län lan_5 Östergötlands län lan_6 Jönköpings län lan_7 Kronobergs län lan_8 Kalmar län lan_9 Gotlands län lan_10 Blekinge län lan_12 Skåne län lan_13 Hallands län lan_14 Västra Götalands län lan_17 Värmlands län lan_18 Örebro län lan_19 Västmanlands län lan_20 Dalarnas län lan_21 Gävleborgs län lan_22 Västernorrlands län lan_23 Jämtlands län lan_24 Västerbottens län lan_25 Norrbottens län Source: Leavers’ survey
Formal privat Employer made contact year_cont 0.084*** 0.084*** year_cont −0.017 −0.017 Year 2007 0.662*** Year 2007 0.121 Year 2008 0.501*** Year 2008 −0.068 Year 2009 0.651*** Year 2009 0.444*** Year 2010 0.782*** Year 2010 0.331*** Year 2011 0.942*** Year 2011 0.003 Year 2012 0.945*** Year 2012 −0.100 Year 2013 0.598*** Year 2013 −0.142 supply 0.824 supply −2.835*** year_GR 0.388*** year_GR 0.097* young*supply −0.417 young*supply −1.883
Direct application Friends and acquaintances
year_cont 0.028** 0.028** year_cont 0.079*** 0.079*** Year 2007 0.247** Year 2007 0.156* Year 2008 0.030 Year 2008 0.134 Year 2009 0.386*** Year 2009 0.634*** Year 2010 0.329*** Year 2010 0.695*** Year 2011 0.132 Year 2011 0.513*** Year 2012 0.336*** Year 2012 0.511*** Year 2013 0.192* Year 2013 0.481*** supply −0.495 supply −2.135*** year_GR 0.179*** year_GR 0.469*** young*supply −0.941 young*supply −1.761*
Control variables: age, education, origin, gender and county used in all models *p < .05, ** p < .01, ***p < .001. SCAN DINAVIAN ECO N O M IC HIS T ORY R EVIEW 17
different from SPEA. On the other hand, labour supply (Model 3) is negatively associated with this recruitment practice, which means that when vacancies decrease and/or unemployment moves up, the recruitment practice increases in relative terms. The time category variables are only significant for the years 2009 and 2010, which can be interpreted as the practice was more important during the bad years. However, it did not seem to apply to the young. The cross-product young*supply is insignificant, which signals that the young did not use this recruitment practice during bad times. The year-dummy shows a weak significance, but as we know from the time category variables, it was only the years 2009 and 2010 that were significant and the years 2010–2013 were insignificant. Thus, the importance of this practice seems to have slowed down after the recession. As noted from the descriptive statistics, older people seem to have used this recruitment practice more frequently than the young. This result seems reasonable, given that you have to be known to be contacted by an employer, which favours experienced persons. One interesting result is that the foreign-born respondents had a significant lower probability of being contacted by the employer than those Swedish born. This strengthens the argument that this recruitment practice, to a greater extent, is exclusive and limits access compared to‘friends and acquaintances’, which is more about spread-ing information. Further, a significant difference between men and women was found. Women use this recruitment practice less than men compared to‘formal SPEA’.
The fourth recruitment practice shows the use of‘friends and acquaintances’. Both the time trend (Model 1), labour supply (Model 3) and the year-dummy (Model 4) are significantly correlated with this recruitment practice– telling us that it increased over time; but also that when unemployment goes up (in relation to vacancies), the recruitment practice increases. The year-dummy reveals that it increased from 2009 and beyond. Further, the cross-product young*supply shows a weak signi fi-cance, indicating that when times are tough, the young (18–24) use this practice more than people over 25 do. Further, highly-educated persons used friends and acquaintances less than the low edu-cated, the young more than the old, and the probability that women used friends is lower than com-pared to men. These results follow the results we observed from the descriptive statistics inTable 2. Conclusively, the regressions indicate changes over time and during the Great Recession. All recruitment practices have increased over time (except‘employer made contact’) in relation to ‘for-mal SPEA’. This time trend could be interpreted as a structural trend. When it comes to labour supply, ‘employer made contact’ and ‘friends and acquaintances’ are negatively correlated with the variable (as expected), which may be interpreted as a cyclical effect: when unemployment increases (in relation to vacancies), these recruitment practices also increase.
In Model 2,‘year’ is treated as a discrete variable to estimate the time component. What we see is that‘direct application’ and ‘employer made contact’ are positively correlated with specific years (for example, 2009 and 2010), while‘formal private’ is positively correlated with every year, and ‘friends and acquaintances’ from 2009–2013. The control variables (age, education, origin and gender) show, in general, the same associations and significance levels as in Model 1.
Our control variables tell us that the young tend to use‘friends and acquaintances’ more and ‘employer made contact’ less, but we can only see a weak significance for the young during the reces-sion using‘friends and acquaintances’. People with tertiary education use ‘formal private’ more than the less educated and‘direct application’, as well as ‘friends and acquaintances’ less. Women and foreign-borns seem to use‘formal SPEA’ more, since all the other recruitment practices are nega-tively correlated with‘formal SPEA’.
7. Discussion
In retrospect, it is obvious that the labour market has changed profoundly since the crisis in the early 1990s. Structural changes in the economy have caused a large number of unskilled jobs to disappear as well as larger skill demands on the labour force. These changes have brought about increasing difficulties for vulnerable groups, in particular, young people, foreign-borns, and unskilled workers. Various policies and labour market programmes have been launched to address this problem but
they have in general had limited effects. In this article, we change focus to different recruitment prac-tices. There are formal recruitment practices through SPEA, but also others that can be considered formal because they are openly announced and open to apply to. These so-called‘formal private’ recruitment practices include newspaper and internet advertisements, and recruitment though pri-vate employment services. The opposite of formal recruitment practices can be dichotomised as informal recruitment practices. In this article, these include‘direct application’, ‘friends and acquain-tances’, and ‘employer made contact’, all of which are examples of network recruitment, but in differ-ent ways. For the two recruitmdiffer-ent practices, ‘friends and acquaintances’ and ‘employer made contact’, the jobseeker needs a network. When it comes to ‘direct application’, it helps to have a net-work (someone to refer to that is known by the employer), but it is also possible that the jobseeker receives the information about where to apply through a network (information spreading). Thus, for the jobseeker, this network become an asset, i.e. a capital.
Initially, we formulated two hypotheses: (1) informal recruitment practices should increase over time, due to structural change; (2) informal recruitment practices should increase if competition increases, for example in a recession or if competition increases for a specific kind of job or specific groups. We have found ample evidence to confirm the second hypothesis. When times are tough – when unemployment increases and vacancies become fewer, i.e. competition for jobs increases– informal recruitment practices become more important. We may look upon this as a cyclical effect. The labour supply variable shows that there is a cyclical effect in the two network recruitment practices‘employer made contact’ and ‘friends and acquaintances’. On the other hand, for ‘formal private’ and ‘direct application’, where networks are of less importance, labour supply is not signifi-cant. This strengthens the argument that networking practices are crucial when times are tough. These results relate to thefirst research question; have recruitment practices varied over the business cycle? That was obviously the case during the cycle 2007–2013 and the discussion relating to our second hypothesis as well as previous research suggests that changes in recruitment practices have occurred also in the previous business cycles since 1990. Håkansson and Tovatt (2017) indicate that recruitment practices did change during the business cycles in the 1990s.
Evidence in favour of thefirst hypothesis is less straight-forward, due to the short observation period. There are, however, several indicators that point in the direction of the increasing importance of informal recruitment practices. Three recruitment practices – ‘direct application’, ‘friends and acquaintances’ and ‘formal private’ – are positively associated with time as a continuous variable. In other words, these recruitment practices are increasing over time in relation to formal SPEA. Thus, formal recruitment became less important; and this goes for all education groups, men and women, young and old, and regardless of one’s origin of birth. Certain groups, namely the low-skilled and the young, use network recruitment more than others. Previous research has shown that these characteristics have been prevalent for a long time. Håkansson and Tovatt (2017) show that network recruitment increased, specifically for low-skilled jobs, during the crisis of the early 1990s. This can be explained by stronger competition for low-skill jobs after the crises, which con-tributed to a change in recruitment practices. Our results suggest that this change has been persistent and, as a consequence, that informal recruitment has increased over time, at least from the early 1990s to the 2010s.
Our second research question was if changes in recruitment practices could be related to struc-tural change. Previous research indicates that such was the case. Håkansson and Tovatt (2017) argue that the increase in network recruitment is explained by economic structural change, which has led to increased transaction costs when it comes to formal recruitment at SPEA. A Fordist production system with a homogenised, but segmented, workforce, where formal recruitment was an excellent practice, has been replaced by a heterogenic workforce with high demands on non-cognitive skills and customisation. In such a production system, networks become more important.
A partly new pattern emerged after the Great Recession, which could be interpreted as a structural crisis following a 15 year long rationalisation period. This suggests strong structural change (Schön, 2010), taking place simultaneously with the shift in the Beveridge curve that indicates increasing
inefficiencies in the labour market after 2009. Since a similar development took place in the Euro-pean Union it suggests that our findings, although founded in a national context, are applicable also more generally. Our results show that network recruitment practices are more important after 2009 than before. In relative terms, public employment-recruitment (SPEA) becomes less important after the Great Recession. This is yet another indicator that the labour market is under-going fundamental changes, related to strong structural changes in the economy. Those changes suggest that the problems facing vulnerable groups are likely to persist. According to previous research, the main reason for vulnerable groups falling behind is that these groups are characterised by low skills in relation to labour market demand. In principle, such problems could be resolved with intense efforts in education and training targeting vulnerable groups. Our results, however, indicate that the issues facing vulnerable groups have become more serious. Network recruitment has increased both due to more intense competition for jobs during recessions, and over time. Young people and foreign-born possess less useable networks and contacts than older people, Swedish-born and people established in the labour market. The ongoing shift from formal to informal recruit-ment disfavours vulnerable groups and it will probably take more than training efforts to compensate for this disadvantage.
Disclosure statement
No potential conflict of interest was reported by the authors.
References
Åberg, R. (2015). Svensk arbetsmarknad mot polarisering efter millennieskiftet. Arbetsmarknad & Arbetsliv, 21(4), 8–25.
Andolfatto, D. (2008). Search models of unemployment. In S. N. Durlauf & L. E. Blume (Eds.), The New Palgrave dic-tionary of economics (2nd ed.). Basingstoke: Palgrave Macmillan.doi:10.1057/978-1-349-95121-5
Battu, H., Seaman, P., & Zenou, Y. (2011). Job contact networks and the ethnic minorities. Labour Economics, 18(1), 48–56.
Bell, D. N. F., & Blanchflower, D. G. (2011). Young People and the Great Recession. IZA Discussion Paper No. 5674. Bentolila, S., Michelacci, C., & Suarez, J. (2010). Social contacts and occupational choice. Economica, 77(305), 20–45. Bramoullé, Y., & Saint-Paul, G. (2010). Social networks and labor market transitions. Labour Economics, 17(1),
188–195.
Calvó-Armengol, A., & Jackson, M. O. (2004). The effects of social networks on employment and inequality. The American Economic Review, 94(3), 426–454.
Calvó-Armengol, A., & Zenou, Y. (2005). Job matching, social network and word-of-mouth communication. Journal of Urban Economics, 57(3), 500–522.
Delander, L., Thoursie, R., & Wadensjö, E. (1991). Arbetsförmedlingens historia. Stockholm: Allmänna förlaget. Eichengreen, B. (2015). Hall of mirrors: The great depression, the great recession, and the uses-and misuses-of history.
New York: Oxford University Press.
Engdahl, M., & Forslund, A. (2016). En förlorad generation? Om ungas etablering på arbetsmarknaden. IFAU Rapport 2016:1. Uppsala: IFAU.
Esping-Andersen, G. (1990). The three worlds of welfare capitalism. Cambridge, UK: Polity Press.
Eurostat. (2018). Statistics explained: Job vacancy and unemployment rates– Beveridge curve. Retrieved fromhttps:// ec.europa.eu/eurostat/statistics-explained/index.php/Job_vacancy_and_unemployment_rates_-_Beveridge_
curve#undefined
Forslund, A., & Vikström, J. (2011). Arbetsmarknadspolitikens effekter på sysselsättning och arbetslöshet: en översikt. Bilaga 1 till LU2011. Stockholm: Långtidsutredningen.
Goul Andersen, J. (2011). From the edge of the Abyss to Bonanza– and beyond. Danish economy and economic pol-icies 1980–2011. In L. Mjøset (Ed.), The Nordic varieties of capitalism (pp. 89–165). Bradford: Emerald Group Publishing Limited.
Granovetter, M. (1974). Getting a Job: A study of contacts and careers (2nd ed.). Chicago and London: The University of Chicago Press.
Håkansson, P. (2011). Ungdomsarbetslösheten: om övergångsregimer, institutionell förändring och socialt kapital. Lund: Lund University.
![Figure 4. Swedish Beveridge curve 2001 –2014. Source: Statistics Sweden, Job Vacancy Survey [Konjunkturstatistik över vakanser];](https://thumb-eu.123doks.com/thumbv2/5dokorg/4123927.87635/10.739.118.618.76.363/figure-swedish-beveridge-source-statistics-vacancy-konjunkturstatistik-vakanser.webp)

![Figure 5. Vacancies per unemployed in Sweden, 2006 –2013. Source: Statistics Sweden, Job Vacancy Survey [Konjunkturstatistik över vakanser]; Labour Force Survey [Arbetskraftsundersökningen].](https://thumb-eu.123doks.com/thumbv2/5dokorg/4123927.87635/16.739.119.624.82.365/figure-vacancies-unemployed-statistics-vacancy-konjunkturstatistik-vakanser-arbetskraftsundersökningen.webp)