Implementation of the
Master Curve method in ProSACC
2012:07
Author: Carl von Feilitzen Iradj Sattari-Far
SSM perspective Background
Cleavage fracture toughness data display normally large amount of sta-tistical scatter in the transition region. The cleavage toughness data in this region is specimen size-dependent, and should be treated statisti-cally rather than determinististatisti-cally. The Master Curve (MC) methodology is a procedure for mechanical testing and statistical analysis of fracture toughness of ferritic steels in the transition region.
The methodology accounts for temperature and size dependence of fracture toughness. Using the Master Curve methodology for evaluation of the fracture toughness in the transition region relaxes some of the over-conservatism that has been observed in using the ASME-KIC curve. The authority has in an earlier project sponsored research to evaluate the technical basis for the Master Curve (MC) concept, see SKI Research Report 2005:55. In the current report, the implementation of the MC concept into the program code ProSACC is described.
Objectives
The principal objective of the project has been to describe the imple-mentation of the MC concept into the code ProSACC.
Results
The main options of the Master Curve methodology are implemented in the ProSACC code.
The code gives fracture toughness values at the given temperature based on input data on T0 from fracture toughness testing, or Charpy impact test results (T28J or T41J) or KIC value from fracture toughness testing on the actual material.
There is also a possibility in the code to make crack-size correction on the evaluated fracture toughness.
Application of different Master Curve options in code is illustrated in three examples given in Appendices of the report.
Need for further research
The results of this project can be used for safety assessments of cracks in the core region of reactor pressure vessels by using the code ProSACC. More research is possibly needed for the further investigation of how the Master Curve Concept can be developed for including constraint effects.
Project information
Contact person SSM: Björn Brickstad Reference: SSM 2009/770.
2012:07
Authors:
Implementation of the
Master Curve method in ProSACC
Carl von Feilitzen and Iradj Sattari-FarThis report concerns a study which has been conducted for the Swedish Radiation Safety Authority, SSM. The conclusions and view-points presented in the report are those of the author/authors and do not necessarily coincide with those of the SSM.
Table of content
Page
SUMMARY ...2
1 INTRODUCTION ...3
2 DESCRIPTION OF THE MASTER CURVE METHOD ...4
2.1 GENERAL ASPECTS ...4
2.2 MASTER CURVES ACCORDING TO ASTME1921-03 STANDARD ...6
2.3 CORRELATION BETWEEN MASTER CURVE T0 AND CHARPY IMPACT TEST RESULTS ...8
2.4 VALIDATION WINDOW OF MASTER CURVES ...10
3 IMPLEMENTATION OF THE MASTER CURVE IN ProSACC ...12
3.1 DETERMINATION OF MASTER CURVE KJC FOR 1T-THICKNESS ...12
3.2 CORRECTION FOR CRACK-FRONT SIZE ...16
4 CONCLUDING REMARKS ...20
REFERENCES ...21
APPENDIX A1: MC CALCULATIONS WHEN T0-VALUE IS GIVEN ...22
APPENDIX A2: MC CALCULATIONS WHEN T28J-VALUE IS GIVEN ...23
SUMMARY
In this work, the main options of the Master Curve methodology are implemented in the ProSACC program. Different options in evaluating Master Curve fracture toughness from standard fracture toughness testing data or impact testing data are considered. In addition, the possibility to make size-correction due to crack size is considered in the program. Finally, in order to illustrate the application of the Master Curve methodology in evaluation of fracture toughness in structural integrity assessments using ProSACC, three examples are given in the Appendices of this report.
1 Introduction
Cleavage fracture toughness data display normally large amount of statistical scatter in the transition region. The cleavage toughness data in this region is specimen size-dependent, and should be treated statistically rather than deterministically. Master Curve methodology is a procedure for mechanical testing and statistical analysis of fracture toughness of ferritic steels in the transition region. The methodology accounts for temperature and size dependence of fracture toughness. Using the Master Curve methodology for evaluation of the fracture toughness in the transition region releases the over-conservatism that has been observed in using the ASME-KIC curve. The ASTM E1921-03 standard describes the determination of the reference temperature T0, which characterizes the fracture toughness of ferritic steels at onset of cleavage cracking at elastic or elastic-plastic instability. By definition, T0 is a temperature at which the median of the KJC distribution from 1T size specimens is 100 MPam. Based on the determined Master Curve T0, fracture toughness curves of different fracture probabilities (3, 5, 50 and 95% probability) can be developed. One main advantage of using the Master Curve methodology is possibility to use small Charpy-size specimens to determine fracture toughness. Detailed description of the Master Curve methodology is given by Sattari-Far and Wallin [2005]. A short description of the methodology is given in the following section of this report.
ProSACC is a suitable program in using for structural integrity assessments of components containing crack like defects and for defect tolerance analysis, Dillström et al [2004a, 2004b]. The program gives possibilities to conduct assessments based on deterministic or probabilistic grounds. The method utilized in ProSACC is based on the R6-method developed at Nuclear Electric plc, Milne et al [1988]. The basic assumption in this method is that fracture in a cracked body can be described by two parameters Kr and
Lr. The parameter Kr is the ratio between the stress intensity factor and the fracture toughness of the material. The parameter Lr is the ratio between applied load and the plastic limit load of the structure. The ProSACC assessment results are therefore highly dependent on the applied fracture toughness value in the assessment.
In this work, the main options of the Master Curve methodology are implemented in the ProSACC program. Different options in evaluating fracture toughness from standard fracture toughness testing and impact testing are considered. In addition, the possibility to make size-correction due to crack size is considered in the program. Finally, in order to illustrate the application of the Master Curve methodology in evaluation of fracture toughness in structural integrity assessments using ProSACC, three examples are given in the Appendices of this report.
2 Description of the Master Curve
method
2.1 GENERAL ASPECTS
Fracture mechanics, based on a continuum mechanics, gives means in understanding of fracture behaviour in cracked bodies. It is commonly assumed that there exists a single fracture toughness value controlling the materials fracture. If the crack driving force in the body is less than this value, the crack will not propagate and if it exceeds this value the crack will propagate.
The micromechanism of cleavage fracture exhibits a strong sensitivity to the stress field at the crack tip. Moreover, the highly localized phenomenon of cleavage fracture also demonstrates high sensitivity to the random inhomogeneities in the material along the crack front. Consequently, cleavage fracture toughness values which meet the specified size requirements nevertheless display large amount of statistical scatter, especially for temperatures corresponding to the transition region. Because of this substantial scatter, cleavage toughness data should be treated statistically rather than deterministically. It means that a given steel does not have a single value of toughness at a particular temperature in the transition region; rather, the material has a toughness distribution. Testing of numerous specimens to obtain a statistical distribution of the fracture toughness can be expensive and time-consuming. In addition, there has been an interest to utilize small fracture specimens, e.g. of Charpy size, to obtain fracture toughness data when severe limitations exist on material availability, for instance when considering irradiation embrittlement for ferritic materials. To reduce these problems, a methodology has been developed that greatly simplifies the process of determination of fracture toughness in the transition region. The ASTM E 1921-03 standard [2003] describes the procedure for the mechanical testing and statistical data analysis of ferritic steels in the transition region. This ASTM standard accounts for temperature dependence of toughness through a Fracture Toughness Master Curve approach developed by Wallin [1991]. Wallin observed that a wide range of ferritic steels have a characteristic fracture toughness-temperature curve, and the only difference between different steels was the absolute position of the curve with respect to temperature. The temperature dependence of the fracture toughness can be determined by performing a certain amount of fracture toughness tests at a given temperature.
The statistical size effect, due to the weakest link nature of cleavage fracture initiation, is active also for valid KIC results, provided they are above the lower shelf. A good example of this is given by the HSST 02 plate data used originally to develop the ASME KIC reference curve shown in Fig. 2.1, [Marston, 1978]. The data, originally known as the "million dollar curve", constituted the first large fracture toughness data set generated for a single material. Normally, only the valid KIC results are reported, but for clarity, here also the invalid results are included. It is evident that there is a difference between the smaller 1T & 2T specimens and the larger 4T & 6T specimens. The evaluation of these data will be fully in line with the theoretical statistical size effect in the Master Curve methodology, as shown in Fig. 2.2. Another example showing the decrease in KIC with increasing specimen size (thickness B) has been presented by MPA, shown in Fig. 2.3, [Issler, 1979]. Even though the data are limited in number, it clearly indicates decreasing fracture toughness with increasing specimen size, for all valid KIC values. Also in this case, the size effect is in line with the theoretical prediction of the Master Curve. Numerous similar data sets can easily be found in the open literature.
-150 -100 -50 0 0
50 100 150
A533B Cl.1 (HSST 02) Y = 480 MPa CENTER
4 & 6 T 1 & 2 T K IC [ M P a m] T [oC] KIC K Q 1 T 2 T 4 T 6 T
Fig. 2.1. Valid brittle fracture KIC data for the HSST 02 plate indicating decreasing fracture toughness with increasing specimen size, (Marston, [1978]).
-150 -100 -50 0 0 50 100 150 200 250 A533B Cl.1 (HSST 02) Y = 480 MPa CENTER
1 & 2 & 4 & 6 T KIC K Q 1 T 2 T 4 T 6 T B0 = 25 mm T [oC] K IC [ M P a m]
0 20 40 60 80 100 120 140 0 20 40 60 80 100 120 140 50 % 5 % 95 % ASTM E399 limit
K IC [ M P a m] B [mm] MPA CT DATA 20 MnMoNi 5 5 TNDT = -20oC T = -100oC
Fig. 2.3: MPA brittle fracture KIC data, for KS13, showing size effect in accordance with the Master Curve, (Issler, [1979]).
2.2 MASTER CURVES ACCORDING TO ASTM E1921-03
STANDARD
The ASTM E1921-03 standard describes the determination of a reference temperature, T0 in o
C, which characterizes the fracture toughness of ferritic steels that experience onset of cleavage cracking at elastic, or elastic-plastic KJc instability, or both. By definition, T0 is a temperature at which the median (50% fracture probability) of the KJc distribution from 1T size specimens will be equal to 100 MPam. Static elastic-plastic fracture tests are performed on standard SEN(B) or CT specimens having deep notches (a/W= 0.5) to measure the J-integral values at cleavage fracture (denoted Jc). The test temperature (T) and configuration of all specimens must be identified. The test temperature should be selected in the lower part of the ductile-to-brittle region as close as possible to the eventual T0. The standard requires a minimum of six replicate tests which meet the crack front straightness tolerances, the limits on ductile tearing prior to cleavage, the size/deformation limits, etc. It is also possible to use miniature specimen sizes in the fracture toughness test. For example, using test specimens of section 5x5 mm2 needs 12 validated tests. The J-integral values at fracture are converted to their equivalent units of stress intensity factor using:
(1)
,
m
MPa
1
2
c JcEJ
K
where E denotes the elastic modulus and the Poisson’s ratio of the material. The maximum KJc capacity of a specimen is restricted to:
(2) , ) 1 ( 2 0 (limit)
M Eb KJc Ywhere Y is the material yield strength at the test temperature and b0 the specimen remaining ligament. The standard sets M = 30 in order to assure that the small scale yielding (SSY) condition prevails in the test specimen. KJc data that exceed this requirement may be used in a data censoring procedure described in the standard, including additional restrictions. For test program conducted on other than 1T specimens, the measured toughness data should be size-corrected to their 1T equivalent according to:
20
(3)
20
4 1 1 x 1,
B
B
K
K
T Jc(x) T) Jc(
where B1T is the 1T specimen size (25 mm) and Bx the corresponding dimension of the test specimen. In Eqn. (3), 20 MPam represents the minimum (threshold) fracture toughness adopted for ferritic steels addressed by the standard.
The ASTM E1921-03 standard adopts a three-parameter Weibull model to define the relationship between KJc and the cumulative failure probability, Pf. The term Pf is the probability for failure at or before KJc for an arbitrarily chosen specimen taken from a large population of specimens. By specifying two of the three Weibull parameters, the failure probability has the form:
(4)
.
exp
1
4 min 0 min
K
K
K
K
P
f JcHere, the Weibull distribution shape has been assigned a value of 4 derived from theoretical arguments. For ferritic steels with yield strengths ranging from 275 to 825 MPa, the cumulative probability distribution of the fracture toughness is independent of specimen size and test temperature, when Kmin is set as 20 MPa√m. The scale parameter K0 is the data-fitting parameter. K0 corresponds to 63% cumulative probability. When using the maximum likelihood statistical method of data fitting, KJc and K0 are equal, and pf is 0.632. The following equation can be used for a sample that consists of six or more valid KJc values in order to evaluated K0.
(5) , 20 ) 20 ( 14 1 4 (i) 0
N i Jc N K Kwhere N denotes the number of valid tests (six minimum). Note that K0 can also be evaluated using both valid and censored test data. The procedure for this is given in the ASTM E1921-03 standard.
The estimated median (50% probability) KJc value, assuming pf = 0.50 in Eqn. (4), of the population at the tested temperature can be obtained from K0 as expressed in Eqn. (6):
(6)
.
20
)
20
(
9124
.
0
0 (med)
K
K
JcThe Master Curve is defined as the median (50% probability) toughness for the 1T (25 mm thick) specimen over the transition range for the material. Based on fitting to test results, the shape of the Master Curve for the 1T specimen is described for 50% fracture probability by Eqn. (7):
0
019
(
)
.
(7)
exp
70
30
0 (50%).
T-T
K
Jc
The lower-bound 3% and 5% probability curves and the upper-bound 95% probability curve can also be set up. These three curves are given by the following expressions:
0
019
(
)
.
(8)
exp
2
.
32
6
.
24
0 (3%).
T-T
K
Jc
0
019
(
)
.
(9)
exp
8
.
37
4
.
25
0 (5%).
T-T
K
Jc
0
019
(
)
.
(10)
exp
2
.
102
6
.
34
0 (95%).
T-T
K
Jc
Where, KJc is in MPa√m and T and T0 in o
C. Finally, the reference temperature T0 (
o
C), for which KJc is 100 MPa√m, is obtained from the following expression: (11) . 70 30 ln 019 . 0 1 (50%) 0 T KJc T
For crack configurations that have a crack sizes (crack-front length) other than 1T (25 mm) specimens, the Master Curve toughness should be size-corrected to its 1T equivalent according to:
20
25 (12) 20 4 1 1 cfl K KJCcfl JCT Where KJC cflis the size-corrected fracture toughness related to the actual crack-front-length (cfl), and
KJC 1T
is the evaluated standard fracture toughness from 1T (25 mm) specimens. The upper limit for crack-front-length correction is 100 mm, according to Sattari-Far and Wallin [2005].
2.3 CORRELATION BETWEEN MASTER CURVE T
0AND
CHARPY IMPACT TEST RESULTS
A consistent use of the Master Curve method for the assessment of nuclear reactor pressure vessels, require that an estimate of the Master Curve transition temperature T0 is obtained from the Charpy impact test information (usually obtained from the surveillance program test). This issue is complicated by the fact that the quality and quantity of Charpy test data varies from case to case. Sometimes the whole Charpy transition curve may be available, while in the other cases only part of the transition curve, or even only a single temperature, is included. There must be a consistent method of applying such different quality data to estimate T0.
Two different Charpy-V notch (CVN) correlations have been published, specifically developed for the Master Curve T0, Wallin [1989] and Sokolov and Nanstad [1999]. The first one is a correlation between
T0 and the 28J CVN transition temperature that is also used in the SINTAP structural integrity assessment procedure and the standard BS 7910. This correlation is presented in Fig. 2.4. The second correlation was developed by ORNL between T0 and the 41J CVN transition temperature, which is the transition temperature most commonly used in nuclear surveillance work. This correlation is presented in Fig. 2.5.
-150 -100 -50 0 50 100 150 -100 -50 0 50 100 T28J [oC] T 0 :E 1 9 2 1 -0 2 [ o C ]
Plate, Forging, Weld and HAZ Irradiated T0-1 = T28J + 3 oC A533B Cl.1 A508 Cl.3 A302-B T 0 = T28J -19 o C ; = 22oC
Fig. 2.4: Correlation for T28J transition temperature including only western nuclear pressure vessel materials with valid T0 values.
-150 -100 -50 0 50 100 150 -100 -50 0 50 100 150 T 0 = T41J -26 o C ; = 25oC T0-1 = T41J - 1 oC A533B Cl.1 A508 Cl.3 A302-B
Plate, Forging, Weld and HAZ Irradiated T41J [oC] T 0 :E 1 9 2 1 -0 2 [ o C ]
Fig. 2.5: Correlation for T41J transition temperature, where only western nuclear pressure vessel materials with valid T0 values are included.
Based on the relevant evaluated data from these two investigations, correlations between T0 and T28J and
T41J are presented in Eqns. (13) and (14), recommended in using for western nuclear grade pressure vessel steels and their welds:
3
28 0
T
J
T
[oC] (13)1
41 0
T
J
T
[oC] (14)The higher T0 value from these two equations may be used as the representative T0 of the material in estimation of the cleavage fracture toughness of the material from the Master Curve.
2.4 VALIDATION WINDOW OF MASTER CURVES
The reference temperature T0 should be relatively independent of the test temperature that has been selected. Hence, data that are distributed over a restricted temperature range, namely T0 ± 50
o
C, can be used to determine T0. This temperature range together with the specimen size requirement, Eqn. (2), provides a validity window for application of the Master Curve methodology, as shown in Fig. 2.6. Note that the standard Master Curves describe the cleavage fracture toughness of the material under high constraint conditions for which the single parameter characterization of the material toughness (KJc) holds. The ASTM E1921 standard does not require testing of 1T size specimens. It is also allowed to use Charpy size fracture specimens (W= B= 10 mm, a/W= 0.5) and convert the results to 1T equivalent values using Eqn. (3). This is a major advantage of the Master Curve methodology, having in mind the severe limitations which exist on material availability in nuclear irradiation embrittlement studies. The ASTM procedure includes limits relative to specimen size and KJc-values through Eqn. (2). Indeed, the M= 30 value has been selected largely on the basis of experimental data sets to ensure the existence of the SSY condition at fracture of the replicate test specimens.
-50
0
50
0
50
100
150
SIZE ADJUSTED CVN
PCTYPE DATA
M = 30 5 % 95 %K
JC[
M
P
a
m]
T - T
0[
oC]
Some of the main aspects of the Master Curve method in application for integrity assessments of reactor pressure vessels are as below:
1. The Master Curve assumptions on data scatter, size effect, minimum fracture toughness and temperature dependence are valid.
2. Testing should include several test temperatures, in order to minimise any effects from a possible small deviation from the Master Curve temperature dependence.
3. Determination of T0 should be based on test results in the temperature range of: -50C T – T0 +50C.
4. If only approximate information regarding the fracture toughness is required, the Master Curve can be extrapolated outside the range -50C T – T0 +50C. If an accurate description of the fracture toughness outside this temperature range is required, tests should preferably be performed at the specific temperature of interest.
3 Implementation of the Master Curve in
ProSACC
Different options within the Master Curve methodology are implemented in ProSACC in order to give possibilities for the user to conduct more comprehensive integrity assessment. It gives the user the possibilities to use 3%, 5% and 50% fracture probability in the analyses, based on Eqns. (7) to (9). It also gives the possibility to evaluate the fracture toughness KJC from Charpy data (T28J or T41J), based on Eqns. (13) and (14). In addition, the user has the option to make size-correction for the fracture toughness, based on the actual crack configuration, Eqn. (12). The procedure to use these options in ProSACC is briefly described below.
3.1 DETERMINATION OF MASTER CURVE K
JCFOR
1T-THICKNESS
The Material box of the new ProSACC (upgraded with the Master Curve methodology) is shown in Fig. 3.1. If the user selects “Master Curve” for fracture toughness, a dialog box with the following four options will be opened to fill the input data in evaluation of the Master Curve toughness, as shown in Fig. 3.2:
i) There is a valid T0 value from fracture toughness testing on the actual material. ii) There is valid value on T28J from Charpy impact testing on the actual material. iii) There is valid value on T41J from Charpy impact testing on the actual material. iv) There is a valid KIC value from fracture toughness testing on the actual material.
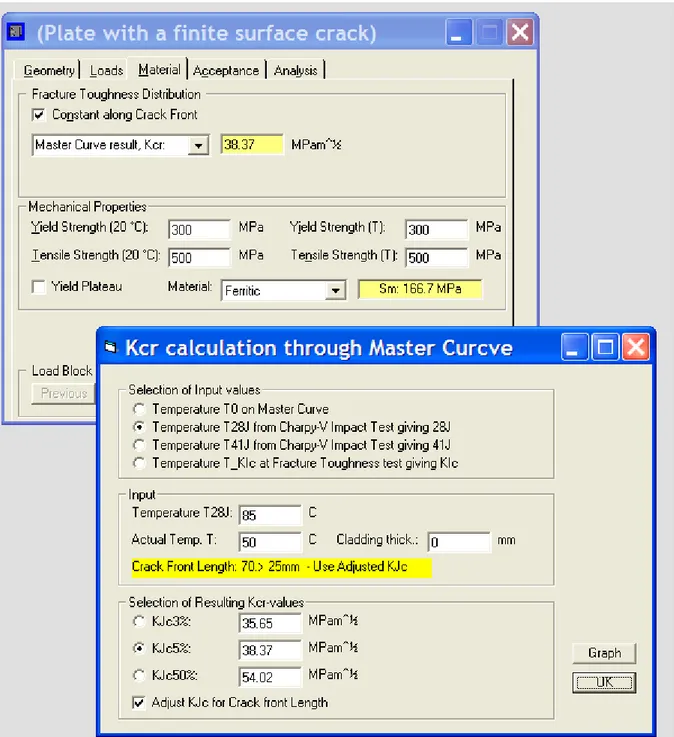
The user should give the relevant value to the parameter of his option (T0 or T28J or T41J or KIC) and the actual temperature for which the program will compute KJC. In addition, he should select which fracture probability (3% or 5% or 50%) is intended for the ProSACC analysis. There is also the option to adjust the KJC value for the crack front length. This option is described in the next section. The program will compute the relevant fracture toughness KJC, and the results will come in the following box, as shown in Fig. 3.2, which gives the fracture toughness for 3% fracture probability when using T0 as input data. The corresponding results when T28J is used as input data and fracture toughness for 5% probability is desired are shown in Fig. 3.3. The program gives also the possibility to have a plot on the results, by selecting the “Graph” bottom. The results are shown in Fig. 3.4, where the user gets information on different Master curves, the range of application window for the actual material, the input or evaluated T0 value, and the fracture toughness for the actual temperature (Tact). If the given Tact is outside the application window, the fracture toughness assessment based on Master Curve is not valid, and the user gets a warning on that. To edit an already calculated KJC value shown on the Material tab, the user should select the yellow coloured KJC result, and the Master Curve input window will be opened for editing.
Fig. 3.4: Evaluated results in an Application window of Master Curve toughness.
3.2 CORRECTION FOR CRACK-FRONT SIZE
Within the program, there is the possibility to adjust the KJC value for the crack front length. If the component is clad, the cladding thickness should be given as input in the material box. If there is no cladding, the value of the cladding thickness should be given as zero. Corrections for different crack configurations are considered in the program. It is assumed that the size-correction due to crack-front-length (cfl) is valid for crack front crack-front-length between 25 and 100 mm. It implies that no benefits on fracture toughness increase due to short cracks (cfl < 25 mm) are accounted in the program. For cfl >100 mm, it is assumed that cfl =100 mm, Sattari-Far and Wallin [2005]. Equation (12) gives the fracture toughness values corrected for the crack-front-length.
20
25 (12rep) 20 4 1 1 cfl K KcflJC JCT a) Size correction for through-thickness cracks:
mm.
25
that
considered
is
it
mm,
25
If
mm.
100
that
considered
is
it
mm,
100
If
(16)
cladding
with
components
For
2
2
c
(15)
cladding
without
components
For
2
cfl
cfl
cfl
cfl
t
t
fl
t
cfl
cladHere, t is the thickness of the component and tclad the thickness of cladding. b) Size correction for finite surface cracks:
mm.
25
that
considered
is
it
mm,
25
If
mm.
100
that
considered
is
it
mm,
100
If
(18)
cladding
with
components
For
2
)
3(a
10ac
-c)
3(a
2
c
(17)
cladding
without
components
For
)
3(a
10ac
-c)
3(a
2
2 2 2 2
cfl
cfl
cfl
cfl
t
c
fl
c
cfl
clad
Here, a is crack depth, c half of the crack length and tclad the thickness of cladding. c) Size correction for embedded cracks:
mm. 25 that considered is it mm, 25 If mm. 100 that considered is it mm, 100 If (19) ) 3(a 10ac -c) 3(a 2 2 cfl cfl cfl cfl c cfl
Here, a is crack depth and c half of the crack length. It is assumed that the crack does not include any cladding.
d) Size correction for infinite cracks:
For long extended (infinite) surface cracks in plates and cylinders (internal and external), the cfl is assumed to be 100 mm.
Fig. 3.5 shows the size-corrected fracture toughness value given in Fig. 3.3, now corrected for a crack-front-length of 70 mm. It is observed that due to this correction, the 5% fracture toughness value decreases from 43.76 to 38.37 MPa√m.
Fig. 3.5: Results of Master Curve toughness with choosing T28J and 5% fracture probability and correction for 70 mm crack-front-length.
The results of the Master Curve evaluation are also presented in the ProSACC final assessment report, as shown in Fig. 3.6. Here, the user gets information on the input-data used for evaluation of Master Curve toughness, and evaluated results within the Master Curve application window.
4 Concluding remarks
1. The main options of the Master Curve methodology are implemented in the ProSACC program. 2. The program gives fracture toughness values at the given temperature based on input data on T0 from fracture toughness testing, or Charpy impact test results (T28J or T41J) or KIC value from fracture toughness testing on the actual material.
3. There is also a possibility in the program to make crack-size correction on the evaluated fracture toughness.
4. Application of different Master Curve options in ProSACC is illustrated in three examples given in Appendices of this report.
References
ASTM E1921-03, (2003), “Standard test method for determination of reference temperature T0 for ferritic steels in the transition range”, American Society of Testing and materials, Philadelphia.
Dillström, P., Bergman, M., Brickstad, B., Zang, W., Sattari-Far, I., Sund, G., Andersson, P., Dahlberg, L. and Nilsson, F., (2004a), "A combined deterministic and probabilistic procedure for safety assessment of components with cracks -- handbook" DNV RSE R&D-Report 2004/01.
Dillström, P. and Zang, W., (2004b), “User manual ProSACC, Version 1.0”, DNV Research Report 2004/02, Det Norske Veritas AB, Stockholm, Sweden.
Issler, L., (1979), "Status of the Research Integrity of Components", 5th MPA-Seminar.
Marston, T.U., (1978), Flaw Evaluation Procedures - Background and Application of ASME Section XI Appendix A, EPRI NP-719-SR. Electric Power Research Institute, Palo Alto, California.
Milne, I., Ainsworth, R. A., Dowling, A. R. and A. T. Stewart, (1988), "Assessment of the integrity of structures containing defects." The International Journal of Pressure Vessels and Piping. Vol. 32, pp. 3-104.
Sattari-Far, I. and Wallin, K. (2005), “Application of Master Curve fracture toughness methodology for structural integrity of nuclear components”, SKI Report 2005:55, October 2005.
Sokolov, M. and Nanstad, R. K., (1999), “Comparison of irradiation-induced shifts of KJC and Charpy impact toughness for reactor pressure vessel steels”, Effects of Radiation on Materials: 18th International symposium, ASTM STP 1325, R. K. Nanstad, M. L. Hamilton, F. A. Garner and A. S. Kumar, Eds., American Society for Testing and Materials, West Conshohocken, PA, pp. 167-190.
Wallin, K., (1989), “A simple theoretical Charpy-V – KIC correlation for irradiation embrittlement”, ASME Pressure Vessels and Piping Conference, Innovative Approaches to Irradiation Damage and Fracture Analysis, PVP-Vol. 170, American Society of Mechanical Engineers, New York.
Wallin, K., (1991), “Fracture toughness transition curve shape for ferritic structural steels”, Proceedings of the Joint FEFG/ICF, Int. Conf. on Fract. of Eng. Materials, Singapore, August 6-8, 83-88.
Appendix A1:
MC calculations when T
0
-value is given
For a pressure vessel steel, the Master Curve index temperature is given to be T0= -5 o
C. Determine fracture toughness KJC of this steel at temperatures 10, 40 and 80
o
C based on 3%, 5% and 50% fracture probabilities in the Master Curve method.
Solution:
Using Eqns. (7) to (9) gives KJC values presented in Table A1.
Table A1: Fracture toughness KJC [MPa√m] of the steel at different temperatures.
10 oC 40 oC 80 oC KJC -3% KJC -5% KJC -50% 67.4 75.7 123.1 100.3 114.3 194.6 186.5 215.4 381.9
Note that the validity window of Master Curve for this steel is T = -55 oC to +45 oC, so T = 80 oC is out-side the validation window.
ProSACC gives the same results as in Table A1. The results are given in Fig. A1 for T = 10 oC. The user gets a warning if the actual temperature is outside the validity window.
Appendix A2:
MC calculations when T
28J
-value is given
From a surveillance test program of a RPV, it is given a value of T28J= 125 o
C for a weld. Determine fracture toughness KJC of this weld at temperatures 100
o
C and 150 oC to be used for structural assessment of this vessel. The assessment is supposed to be conducted based on 3%, and 5% fracture probabilities. Solution:
Using Eqn. (13) yields obtaining a conservative value of T0 for this weld to be T0 = 128 o
C. Using Eqns. (8) and (9) gives conservative KJC values of this weld presented in Table A2.
Table A2: Fracture toughness KJC [MPa√m] of the weld at different temperatures. 100 oC 150 oC KJC -3% KJC -5% 43.5 47.6 73.5 82.8
The actual temperature are within the validity window of Master Curve for this weld that is T = 78 oC to 178 oC. ProSACC gives the same results as in Table A2. The results for T = 100 oC are given in Fig. A2.
Appendix A3:
MC calculations when K
IC
-value is given
For a RPV material in irradiated state, it is given a value of KIC = 80 MPa√m from standard fracture testing at T = 100 oC. Determine fracture toughness KJC of this material at temperatures 70 and 150
o C to be used for structural integrity assessment of this RPV, assuming to have a surface crack of a = 7 mm and
2c = 42 mm. The assessment is supposed to be conducted based on 3%, and 5% fracture probabilities.
The vessel is clad with a 4-mm thick stainless steel. How does the crack length impact the results? Solution:
Using Eqn. (11) and assuming that the given KJC-value corresponds for KJC(50%), yields obtaining a value of T0 for this material to be T0 = 117.7
o
C. Using Eqns. (8) and (9) gives standard (25-mm thickness)
KJC values of this material as presented in Table A3.
Table A3: Not size-corrected fracture toughness KJC [MPa√m] of the material. 70 oC 150 oC KJC -3% KJC -5% 37.6 40.7 84.1 95.2
The size-corrected KJC results of the material for this crack size assuming cladding and no-cladding are given in Table A4, using Eqns. (12), (17) and (18).
Table A4: Size-corrected fracture toughness KJC [MPa√m] of the material. No cladding With 4 mm cladding 70 oC 150 oC 70 oC 150 oC KJC -3% KJC -5% 35.1 37.7 74.8 84.3 35.8 38.5 77.4 87.4
As can be seen in Table A4, the cladding has a positive effect in the evaluated fracture toughness, compared with the case without cladding but with the same crack front length.
ProSACC gives the same results as in Tables A3 and A4.
Strålsäkerhetsmyndigheten Swedish Radiation Safety Authority
2012:07 The Swedish Radiation Safety Authority has a comprehensive responsibility to ensure that society is safe from the effects of radiation. The Authority works to achieve radiation safety in a number of areas: nuclear power, medical care as well as commercial products and services. The Authority also works to achieve protection from natural radiation and to increase the level of radiation safety internationally.
The Swedish Radiation Safety Authority works proactively and preventively to protect people and the environment from the harmful effects of radiation, now and in the future. The Authority issues regulations and supervises compliance, while also supporting research, providing training and information, and issuing advice. Often, activities involving radiation require licences issued by the Authority. The Swedish Radiation Safety Authority maintains emergency preparedness around the clock with the aim of limiting the aftermath of radiation accidents and the unintentional spreading of radioactive substances. The Authority participates in international co-operation in order to promote radiation safety and fi nances projects aiming to raise the level of radiation safety in certain Eastern European countries.
The Authority reports to the Ministry of the Environment and has around 270 employees with competencies in the fi elds of engineering, natural and behavioural sciences, law, economics and communications. We have received quality, environmental and working environment certifi cation.
![Fig. 2.1. Valid brittle fracture K IC data for the HSST 02 plate indicating decreasing fracture toughness with increasing specimen size, (Marston, [1978])](https://thumb-eu.123doks.com/thumbv2/5dokorg/3348761.18951/11.892.207.685.109.490/fracture-indicating-decreasing-fracture-toughness-increasing-specimen-marston.webp)
![Fig. 2.3: MPA brittle fracture K IC data, for KS13, showing size effect in accordance with the Master Curve, (Issler, [1979])](https://thumb-eu.123doks.com/thumbv2/5dokorg/3348761.18951/12.892.199.687.130.502/brittle-fracture-showing-effect-accordance-master-curve-issler.webp)