BIO-GASIFICATION UNDER
PARTIALLY AERATED CONDITIONS;
RESULTS FROM BATCH EXPERIMENTS
Deshai Botheju
Rune Bakke
Telemark University College, Faculty of Technology,
Box 203, N-3901, Porsgrunn,
Norway
Email: Deshai.Botheju@hit.no
Tel. +47 45075165
ABSTRACT
Anaerobic digestion (AD) under mild aerobic loading is investigated. Aeration can apparently have both positive and negative impacts on biogas generation. This study aims to recognize and describe these different aeration effects on AD. Seven series of batch experiments (BT 1-7) were conducted under varying feed and oxygenation conditions at 35 oC. Oxygen was introduced as headspace air in four of the batch experiments and as pure oxygen in two series. Effects of extensive initial aeration of inoculum were investigated in one batch series.
The methane yield of the reactors fed with starch (1.09 g COD/LReactor) was positively
influenced by oxygenation in the load range up to 38 % O2 (as % of feed COD). A negative
influence of oxygen was observed at the next experimental level of 79 % O2. For the glucose
fed reactors under similar operating conditions, the oxygen impact was near linearly negative in the tested range of 0 - 49 % O2. These results demonstrate that digestion of soluble
substrates like glucose is not enhanced by O2, while substrates requiring hydrolysis are. Thus,
limited aeration can enhance biogas production from non-soluble substrates under batch conditions. According to the experiment where the effects of extensive initial aeration was investigated, lengthening of the aeration period increasingly slowed down the gas generation rate but eventually resulted in the same methane yield. The lag period before gas generation started was three times longer for the aerated inoculum reactors than un-aerated. These observations suggest that oxygen induced inhibition of the biomass activity is mostly reversible. Reduced biogas production rates with initial aeration extent suggest some permanent damage to the anaerobes. Extensively aerated inoculums generated less methane compared to the un-aerated inoculum, probably due to the loss of some biogas potential initially present in the inoculum. Oxygen assisted degradation of some recalcitrant organic matter, including biomass cells themselves, present in the inoculum is also detected in an unfed inoculum test series.
KEY WORDS
Anaerobic digestion; Batch experiments; Biogas; Micro-aeration; Oxygen.
1 INTRODUCTION
Enhanced bio-gasification of organic matter of different origins can serve the global demand for clean energy sources and better waste handling schemes. Cost effective and easy methods
to retrofit and improve the efficiency of biogas generating anaerobic digesters can enhance the dissemination of such solutions. Such initiatives can also be useful for building the confidence in bio-gasification as a credible combined energy avenue and a waste treatment alternative among decision makers and the general public.
This article describes the results obtained under batch operation conditions in a number of experiment series conducted to unravel the nature of bio-gasification performance under mild aerobic loading. Aeration has long being considered to have negative impacts on biogas generating anaerobic digesters [1]. This conventional understanding is based on the fact that methane forming archaea are strict anaerobic organisms showing no or very little tolerance to oxygen [2]. Enhanced hydrolysis in AD by micro-aeration has, however, been reported [3]. Improved acidification (VFA production) under mild aeration had also been suggested before [4]. These effects are known to be primarily due to the enhanced solubilisation (hydrolysis/acidogenesis) of particulate organic matter in the presence of some oxygen. Aeration can apparently have both positive and negative impacts on biogas generation. The aim of this study is to identify and describe these different effects of aeration on AD.
2 METHODOLOGY
2.1 Batch experiment procedures
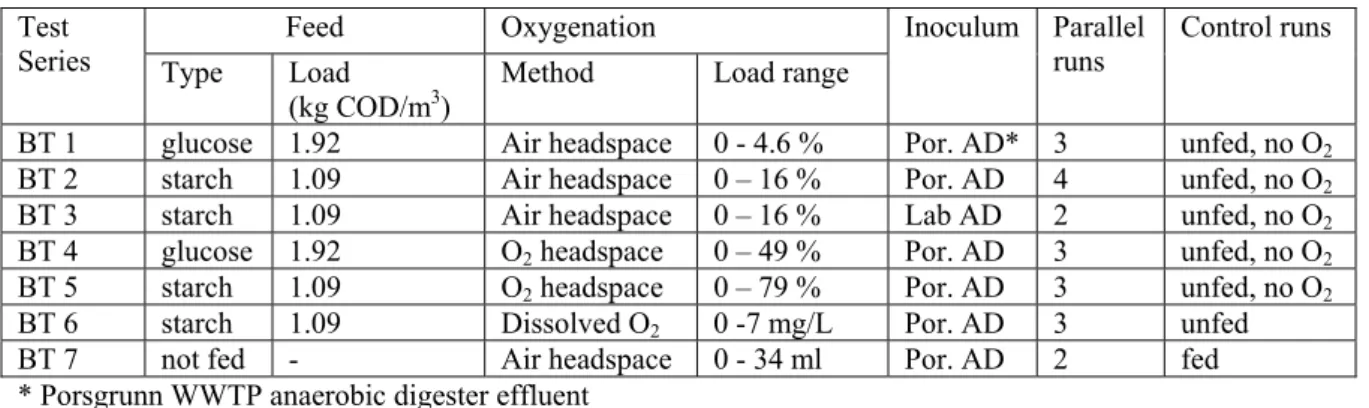
Seven different batch experiment series (BT 1 - 7) were conducted under varying feed and oxygen loading conditions (Table 1) at 35 oC (mesophilic temperature), using miniaturized bioreactors of 100 ml total volume, of which 50 ml liquid volume, inoculated with sludge obtained from a full scale municipal anaerobic digestion plant fed chemically precipitated primary sludge (Knarrdalstrand wastewater treatment facility, Porsgrunn, Norway). Series BT 3, as an exception, was conducted using the sludge taken from a lab scale anaerobic bioreactor. Oxygen was introduced as air in reactor headspace in four of the six batch experiments (BT 1-3 & 7). Pure oxygen in headspace were used in two experiment series (BT 4 & 5) to test higher oxygen load conditions (due to the headspace volume limitations of the reactors). Five different oxygenation conditions were tested, corresponding to 0, 4, 8, 16 and 32 ml headspaces. Then, based on the mass of oxygen provided and also considering the input COD load, corresponding percentage oxygenation (as % COD) was calculated for each oxygen load condition (Table 1).
Effects of extensive initial aeration of the inoculums were investigated in the batch test series BT 6 where three out of four reactor sets were air purged for 20, 30 and 60 minuets durations to achieve 3, 5 and 7 mg/L dissolve oxygen (DO) concentrations, respectively, before being fed. The experiment series BT 7 was conducted to study oxygen effects on non-fed inoculums (Table 1). Each of the experiment series consisted of a number of parallel runs and also different control runs, as summarized in Table 1 together with the operational conditions applied.
Table 1. Operational conditions for different batch experiment series (BT 1-7).
Feed Oxygenation Test
Series Type Load
(kg COD/m3) Method Load range
Inoculum Parallel
runs Control runs BT 1 glucose 1.92 Air headspace 0 - 4.6 % Por. AD* 3 unfed, no O2
BT 2 starch 1.09 Air headspace 0 – 16 % Por. AD 4 unfed, no O2
BT 3 starch 1.09 Air headspace 0 – 16 % Lab AD 2 unfed, no O2
BT 4 glucose 1.92 O2 headspace 0 – 49 % Por. AD 3 unfed, no O2
BT 5 starch 1.09 O2 headspace 0 – 79 % Por. AD 3 unfed, no O2
BT 6 starch 1.09 Dissolved O2 0 -7 mg/L Por. AD 3 unfed
BT 7 not fed - Air headspace 0 - 34 ml Por. AD 2 fed * Porsgrunn WWTP anaerobic digester effluent
All the inoculums used, except in BT 1, were stored at room temperature for more than 3 weeks in order to exhaust all remaining substrate content before applied. The inoculum used in BT 1 was only stored for 15 days. This stabilization of the inoculums was observed to be essential in order to clearly observe the behavior of differently oxygen loaded reactors, without the inoculum gas generation effect. Before being used, inoculums were filtered through a 0.6 mm sieve in order to filter out bulky particulate material.
2.2 Analytical methods
Standard bio-gasification parameters including volumetric gas generation, gas composition (CH4, CO2, O2 and N2 %) , different volatile fatty acids (acetic, propionic, iso-butyric, butyric,
iso-valeric, valeric, iso-caproic, caproic and heptanoic), soluble and total chemical oxygen demands (COD), pH, alkalinity, total and volatile solids, and total and volatile suspended solids were measured. Volumetric biogas generation was measured as a time variation (daily) data series and the other parameters were analyzed for the initial inoculum and then at the end of the experimental duration. The analytical procedures used are described elsewhere [5, 6].
3 RESULTS AND DISCUSSION 3.1 Air headspace experiments
The total biogas generation was showing a similar pattern in the experiments BT 2 and BT 3. The 2 % O2 reactors generated the highest amount of biogas while the other reactors with 0, 4,
8 and 16 % O2 generated gas in gradually increasing amounts. The difference in gas
generation between differently O2 loaded reactors was, however, small (Figure 1). The unfed
control reactors generated only minor amounts of biogas, indicating the stability of the inoculums. After the full exhaustion of the gas generation (in about 17 days), a slight decrease in the cumulative gas content was noted in all the batch experiments which were kept incubating longer (e.g: BT 2 - Figure 1a). This phenomenon was suggested to be caused by a methanotrophic activity occurring in the reactors. Methane consuming methenotrophic organisms can be found in abundance in aerobic environments. Some anaerobic methenotrophs are also reported [7].
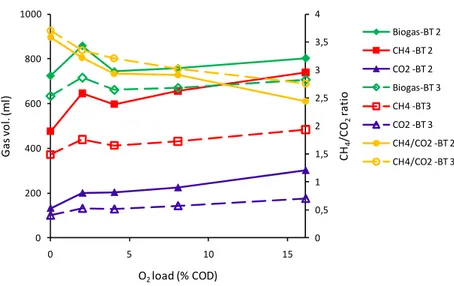
A positive impact on the methane yield under the oxygen load range of 0 -16 % (as % of feed COD) in the two batch experiment series BT 2 & 3 fed with starch equivalent to 1.09 g COD/LReactor is found (Figure 2). A lower methane yield in BT 3 compared to BT 2 can be
due to the different inoculums used (Table 1). The CO2 generation increased more with
increasing oxygenation than CH4. This led to lower CH4/CO2 ratios at higher oxygen loads
It is suggested that oxygenation lead to enhanced hydrolysis and acidogenesis via increased growth yield of fermentative biomass. These are generally facultative organisms with capability to perform aerobic respiration upon oxygen and substrate availability. These facultative fermenting (acidogenic) organisms use their extra cellular (excreted) enzymes to break down non-soluble longer chain organic molecules like starch, in the process known as hydrolysis or liquefaction. These resultant short chain molecules, like simple sugars formed by the hydrolysis of starch, are then utilized by the same organisms (acidogens) for growth and to produce simpler organic compounds such as volatile fatty acids (VFA). These volatile acids are subsequently used by other groups of obligate anaerobic organisms, such as acetogens and methanogens, to produce methane containing biogas. The acidogenic organisms further reduce the risk of any oxygen toxicity to obligate anaerobic acetogenic and methanogenic organisms, by acting as fast oxygen scavengers, leaving no dissolved oxygen under limited aeration. Enhanced hydrolysis and acidogenesis by partial aeration can hence generate higher amounts of soluble substrates (including VFA) which are then converted into methane. The aerobic respiration activity and enhanced acidogenesis generates greater amounts of CO2 too, as CO2 is a byproduct of those two biochemical steps (Figure 2).
0 10 20 30 40 50 60 0 5 10 15 20 25 Net cu m u la ti ve bi o ga s (ml ) Time (d)
control 0 % O2 2 % O2
4 % O2 8 % O2 16 % O2
0 10 20 30 40 50 0 4 8 12 16 Net cu m u la ti ve bi og as (m l) Time (d)
control 0 % O2 2 % O2
4 % O2 8 % O2 16 % O2
(a) BT 2 (b) BT 3
Figure 1. Net cumulative biogas generation (averaged) for different oxygen loaded reactors (BT 2 & BT 3). 0 0,5 1 1,5 2 2,5 3 3,5 4 0 200 400 600 800 1000 0 5 10 15 CH 4 /C O2 ra ti o Gas vo l. (ml ) O2 load (% COD) Biogas‐BT 2 CH4 ‐BT 2 CO2 ‐BT 2 Biogas‐BT 3 CH4 ‐BT3 CO2 ‐BT 3 CH4/CO2 ‐BT 2 CH4/CO2 ‐BT 3
3.2 Pure O2 headspace experiments
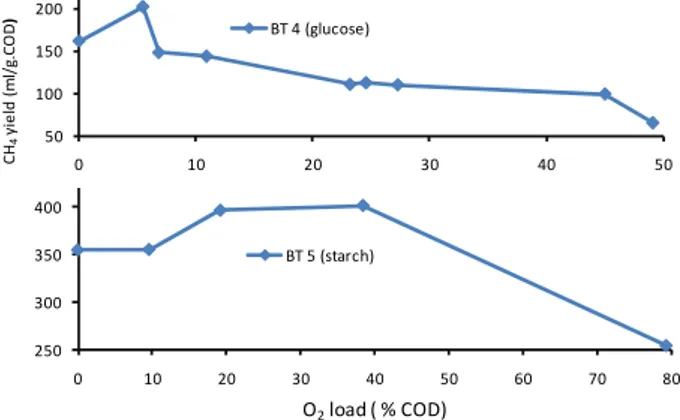
Test series BT 4 & 5, conducted using pure oxygen initial headspaces, investigated a broader range of oxygen loads and revealed that in the case of starch fed reactors (BT 4), the positive influence of oxygen continued until 38 % oxygenation. At the next experimental point, at 79 %, a clear negative impact appeared. For the glucose fed reactors (BT 5) under similar operating conditions, the oxygen impact was linearly negative in the tested range of 0 – 49 %. Negative impact of oxygen was also detected in the experiment series BT 1, supplied with air headspaces (0 – 4.6 % O2) and fed glucose. It must, however, be noted that the reactor
dynamics can be somewhat different when supplied with pure oxygen headspaces than the air headspaces. The oxygen mass transfer between liquid and gas phases can be much higher in the pure oxygen case, due to higher O2 concentration in the gas phase.
Soluble substrates like glucose do not need to undergo hydrolysis and can readily be oxidized by the aerobic activity of facultative organisms. Direct aerobic respiration using soluble substrates, like glucose, immediately consume the substrates intended for methane generation and hence can greatly reduce the methane potential. Even with a non-soluble substrate (like starch), excess aeration would lead to higher aerobic respiration consuming the generated soluble matter, leaving only a fraction for subsequent anaerobic methane generation. Reduced methane yield under high oxygenation condition in the starch fed reactors can be explained on this basis. Conversely, more than 100 % oxygenation would lead to a situation where not enough substrate is available for aerobic respiration to deplete all the available oxygen. This would create a DO concentration in the reactor mixed liquor and can inhibit the activity of obligate anaerobic organisms.
We can define that a condition in which oxygen is being supplied to a bioreactor but it does not indicate any dissolved oxygen as an oxygen limited scenario. Hence, an oxygen limited condition is only possible at < 100 % (as COD % - based on total biologically available COD) oxygenation levels. It is also apparent that establishment of an oxygen limited situation further depends on the rate of oxygen supply and also the rate of oxygen utilization. The oxygen utilization rate is directly proportional to the concentration of facultative biomass. Accordingly, the biomass concentration plays an important role in oxygen enhancement of methane potential. Further, we may only expect a positive influence on methane generation by oxygen at a lower oxygenation fraction that is specific to a particular system.
50 100 150 200 0 10 20 30 40 50 CH 4 yie ld ( m l/g .CO D ) BT 4 (glucose) 250 300 350 400 0 10 20 30 40 50 60 70 80 O2load ( % COD) BT 5 (starch)
Figure 3. Methane generation vs. O2 load in BT 4 and BT 5 series conducted with pure
3.3 Extensive inoculum aeration experiments
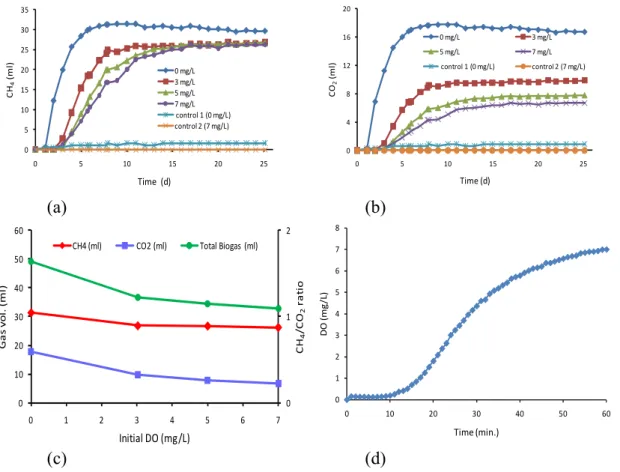
According to the experiment series BT 6, where the effects of excessive initial aeration of the inoculum was investigated, longer inoculum aeration led to a slower gas generation, but eventually resulted in the same amount of cumulative methane. Also, all three aerated reactor sets (3, 5 and 7 mg/L DO) took about 3 days of lag period before the gas generation started. The unaerated reactors started gas generation after only a 1 day lag (Figures 4 a & b). These observations suggest that oxygen did cause a full inhibition of the activity of the biogas generating biomass but this activity inhibition was reversible. In addition to that, higher aeration did permanently damage a part of the biomass. Extent of this biomass destruction was proportional to the aeration duration, explaining the lower gradients of gas generation curves at longer aeration durations (Figures 4 a & b). Initial gradients (rates) of the methane generation observed under the different aeration levels of 0, 3, 5 and 7 (mg/L-DO) were 13, 6.6, 4.1 and 2.6 ml/d, respectively. These data represents an exact exponential drop (R2=1) of initial methane generation with the increasing DO level.
The extensively aerated inoculums generated lesser total biogas and methane amounts, compared to the un-aerated inoclum. This was probably due to the loss of some substrate initially present in the inoculum, by oxidation (aerobic respiration). Figure 4c, depicting the methane generation versus O2 level, further confirms this. The initially present readily
available substrate content in the inoculum was so small that it was depleted at the lowest level of aeration used here and hence the methane potential of the aerated inoculum reactors was independent of the aeration level.
0 5 10 15 20 25 30 35 0 5 10 15 20 25 CH 4 (ml) Time (d) 0 mg/L 3 mg/L 5 mg/L 7 mg/L control 1 (0 mg/L) control 2 (7 mg/L) 0 4 8 12 16 20 0 5 10 15 20 25 CO 2 (m l) Time (d) 0 mg/L 3 mg/L 5 mg/L 7 mg/L control 1 (0 mg/L) control 2 (7 mg/L) (a) (b) 0 1 2 0 10 20 30 40 50 60 0 1 2 3 4 5 6 7 CH 4 /C O2 rat io Ga s vo l. (ml ) Initial DO (mg/L) CH4 (ml) CO2 (ml) Total Biogas (ml) 0 1 2 3 4 5 6 7 8 0 10 20 30 40 50 60 DO (m g /L ) Time (min.) (c) (d)
Figure 4. BT 6 experiment series. cumulative CH4; (b) cumulative CO2; (c) total cumulative
Figure 4d depicts the observed DO increase with time for the 7 mg/L inoculum aeration case. For the initial 10 minutes time duration, DO reading indicated zero under continuous air purging. This period represents a limited-aeration scenario where all the oxygen transferred to the liquid phase of this anaerobic inoculum was consumed by the facultative microbes by aerobic respiration using some remaining organic substrate. When all the substrate (or in other words; biological oxygen demand - BOD) content was depleted, the limited-aeration condition diminished and DO level started to rise and eventually reached 7 mg/L (saturation level) after about 1 hour of continuous air purging. This observation highlights the aerobic capability of organisms present in an inoculum obtained from an anaerobic digester. It is no surprise that full scale digesters in operation are rarely negatively affected by some unintentional aerobic loads, as reported by others [8]. According to Figure 4d, 10 min. of aeration was sufficient to consume all remaining (readily biodegradable) substrate in the inoculum. In the cases of 3 and 5 mg/L-DO aeration, the corresponding aeration times were 20 and 30 minutes. This corroborates the earlier explained observation of all aerated inoculums generating a same amount of methane upon feeding.
The short air purge time (60 minutes maximum) did not allow any significant aerobic growth. Oxygen present as dissolved O2 (7 mg/L maximum) was also too small for any significant
aerobic growth. Note that, in air headspace experiments, 4, 8, 16 and 32 ml of air headspaces are equivalent to oxygen concentrations of 22, 44, 88 and 176 mg/L. Thus, no positive effect on methane generation due to enhanced hydrolysis or acidogenesis could be expected in this experiment series (BT 6) which was only provided with dissolved oxygen. The measurements confirm this (Figure 4).
3.4 Inoculum alone experiment
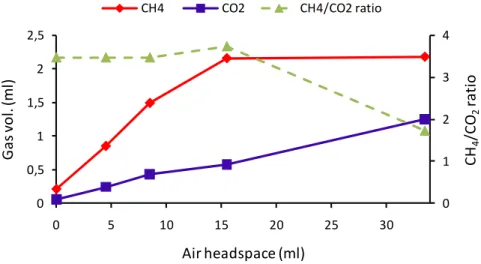
Figure 5 illustrates the gas generation curves according to the experiment series BT 7. Even though the gas generation is small in this un-fed inoculum only experiment, it does still show an increasing trend of methane generation when increasing the oxygenation level. The methane generation curve indicates that there is a maximum yield somewhere between 16 and 34 % oxygenation. Meanwhile CO2 generation shows a continuously increasing pattern in the
range tested. The CH4/CO2 ratio maintains a constant level in the lower oxygenation
conditions but drops at the higher oxygen level.
0 1 2 3 4 0 0,5 1 1,5 2 2,5 0 5 10 15 20 25 30 CH 4 /CO 2 ra ti o Gas vo l. (ml ) Air headspace (ml) CH4 CO2 CH4/CO2 ratio
The gas generation observed in this experiment (BT 7) can be attributed to the hydrolysis of some recalcitrant or particle organic matter including biomass cells themselves, present in the inoculum. Oxygenation seemed to be helpful in degrading such particulate organic substrates. In previous batch experiments too, provided with headspace aeration, some extra biogas was probably generated from the hydrolysis products of inoculum particulate matter.
3.5 Other parameters
The total VFA content of the reactors measured at the end of the experimental durations were very low in all batch experiments (below 10 mg/L) and hence no significant variations with oxygen loads applied could be recognized. The reactor pH was also the same in all cases at near neutral and did not show any effect from oxygenation conditions. A slight increase in the particulate COD with increasing oxygen load was noted in all experiments, apparently due to the higher biomass yield.
4 CONCLUSIONS
It is concluded that low oxygenation levels can have positive impacts on bio-gasification under batch operating conditions when a non-soluble substrate is used as feed. Higher aeration levels have negative impacts on methane generation due to aerobic substrate consumption. All oxygenation levels have negative impact on methane generation from soluble substrates due to aerobic substrate consumption.
The biomass activity inhibition caused by aeration in an anaerobic culture is reversible; however, extensive continuous aeration can cause permanent culture destruction. Facultative organisms found in anaerobic digestion cultures, nevertheless, have a large potential to protect strict anaerobic organisms against oxygen inhibition under oxygen limiting conditions by efficient oxygen consumption.
ACKNOWLEDGEMENT
This study is funded by grants from the Research Council of Norway. Authors appreciate the support extended by the staff members of Telemark University College, including Laboratory Chief Engineer Hildegunn H. Haugen.
REFERENCES
[1] Zitomer, D. H., Shrout, J. D., 1998. Feasibility and benefits of methanogenesis under oxygen limited conditions. Waste Management, 18, 107-116.
[2] Ueki, A., Ono, K., Tsuchiya, A., Ueki, K., 1997. Survival of methanogens in air dried paddy field soil and their heat tolerance. Water Science and Technology, 36 (6-7), 517-522.
[3] Johansen, J. E., Bakke, R., 2006. Enhancing hydrolysis with microaeration. Water
Science and Technology, 53(8), 43-50.
[4] Chu, A., Mavinic, D. S., Kelly, H. G., Ramey, W. D., 1994. Volatile fatty acid production in thermophilic aerobic digestion of sludge. Water Research, 28 (7), 1513-1522.
[5] Botheju, D., Samarakoon, G., Chen, C., and Bakke, R., 2010. An experimental study on the effects of oxygen in bio-gasification; Part 1. In: Proceedings of the International Conference on Renewable Energies and Power Quality (ICREPQ 10), March, 2010,
Granada, Spain. Archived in Renewable Energies & Power Quality Journal (RE&PQJ), vol. 8.
[6] APHA, AWWA and WEF., 1995. Standard methods for the examination of water and wastewater, 19th edition, Washington DC, USA.
[7] Deublein, D., Steinhauser, A., 2008. Biogas from waste and renewable resources; An introduction. Wiley-VCH Verlag GmbH & Co. KGaA, Weinheim, Germany.
[8] Kato, M. T., Field, J. A., Lettinga, G., 1997. Anaerobic tolerance to oxygen and the potentials of anaerobic and aerobic cocultures for wastewater treatment. Brazilian J.