Radiological risk assessment for the
“Radon” type surface disposal facility
in Chisinau, Moldova
2019:12
Authors: Shulan XuXu Environmental Consulting AB Ryk Kłos
This report concerns a study which has been conducted for the Swedish Radiation Safety Authority, SSM. The conclusions and viewpoints pre-sented in the report are those of the author/authors and do not neces-sarily coincide with those of the SSM
Abstract
The long-term conditions and potential radiological consequences of the legacy radioactive waste stored in the RADON-type disposal facility outside Chisinau is of concern for the central government authorities of the Republic of Moldova. A radiological risk assessment of “zero alterna-tive scenario” for the RADON-type of near-surface disposal facility has been conducted. The objective of this risk assessment is to assess the long-term safety conditions of the facility and its potential radiological impact on humans and the environment as well as to provide a basis for decision making regarding the decommissioning of the legacy radioac-tive waste.
Based on the current state of the art, the procedures defined by IAEA’s standards and best practices the ISAM methodology and IAEA’s BIO-MASS methodology are adapted in this risk assessment. We use the site specific information as much as possible to derive the parameter values used in the assessment. Instead of using a stylised biosphere object the relevant biosphere object and associated catchment areas were identi-fied based on the site specific DEM (digital elevation model) using GIS tools. As to the relevant biosphere object we mean that the identified biosphere object is close to the disposal site boundary so as to avoid excessive spatial dilution and the size of the object is large enough to supply the dietary needs of at least a small family group.
The generation of scenarios has been conducted according to ISAM approach, which contains various state of the disposal and human behavior components for a generic RADON-type facility. A limited number of deterministic sensitivity analysis was performed to explore the model uncertainty and parameter uncertainty. The most important pessimistic assumptions and parameter values used in the assessment are as the following:
• no retardation of radionuclides in the waste material itself and the engineered barrier (concrete wall that is degraded at the initial sate) • the shortest possible transport distances of releases from the
dis-posal facility to a well or a stream
• the hydraulic gradient follows surface inclination • no sorption to waste mass in the flooding scenario
With pessimistic assumptions, the estimated doses from the calculation cases of the design scenario, i.e. for the well case and the stream case are lower than the IAEA’s criteria. Estimated doses for the on-site
resi-dence scenario after institutional control are higher than IAEA’s criteria. The results show that human intrusion activities after the institutional control can lead to radiological exposure above the level of 1 mSv/a for up to 100,000 years. Long lived radionuclide Pu-239 dominates the doses for the on-site residence scenario. Of course, the very conserva-tive assumptions used in the modelling of the on-site residence scenario can be discussed. Nevertheless, measures should be taken for this matter if the waste is at its present place of disposal.
The potential effects on non-human biota from exposure to released radionuclides were assessed. The stream case of the design scenario was considered. The maximum values of the radionuclide concentrations in fresh water and in soil were compared with Environmental Media Con-centration Limits (EMCL). If the ratio between the maximum values and EMCL is less than one no further assessments are required. For most of radionuclide concentrations calculated from the stream case are below one except C-14 and Pu-239 in freshwater.
Scenarios with high calculational consequences are obviously of inter-est though not necessarily because they are a true expression of radio-logical hazard. This first iteration has the primary function of assessing potential radiological impacts thereby identifying where better local information might reduce conservatism and lead to a more realistic expression of the assessment the radiological impact.
The disposal facility is located on the upstream area of Chisinau, which might be not an optimal choice of the site for a radioactive waste dis-posal.
2019:12
Authors: Shulan XuXu Environmental Consulting AB Ryk Kłos
Alexsandria Sciences Ltd, United Kingdom
Radiological risk assessment for the
“Radon” type surface disposal facility
in Chisinau, Moldova
Content
1. Introduction ... 2
2. Assessment context ... 5
2.1 Purpose of the assessment ... 5
2.2 International guidance ... 5
2.3 Assessment philosophy ... 6
2.4 Timeframes ... 6
3. System description and site characteristics ... 8
3.1 Description of the waste disposal facility ... 8
3.2 Site characteristics ... 10
3.2.1. Hydrogeological and Geotechnical conditions of studied site .. 10
3.2.2. Meteorological data ... 13
3.2.3. Land use ... 14
4. Preparation of the risk assessment ... 17
4.1 Selection of scenario ... 17
4.1.1. Design scenario ... 18
4.1.2. Alternative scenarios ... 20
4.1.3. Human intrusion scenarios ... 21
4.2 Identification of biosphere objects ... 21
4.3 Conceptual and Mathematical models ... 24
4.3.1. Modelling of design scenario ... 24
4.3.2. Modelling of human intrusion scenario ... 31
4.3.3. Modelling of alternative scenarios ... 36
4.4 Data compilation ... 36
4.4.1. Data used in evaluation of design scenario ... 36
4.4.2. Data used in evaluation of human intrusion scenarios ... 38
5. Results of the analyses ... 40
5.1 Results from the design scenario ... 40
5.2 Results from the human intrusion scenarios ... 42
5.2.1. The bathtubbing scenario ... 43
5.2.2. The on-site residence scenario ... 43
5.2.3. The road construction scenario ... 44
5.3 Results from the alternative scenarios ... 45
5.4 Results of the assessment for non-human biota ... 47
6. Discussions and conclusions ... 49
References ... 51
Appendix: Radionuclide and element dependent data ... 53
1. Introduction
The RADON-type Central Radioactive Waste Disposal Facility (CRWDF) was established by a special decree, issued by the Government of the USSR on 15 October, 1960. The architecture of the facility is similar to those which were established also in other Republics of the former Soviet Union. The disposal of radioactive waste in Moldova began in 1961.
The long-term conditions and potential radiological consequences of the legacy radioactive waste stored in the RADON-type disposal facility outside Chisinau (Special Facilities 5101, 5102) is of concern for the central government authorities of the Republic of Moldova. Radiological investigations performed by the
National Center of Preventive Medicine in 1998 showed increased contamination of radionuclides Sr-90 and Ra-226 of soil and groundwater in the vicinity of the disposal facility.
Swedidh Radiation Safety Authority (SSM) suported a collaborative project during 2017-2018 that aims at developing a site descriptive model for the near-surface disposal facility and its surroundings that could serve as a basis for
developing a radiological safety assessment. Site characterisation and compilation of inventory have been completed and documeted in three reports,
“Geomorphological and infrastructure assessment of the radiological object”, “Relevant data about the near-surface disposal facility “RADON” and the site RWMC in Chisinau” as well as “Hydrogeological and geotechnical conditions of radioactive waste deposit from Uzinelor 210 str. mum. Chisinau, objects 5101 and 5102”. Hereafter, they are mentioned as “Radiological Object Report”, “Site Report” and “Hydrogeological Report”.
Xu Environmental Consulting AB is requested by SSM to perform a radiological risk assessment of “zero alternative scenario” for the RADON-type of near-surface disposal facility. The objective of this risk assessment is to assess the long-term safety conditions of the facility and its potential radiological impact on humans and the environment as well as to provide a basis for decision making regarding the decommissioning of the legacy radioactive waste.
In this assignment we adopted ISAM and BIOMASS methodologies to perform the risk assessment for the RADON-type of near-surface disposal facility. In 1997, IAEA launched a Co-ordinated Research Project on Improvement of Safety Assessment Methodologies for Near Surface Disposal Facilities (ISAM). The particular objectives of the project were to:
• provide a critical evaluation of the approaches and tools used in post-closure safety
assessment for proposed and existing near-surface radioactive waste disposal facilities;
• enhance the approaches and tools used;
The project ran until 2000 and resulted in the development of a harmonized assessment methodology (see Fig. 1), the ISAM project methodology (IAEA 2004a,b), which was applied to a number of test cases. The ISAM project primarily focused on developing a consensus on the methodological aspects of safety assessment, especially i) specification of the assessment context, ii) description of the waste disposal system, development and justification of scenarios, iii) formulation and implementation of models and iv) analysis of results and building confidence. However, given the resource constraints
illustration of the application of the methodology is limited, for instance, for the RADON Test Case, which prevented detailed study of the system and collection of many site specific data that would be available in a real assessment.
The IAEA Programme on BIOsphere Modelling and ASSessment (BIOMASS) was launched in 1996 (IAEA 2003a). The programme was concerned with developing and improving capabilities to predict the transfer of radionuclides in the environment. The objective was to develop the concept of a standard or reference biosphere for application to the assessment of the long-term safety of repositories for radioactive waste (see Fig. 2).
2. Assessment context
This chapter describes the performance of the first step, Assessment Context according to the ISAM methodology (see Fig. 1).
2.1 Purpose of the assessment
The long-term conditions and potential radiological consequences of the legacy radioactive waste stored in the RADON-type disposal facility outside Chisinau (Special Facilities 5101, 5102) is of concern for the central government authorities of the Republic of Moldova. Radiological investigations performed by the
National Center of Preventive Medicine in 1998 showed increased contamination of radionuclides Sr-90 and Ra-226 of soil and groundwater in the vicinity of the disposal facility.
The objective of this risk assessment is to assess the long-term safety conditions of the facility and its potential radiological impact on humans and the
environment as well as to provide a basis for decision making regarding the decommissioning of the legacy radioactive waste.
2.2 International guidance
Currently the legal framework in the field of radioactive waste managemewnt in Moldova is under development. For the time being, there are no legal
requirements for undertaking risk assessments for near-surface disposal facilities in Moldova. Therefore, this risk assessment is based on the international standards and best practices.
The specific criteria of the near-surface disposal set in IAEA SSR-5 (IAEA 2011) are:
• A disposal facility (considered as a single source) is so designed that the calculated dose or risk to the representative person who might be exposed in the future as a result of possible natural processes affecting the disposal facility does not exceed a dose constraint of 0.3 mSv in a year or a risk constraint of the order of 10-5 per year.
• In relation to the effects of inadvertent human intrusion after closure, if such intrusion is expected to lead to an annual dose of less than 1 mSv to those living around the site, then efforts to reduce the probability of intrusion or to limit its consequences are not warranted.
• If human intrusion were expected to lead to a possible annual dose of more than 20 mSv (see ICRP 2007, Table 8) to those living around the site, then alternative options for waste disposal are to be considered, for example,
disposal of the waste below the surface, or separation of the radionuclide content giving rise to the higher dose.
• If annual doses in the range 1–20 mSv (see ICRP 2007, Table 8) are indicated, then reasonable efforts are warranted at the stage of
development of the facility to reduce the probability of intrusion or to limit its consequences by means of optimization of the facility’s design.
The key components of the methodology for the radiological impact assessment after closure set in International Atomic Energy Agency SSG-29 (IAEA 2014) are:
• A systematic description of the disposal system;
• Identification of the various features, events and processes that may affect how the facility will perform and evolve;
• Identification of scenarios for evolution of the site;
• Conceptual, numerical and computer models of relevant parts of the disposal system (e.g. the waste in the near field, the engineered barriers, the host rock and the surface environment of the facility).
2.3 Assessment philosophy
In order to provide a basis for decision making regarding the decommissioning of the legacy radioactive waste this assessment is supposed to use as much site specific data as possible. SSM suported a site investigation project during 2017-2018 that aims to develop a site descriptive model for the near-surface disposal facility and its surroundings. The site investigation was documented in three reports as mentioned previously. Furthermore, instead of using a stylised biosphere object as recommended in the ISAM approach a realistic biosphere object based on site specific topographic information was identified (details are given in section 4.2).
The main endpoints of the assessment are calculated annual effective doses to humans and environmental concentrations. The calculated annual effective doses are compared with the specific criteria given in section 2.2 and environmental concentrations are compared with Environmental Media Concentration Limits (Brown et al., 2014).
2.4 Timeframes
In this assessment, like the most of safety assessments (IAEA 2004a), a 300 year institutional control period is assumed. Fig. 3 illustrates the radioactivity as a function of time. As can be seen in the figure, Cs-137 dominates radioactivity at the beginning but decays to an insignificant level after 100 years. After that
Pu-239 dominates. It has been shown in the figure that 4% of the total activity re-mains after 100 000 years.
Fig. 4 shows the radiotoxicity as a function of time. One way to describe the radi-oactivity is by calculating the committed effective dose from ingestion of radionu-clides directly. The radiotoxicity of the nuclear waste can be considered as a basis for the risk assessment timescale. The radiotoxicity in the waste disposed in the disposal facility is dominated by long-lived radionuclide Pu-239. Fig. 4 shows that about 10% of radiotoxicity remains after 100 000 years.
Fig. 3 Percentage contribution to the total activity as a function of time.
3. System description and site
characteristics
This chapter describes the whole system that includes descriptions of the disposal facility and the site characteristics according to the ISAM methodology (see Fig. 1).
3.1 Description of the waste disposal facility
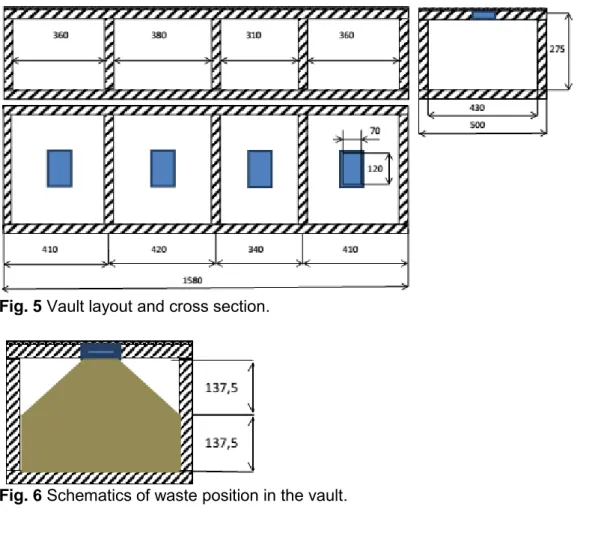
In the Site Report the radioactive waste disposal facility is described. The facility essen-tially consists of four reinforced concrete vaults for solid waste disposal and covers an area of 75 m2 (15 m 5 m). As the depth of the Vaults is 3 m, the total disposal capacity reaches 225 m3 (see Fig. 5).
The Vaults are covered by prefabricated reinforced concrete panels (width about 80 cm, height about 24 cm). The panels were placed on the concrete crown (about 8 cm height) of Vaults. The gaps of about 10 cm width between two panels were sealed with cement mortar (concrete). In the middle of the top of the Vaults there are opening lids to load the waste. The size of the lid is about 900 1400mm, the size of the opening covered by the lid is about 700 1200 mm (see Fig. 6). With the assumption of the 35 cm wall thickness around the Vaults and between the compartments, the inner side lengths of the Vaults would be respectively 360, 380, 310, 360 cm, and the width is 430 cm. Based on the pictures taken on the inner content of Vault IV, the depth of the Vault would be about 2.75 m. So the capacity of the four Vaults could be estimated re-spectively 42, 45, 36 and 42 m3. The total capacity estimated is about 165 m3. Regard-ing the shape and position of the loadRegard-ing hole, the Vault cannot be filled completely, since wastes were only thrown in through the opening without special placement measures.
Hence Vault I, II and IV could be filled by about 30 m3 of waste each, while Vault
III could be filled up by about 20 m3 waste. Taking into account that Vault III is filled up only by 70 % of its capacity, and Vault IV contains only 1 m3 waste, the total volume occupied by the disposed waste is about 75 m3.
Four vaults do not provide satisfactorily isolation (see Fig. 7). According to the operator’s narration the elevated groundwater table was observed inside the vault IV during the late ’90s (Site Report, p. 95). As mentioned previously,
radionuclides Sr-90 and Ra-226 in soil and groundwater in the vicinity of the disposal facility were detected by the National Center of Preventive Medicine in 1998.
Fig. 5 Vault layout and cross section.
Fig. 6 Schematics of waste position in the vault.
Fig. 7 Condition of the facility (Site Report, p.88).
The activities of the isotopes are summarized for each vault and each waste form. The waste packages are mainly categorised in three categories:
• Unstable waste form, • Stable waste form,
• Disused Sealed Radiation Source (DSRS)
3.2 Site characteristics
The near-surface disposal facility is located in the Chisinau municipality, and the territory adjacent to the facility falls within the limits of the city, Chisinau on an area of 454.83 ha. The location of the disposal facility is shown bordered by the white boundary and the studied site by the red boundary (see Fig. 8).
3.2.1. Hydrogeological and Geotechnical conditions of studied site
Hydrogeological Report describes hydrogeological and geotechnical conditions at the site. The surface is characterized by the different inclination (see Fig. 9) from middle (between 3 and 6 grade) to intensive slope inclination (more 6 degrees). The neighbouring territory is characterized mostly by high inclination (more 6 de-grees). The elevation in the internal territory of the site varies from 81 to 118 m. The outside neighbouring territory is characterized by the altitude from 81 to 130 m. The greatest slopes are found towards the south and east part of the studied ter-ritory.
Fig. 8 Map of the site. The location of the disposal facility is shown bordered by
the white boundary.
The upper part of geological section is characterized by small thickness of Quater-nary loam and Neogene sandy-clay formation. These rocks are covered by agri-culture (layer 1) and artificial (layer 2) soils. Quaternary loam (layer 3) has no subsidence properties. Neogene formation represented by sandy loam (layers 4, 7) layered with clay and clay layered with sands (layers 5, 6). Upper part of clays, which is located at slope with intense inclination, is intensively fractured. The lo-cation of geological layers is presented in the geological section (Fig. 10). This clay is dense, dry, semi dry, fractured, with fine sand layers and carbonate inclu-sions. The groundwater can seasonally form at shallow depth (under flooding) due to the presence of clays at shallow depth (3-4 m).
The hydraulic conductivity (filtration coefficient) varies from 0.1 to 1.0 m/day for sandy loam in the aeration zone and from 0.5 – 1.5 m/day in water saturated zone. The clay with sand layers has different values in horizontal and vertical directions. The porosity is about 0.4. The filtration coefficient of horizontal oriented fine sand layers ranges from 0.2 to 0.5 m/day. The filtration coefficient for clay layers
is changed from below of 0.001 m/day for dense clay layers to 0.4 /day for frac-tured clay layers. The filtration characteristic of the aeration zone varies over a large interval and depends of the degree of the fracturing and stratification. The groundwater is situated on the different levels: from 1.5 to 11.0 m (altitude 81.0 – 88.6 m above the sea level, WGS84). The raising of groundwater level is indicated after its appearance to 1.3 – 1.8 m. The appearance of the shallow groundwater layer is possible in the wet season, which is not a favourable factor for the slope stability. The principal water bearing rocks are sandy loam, which are in fluid consistence (liquid state according to Atterberg limits) in water satu-rated zone. Groundwater is aggressive to concrete according to water quality anal-ysis: sulphates 955 mg/L, hydrocarbonate 8.11 mg-eq/L.
Rocks were separated into four geotechnical elements (GE): • GE I – quaternary loam (layer 3);
• GE II – fractured neogene clay (layer 5); • GE III – sandy loam (layer 4);
• GE IV – neogene dense clay (layer 6).
Fig. 10 Geological section by line I-I’ (shown in Fig. 9)
3.2.2. Meteorological data
In the Republic of Moldova, the systemic observations on climate indices started in 1886 and have continued via the hydro-meteorological monitoring network of the State Hydrometeorological Service (Site Report).
The nature of observed climate changes in the Republic of Moldova was identi-fied through the trends and variability of basic climatic indices (The Third Na-tional Communication of the Republic of Moldova under the United Nations Framework Convention on Climate Change. Ministry of Environment of the Re-public of Moldova/ UNDP Environment. - Ch.: "Imprint" Plus Ltd.2013 - 413 p). Observations of air temperature and precipitation contains the spatial distribution of monthly, seasonal and annual average values. Fig. 11 shows linear trends in the evolution of mean air temperature (oC/year - left side), and precipitation (mm/year - right side) for two instrumental observation time spans at Chisinau Meteorologi-cal Station (Site Report).
The climate of the Republic of Moldova is moderate-continental and is character-ized by mild and short winter, with little snow and long-lasting summer, with a low amount of precipitation. The average annual air temperature is 8-10° C, the highest temperature is +41.5 °C and the lowest temperature is −35.5 °C.
According to the available information on the meteorological conditions at the disposal site, an average precipitation of 573 mm/y, maximum precipitation of 744 mm/y and minimum precipitation of 425 mm/y. For the vegetated area around
the repository a value of 80% has been selected to represent normal evolution evapotranspiration conditions.
For future climate, projections of climate scenarios for the Republic of Moldova suggest that what is considered as extreme rare events for absolute maximum tem-peratures of 34-35°C for the baseline period of 1961-1990 will possibly become mean maximum summer temperatures. Projections for Europe more generally in-dicate that the risk of floods increases in Northern, Central and Eastern Europe and that today’s 100 –year droughts will return every 50 years especially in Southern and South-Eastern Europe, including in the Republic of Moldova (Lehner et al., 2006).
oC/year mm/year
Fig. 11 Linear trends in the evolution of mean air temperature (oC/year - left side),
and precipitation (mm/year - right side) for two instrumental observation time spans at Chisinau Meteorological Station (dashed line: 1887-1980 and continuous line: 1981-2010)
3.2.3. Land use
The general characterization of land use on the site is shown in Table 2. The ob-tained data shows the dominance of the infrastructure land, which represents 42.8% of the total area. Agricultural land is the second largest, with 38.1% and the non-agricultural ones with a share of 19.1% (Table 2). Spatial spread by mode of use is shown in Fig. 10a.
The land for agricultural use within the site includes 108 objects with a total area of 219,163 ha (Table 3). Five categories of land are found in the site: arable, pas-ture, fruit plantations and individual lots. The arable land category has the largest spread, constituting 59.2% of the agricultural land (see Fig. 10b and Table 3). In-dividual (back-up) lots account for 21.7%, 16.6% of the agricultural land was planted with fruit trees. Grassland occupies only 2.5% of agricultural land.
Table 2 General characterization of non-agricultural use Use Nr. of objects Surface, Ha % of total object surface agricultural 108 219.163 38.1 nonagricultural 100 109.912 19.1 Infrastructure 123 245.973 42.8 TOTAL 331 575.05 100
Table 3 General characterization of agricultural use
Category of use Nr. of objects Surface, Ha
% of total agricultural sur-face Arable 49 129.643 59,2 pastures 3 2.58 2,5 Fruit trees 48 36.43 16,6 Individual lots 8 47.52 21,7 TOTAL 108 219.163 100
Fig. 12 Land map a) by usage mode; b) by agricultural categories
a)
4. Preparation of the risk
assess-ment
This chapter describes the performance of Steps 3 and 4 according to the ISAM methodology (Fig. 1) as well as identification of biosphere system according to BIOMASS methodology (Fig. 2).
4.1 Selection of scenario
In SSG-23 (IAEA, 2012), it states that “scenarios are used to describe possible evolutions of the disposal system and its environment. The potential migration of radioactive substances from the disposal facility, their movement in the environ-ment and resulting radiation risks are quantitatively analysed by means of con-ceptual and mathematical models.”
In ISAM project a systematic assessment framework has been developed to pro-vide a formal basis for both performance assessment and external review of the logic of the underlying assumptions adopted in a safety case. This approach helps to provide assurance that the assessment has effectively addressed all potentially relevant Features, Events and Processes (FEPs) and taken account of the ways in which combinations of these FEPs might produce qualitatively different out-comes. The systematic approach also provides the setting for demonstrating how uncertainties associated with the future evolution of the disposal system have been addressed and assimilated into the safety case.
A list of FEPs relevant to the assessment of long term safety of near surface dis-posal facilities developed in the ISAM project can be found in the Appendix C of IAEA (2004a). Scenario generation approaches were defined and applied in three ISAM Test Cases, namely for safety assessment of RADON, vault and borehole test cases.
The basis of the approach adopted by the RADON Test Case to generate scenarios might be summarized as the following:
• Screen the ISAM FEPs list on the basis of the assessment context and sys-tem description;
• Develop and agree a simplified Base Scenario as the main case of the safety assessment;
• Identify a limited number of representative Alternative Scenarios rather than comprehensively identify every possible alternative scenario by revis-iting the screened ISAM FEPs list, especially focusing on the external FEPs.
• Identify a limited number of scenarios due to inadvertent intrusion of dis-posal facilities after the institutional control
An example of a formal approach to developing a set of generic post-closure scenarios is illustrated in Fig. 13.
Different terms are used to categorize scenarios in international safety standards, national regulations and international projects. In ISAM approach scenarios are divided into three groups, Design Scenario, Alternative Scenario and Human In-trusion Scenarios. The Design Scenario is defined as that geosphere and biosphere conditions remain as they are at present and a normal evolution of the engineering barriers and near field. The Alternative Scenarios are defined as naturally dis-turbed performance (erosion, flooding, earthquake, earth creep, frost heave, plant and animal intrusion). Human Intrusion Scenario is defined as human intrusion in-cluding road construction, house building and agriculture on site.
Combing the approach illustrated in Fig. 13, 14 and the site specific conditions we are able to select scenarios for this assessment. Calculation cases included in the scenario are defined to assess uncertainties. Descriptions of selection of scenarios and calculation cases are given below.
4.1.1. Design scenario
The design scenario is based on the probable evolution or also called reference evolution of external conditions, and realistic, or, where justified, pessimistic as-sumptions with respect to the internal conditions. From the map of slope gradients (Fig. 8) one can see that the disposal facility is located on a relatively high alti-tude. This means that the disposal facility could be a recharge area. The design scenario, SCE1 with the initial state that the engineered barrier is partly degraded is selected where a small farm system is located downstream of the disposal facil-ity. Identification of the farm system is given in section 4.2. This design scenario or also called leaching scenario is a relevant type of normal evolution scenario. The use of a farm system is a means to ensure that a comprehensive range of ex-posure pathways is assessed. Two variant calculation cases can be defined, a well exposure pathway and a stream exposure pathway.
Fig. 13 The RADON Test Case Scenario Generating Approach (IAEA 2004,
Fig. 14 Generation of a Set of Scenarios (SCE) According to Various States of
the Disposal and Human Behaviour Components (IAEA 2004a)
4.1.2. Alternative scenarios
Scenarios that may deviate the reference evolution for the long-term safety of the disposal facility are selected as alternative scenarios. Since the main safety func-tion for the existing facility is the concrete walls of the vault, possible routes to vi-olation of the safety function are used to identify the alternative scenarios. Ac-cording to the Site Report “there is a danger of land flooding in torrential rainfall or snow melting during the winter/spring season”. The precipitation data has been recorded in the Republic of Moldova in the period 1891-2010. The data shows that the mean value of annual precipitation is 540 mm. The most significant value of annual precipitation, 915 mm, was recorded in 1912 and 531 mm for summer season in 1948. Another external event mentioned in the Hydrogeological Report is that “Thus we can conclude that groundwater formation at high inclination slope will provoke landslide events on studied site.”
Thus, the flooding scenario and landslides scenario are selected as the alternative scenarios.
4.1.3. Human intrusion scenarios
Three human intrusion scenarios are selected according to Fig. 14 to assess the disturbed evolution of the disposal facility i.e., i) on-site residence and contamina-tion by leachate (bathtub effect, SCE4); ii) the on-site residence scenario (SCE6); iii) the road construction scenario (SCE7) in order to illustrate the damage to hu-mans intruding into the disposal facility after institutional control.
4.2 Identification of biosphere objects
The BIOMASS methodology (IAEA 2003a) was illustrated with Example Refer-ence Biospheres (ERBs) using generic biosphere models. ERB2b model deals with the discharge of contaminated groundwater or surface water to overburden media in the biosphere (see Fig. 15), which has similarities to the farm system to be considered in the SCE1. The dimensions of biosphere objects are important since the total area largely determines the overall water balance in the landscape and has significant impact on the final calculated doses.
In this assessment the GIS tool Global Mapper 19.11 is used to obtain catchment
areas consistent with local topography and identify the relevant object areas based on the site specific DEM (digital elevation model) data provided in the Radiologi-cal Object Report. The details of identification of catchment areas can be found in Guerfi et al., (2018).
Fig. 16 shows identified catchments and streams on the map of the site. The dis-posal facility is within a single catchment of area 1140907 m2 (green shading). Just south of the flow system outlet from this landscape object there is a conflu-ence with the watershed to the west, with area 1453830 m2 (red shading). The area for the dose calculations would be located in the southern area (purple). This co-vers a large area but the focus is on the area downslope from the confluence of the streams. The water balance of the object can be conservatively derived from the red and green areas, areas are listed in Table 4. The distance between the disposal facility to the nearest stream is about 50 m.
Fig. 15 Site-generic interpretation of a stylized landscape dose objects.
Illustra-tion of the ERB2b catchment, (IAEA 2003a, Figure C11.3).
Fig. 16 Catchments and streams around the disposal site
Table 4 Areas of subcatchments in the map in Fig. 15.
landscape area
enclosed area
m2
Disposal site catchment (green) 1.1E+06
Western catchment (red) 1.5E+06
When identifying the candidate areas for the radiological objects the requirement is to determine locations in the landscape where the highest concentrations of ra-dionuclides remobilised from the disposal facilty can occur and then to set poten-tial exposure pathways, as defined in SCE1. The focus is therefore on areas as close to the disposal site boundary as possible.
The aim of the identification is to define areas in the landscape for potential expo-sure, they need not necessarily correspond to identified areas in the present day landscape. The procedure is as follows:
1. Look for potential areas in the landscape (aided by the orthophoto) and the and the map
2. Candidate areas should be
a. Close to the main drainage path as identified from analysis of the DEM, since radionuclides leached from the repository will be transported in the flowing surface and groundwater. If wells are considered in the modelled system placing the objects close to the axis of the drainage system means that the concentration in the lo-cal near-surface aquifer will not be underestimated
b. Close to the site boundary so as to avoid excessive spatial dilution c. Large enough to supply the dietary needs of at least a small family group of, say, four adults. This is typically up to 2×10⁴ to 105 m2. 3. Account should be taken of the confluence of drainage systems from
dif-ferent water sheds
The two candidate objects are indicated in Fig. 17. The first object is closest to the site boundary an is situated on the land adjacent to the drainage stream that runs through the waste site itself and is along the stream boundary of the drainage sys-tem of the western catchment. The second object is identified by an area along the valley floor of the combined drainage stream. The areas of the two objects are, re-spectively, 2.1E+04 m2 and 1.8E+04 m2.
According to the landuse map (Fig. 12) the area of object 1 is currently agricul-tural land with woodland along the stream location. It is selected as the closest lo-cation with potential for cultivation to the site boundary. The distance between the object 1 and the disposal facility is about 300 m.
Object 2 is classed as non-productive land and natural pasture. For assessment purposes there appears to be no reason why the two areas could not be cultivated, although the land area close to the stream path is relatively steep. According to the orthophoto, the drainage system is not necessarily above ground so a well in the two areas, used for cultivation purposes is the most realistic approximation.
4.3 Conceptual and Mathematical models
4.3.1. Modelling of design scenarioThe conceptual model for the design scenario is shown in Fig. 18. A time period for concrete degradation is assumed as 500 years (IAEA 2003b). In this assess-ment it is considered that the concrete wall has been partly degraded at the initial state since it is mentioned in Chapter 1 that leakages of radionuclides in the vicin-ity of the disposal facilvicin-ity was detected in 1998. In the simulation 10% of infiltra-tion as the initial value is assumed and the infiltrainfiltra-tion increases linearly to 100% at 500 years.
Two variant calculation cases of SCE1 were defined, a well case and a stream case. The first calculation case was assumed that infiltrating water down to the aq-uifer migrates along groundwater into a well (see Fig. 19). The second calculation case was assumed that the clay later overlying the aquifer was continuous and so a perched aquifer was assumed to be present above the clay since the layer 3 below the surface layer (layer 2) has more dense property (see Fig. 10). It was assumed that infiltrating water migrates along this perched aquifer, rather than infiltrating down into the aquifer, and discharging into the stream (see Fig. 20). Release mechanisms, transport media and exposure mechanisms for these two calculation cases are identified in Table 5.
In the ISAM approach transport in the biosphere is not modelled dynamically (IAEA 2004a). For the purposes of long-term assessments of radioactive waste disposal, concentrations of radionuclides in certain biosphere media (for example the atmosphere, crops and animals) can often be assumed to be in equilibrium with their donor media. For example, the concentration in a crop grown in the soil can be assumed to be in equilibrium with the concentration in the soil and any irri-gation water applied. It is believed that this approach is valid because the pro-cesses affecting the concentrations in such media are rapid compared with those affecting concentrations in the donor media, particularly because of the long-term nature of the release.
A compartment model structure is used to describe the transport processes for the disposal system. A compartment model is an approximation since it is a discreti-sation of continuous transport process and radionuclide concentrations. Generally speaking increasing the number of compartments increases the accuracy of the re-sults, but at the cost of modelling time and model complexity. Further guidance on discretisation of compartment models is available elsewhere (e.g. Kirchner, 1998; Xu et al., 2007).
(a) 3D-map
(b) 2D map
Fig. 17 Candidate areas for potential radiological objects. With reference to the
Fig. 18 Conceptual model for the design scenario (IAEA 2004, Volume I).
Fig. 19 Constructed compartmental model of radionuclide transport for the
Fig. 20 Constructed compartmental model of radionuclide transport for the
calcu-lation case of river exposure pathway of SCE1
Table 5 Release mechanisms, transport media and exposure mechanisms for these two
calculation cases of design scenario, SCE1
Scenario (calcula-tion cases) Contami-nant Release Mecha-nisms Contami-nant Release Media Contami-nant Transport Media Contami-nant Transport Mecha-nisms Human Exposure Mecha-nisms SCE1: Leaching (well expo-sure path-way)
Leaching Leachate Solute in
groundwater Well (irriga-tion, drinking) Soil Crops Cows Atmosphere (dust) Advection Dispersion Water ab-straction for irrigation and drinking water Root uptake Adsorption Ingestion of water, pas-ture and soil by cows Leaching Erosion Ingestion of water, crops, and animal pro-duce Inhalation of dust External irradiation from soil SCE1: Leaching (river water pathway)
Leaching Leachate Solute in
perched wa-ter River (irriga-tion, drinking) Soil Crops Animals (cows and fish) Atmosphere (dust) Advection Dispersion Water ab-straction for irrigation and drinking water Root uptake Adsorption Ingestion of water, pas-ture and soil by cows Leaching Erosion River flow Ingestion of water, crops, and animal pro-duce Inhalation of dust External irradiation from soil
The ordinary differential equation (OED) for each model compartment (N) may include inflows from outside the system (source), outflows from the system (sink) and transfer of radionuclides between connected compartments, decay and in-growth of the radionuclide. For the ith compartment, the ODE of a compartment (k) has the following general form:
𝑑𝑁𝑖 𝑑𝑡 = [∑ 𝜆𝑗𝑖𝑁𝑗 𝑗≠𝑖 + 𝜆𝑁𝑀𝑖 + 𝑆𝑖(𝑡)] − [∑ 𝜆𝑖𝑗𝑁𝑖+ 𝜆𝑁𝑁𝑖 𝑗≠𝑖 ] Eq. (1)
where i, j indicate compartments; N, M are the amounts [Bq] of radionuclides N and M in a compartment (M is the precursor of N in a decay chain); S(t) is a time dependent external source of radionuclide N, [Bq/y]; λ., λN is the decay constant
for radionuclide N (in 1/y); and
λji , λij are transfer coefficients [1/y] representing the gain and loss of radionuclide
N from
compartments i and j.
For the calculation case of well exposure pathway, the transfer coefficient leach,barrier is expressed as:
𝜆𝑙𝑒𝑎𝑐ℎ,𝑤𝑎𝑠𝑡𝑒 =
𝑄𝑖𝑛 V
Eq. (2)
where Qin is the infiltration flow rate [m3/y], which is a product of infiltration qin
[m/y] and the surface area of the disposal facility Afacility [m2] ; V is the volume of the disposal facility [m3].
Here, we assume that there is no retardation of radionuclides in the waste material itself and the engineered barrier (concrete wall that is degraded at the initial state), which is a pessimistic assumption.
The transfer coefficient leach,unsat is expressed as: 𝜆𝑙𝑒𝑎𝑐ℎ,𝑢𝑛𝑠𝑎𝑡 =
𝑞𝑖𝑛 𝜃εDR
Eq. (3)
where qin is infiltration [m/y], is the effective porosity in the medium [-]; is the
degree of saturation of the medium; D is depth of the medium through which the radionuclide is transported [m]; R is the retardation coefficient given by:
𝑅 = 1 +𝜌𝑢𝑛𝑠𝑎𝑡𝐾𝑑 𝜀𝜃
Eq. (4)
where unsat is the bulk density of the medium [kg/m3]; Kd is the sorption coeffi-cient of the medium[m3/kg], is the degree of saturation of the medium.
Transport of solute in the aquifer in general is described by an advection-disper-sion partial equation. The compartmental model can be used to approximate the solution of this solute transport problem. Xu et al., (2007) shows that discretisa-tion of a transport path into a few number of compartments results in a soludiscretisa-tion that is still close to the analytical solution, and the amount of numerical dispersion is similar to the amount of physical dispersion. The rule of thumb is the number of compartments required should exceed Pe/2, where Pe is the Peclet number. As can be seen in Fig. 19 and 20, five compartments are used in the modelling. The trans-fer coefficient A,ij is expressed as
𝜆𝐴,𝑖𝑗 = 𝑞
𝐿 𝑛⁄ 𝜃𝑤𝑅𝑤
Eq. (5)
where L is the total transport length [m]; n is a number of compartments [-]; w is the porosity of the medium [-]; R is the retardation coefficient of the medium [-]; q is Darcy velocity given by
𝑞 = −K∂H
𝜕𝑥
Eq. (6)
where K is the hydraulic conductivity of the medium [m/y]; H/x is the hydraulic gradient [-].
Once the radionuclide discharge fluxes to either the well or stream are determined the activity concentrations for well water Cwell or stream water Criver can be deter-mined: 𝐶𝑤𝑒𝑙𝑙 = 𝐴𝑚𝑜𝑢𝑛𝑡𝑤 𝜃𝑤𝑉𝑤𝑅𝑤 Eq. (7)
where Amountw is the amount of the radionuclide in the well (flux discharged to the well) [Bq]; Vw is the volume of the compartment representing the well [m3].
𝐶𝑟𝑖𝑣𝑒𝑟 =
𝐴𝑚𝑜𝑢𝑛𝑡𝑤
(𝑃𝑟𝑒𝑐 − 𝐸𝑇)𝐴𝑟𝑒𝑎𝑐𝑎𝑡𝑐ℎ𝑚𝑒𝑛𝑡
Eq. (8)
Where Prec is precipitation [m/y]; ET is evapotranspiration [m/y]; Areacatchment is the area of the catchment [m2].
The dose to a member of the critical group for these two calculation cases of the design scenario can be expressed as (in [Sv/y):
𝐷𝑜𝑠𝑒 = 𝐷𝑜𝑠𝑒𝑖𝑛ℎ+ 𝐷𝑜𝑠𝑒𝑒𝑥𝑡+ 𝐷𝑜𝑠𝑒𝑖𝑛𝑔 Eq. (9)
where Doseinh, Doseext and Doseing are the doses due to the inhalation, external ex-posure and the ingestion pathways [Sv/y].
The dose due to inhalation is expressed as: 𝐷𝑜𝑠𝑒𝑖𝑛ℎ = 𝐴𝑠𝑜𝑖𝑙∙ 𝑏𝑟∙ 8766
∙ [𝑑𝑢𝑠𝑡𝑎𝑐𝑡%𝑜𝑐𝑐𝑢𝑝+ 𝑑𝑢𝑠𝑡𝑛𝑜𝑟𝑚(1 − %𝑜𝑐𝑐𝑢𝑝)]𝐷𝐹𝑖𝑛ℎ
Eq. (10)
Where br is the breathing rate [m3/h]; 8766 are the hours in a year [h/y]; dustact
and dustnorm are the dust concentrations during ploughing and non-ploughing ac-tivities [kg/m3]; %occup is the occupancy factor for ploughing activities [-]; DFinh
is the dose factor for inhalation [Sv/Bq]; Asoil is the concentration of the radionu-clide in the soil [Bq/kg], which can be expressed as:
𝐴𝑠𝑜𝑖𝑙 = 𝐶𝑤𝑎𝑡𝑒𝑟 𝑖𝑟𝑟 𝜌𝑠𝑜𝑖𝑙⋅ 𝑇ℎ𝑠𝑜𝑖𝑙
Eq. (11)
where irr is the irrigation rate [m/y]; soil is the soil dry bulk density [kg/m3]; Thsoil
is the soil thickness [m]; Cwater is the radionuclide concentration in the water [Bq/m3], which can be well water or stream water (see Eq. 7 and 8) depending on the calculation cases.
The dose due to external exposure is expressed as
𝐷𝑜𝑠𝑒𝑒𝑥𝑡 = 𝐴𝑠𝑜𝑖𝑙⋅ 8766 ⋅ 𝐷𝐹𝑒𝑥𝑡 Eq. (12)
where DFext is the external exposure dose factor [Sv/h per Bq/kg]. The dose due to ingestion is expressed as:
𝐷𝑜𝑠𝑒𝑖𝑛𝑔 = 𝐷𝑜𝑠𝑒𝑖𝑛𝑔_𝑤𝑎𝑡𝑒𝑟+ 𝐷𝑜𝑠𝑒𝑖𝑛𝑔_𝑐𝑟𝑜𝑝+ 𝐷𝑜𝑠𝑒𝑖𝑛𝑔_𝑎𝑛𝑖𝑚𝑎𝑙 Eq. (13)
where Doseing_water is the dose due to water ingestion [Sv/y] 𝐷𝑜𝑠𝑒𝑖𝑛𝑔_𝑤𝑎𝑡𝑒𝑟 = 𝐼𝑛𝑔𝑤𝑎𝑡⋅ 𝐶𝑤𝑎𝑡𝑒𝑟 1
1 + 𝐾𝑑𝑤∙ 𝑝𝑎𝑟𝑡⋅ 𝐷𝐹𝑖𝑛𝑔
Eq. (14)
where Ingwat is the individual ingestion rate of freshwater [m3/y]; and DFIng is the
dose coefficient for ingestion [Sv/Bq]; Kdw is the distribution coefficient for wa-ter/particles [m3/kg]; and part is the suspended particle concentration [kg/m3] in the water (assumed to be zero for well water.
𝐷𝑜𝑠𝑒𝑖𝑛𝑔_𝑐𝑟𝑜𝑝 = ∑ [𝐼𝑛𝑔𝑐𝑟𝑜𝑝(𝐴𝑠𝑜𝑖𝑙⋅ 𝑇𝐹𝑐𝑟𝑜𝑝)𝐷𝐹𝑖𝑛𝑔]
𝑟𝑜𝑜𝑡,𝑔𝑟𝑒𝑒𝑛,𝑔𝑟𝑎𝑖𝑛
Eq. (15)
where Ingcrop is the consumption rate of crop including root vegetables, green veg-etables and grain [kg/y]; TFcrop is the soil to plant concentration factor for the crop
including root vegetables, green vegetables and grain [Bq/kg fresh weight per Bq/kg dry soil].
The dose due to animal product consumption is expressed as 𝐷𝑜𝑠𝑒𝑖𝑛𝑔_𝑎𝑛𝑖𝑚𝑎𝑙
= ∑ [𝐼𝑛𝑔𝑎𝑛𝑖𝑚𝑎𝑙(𝑞𝑤𝑎𝑡𝑒𝑟𝐶𝑤𝑎𝑡𝑒𝑟+ 𝑞𝑠𝑜𝑖𝑙𝐴𝑠𝑜𝑖𝑙
𝑏𝑒𝑒𝑓,𝑚𝑖𝑙𝑘
+ 𝑞𝑝𝑎𝑠𝑡𝑢𝑟𝑒𝐴𝑠𝑜𝑖𝑙𝑇𝐹𝑝𝑎𝑠𝑡𝑢𝑟𝑒) × 𝑇𝐹𝑎𝑛𝑖𝑚𝑎𝑙𝐷𝐹𝑖𝑛𝑔]
Eq. (16)
where Inganimal is the annual animal product consumption rate (beef or milk) [kg/y]; qwater is the daily animal water intake [m3/day]; qsoil is the daily animal soil intake [kg/day] qpasture is the daily animal pasture intake [kg/day]; TFpasture is the soil to plant concentration factor for the pasture [Bq/ kg fresh weight per Bq/kg dry soil]; TFanimal is the transfer coefficient to the animal product [day/kg].
4.3.2. Modelling of human intrusion scenario
As mentioned earlier three human intrusion scenarios are selected, namely on-site residence and contamination by leachate (bathtub effect) SCE4, the on-site resi-dence scenario SCE6 and the road construction scenario SCE7 (see Fig. 14). The conceptual models for these three scenarios are shown in Fig. 21 – 23. Release mechanisms, transport media and exposure mechanisms for these three scenarios are identified in Table 6.
Fig. 21 Simplified representation of the conceptual model for the Post-closure
Fig. 22 Simplified representation of the conceptual model the Post-closure
On-site Residence Scenario SCE6 (IAEA 2003b)
Fig. 23 Simplified representation of the conceptual model the Post-closure Road
Table 6 Release mechanisms, transport media and exposure mechanisms for three
hu-man intrusion scenarios
Scenarios Contami-nant Release Mecha-nisms Contami-nant Release Media Contami-nant Transport Media Contami-nant Transport Mecha-nisms Human Exposure Mecha-nisms SCE4: Bathtub-bing
Leaching Leachate Overflow
leachate Soil Atmosphere (dust) Crops Overflow of leachate Suspension Root uptake Adsorption Ingestion of crops Inadvertent ingestion of soil Inhalation of dust External irradiation from soil SCE6: On-site residence Excavation Gas gener-ation Excavated waste Gas House Gas Soil Atmosphere (dust) Crops Gas advec-tion Root uptake Adsorption Suspension Ingestion of crops Inadvertent ingestion of soil Inhalation of dust and gas External irradiation from soil SCE7: Road construc-tion
Excavation Dust Atmosphere
(dust) Suspension Inadvertent ingestion of contami-nated material and waste Inhalation of dust External irradiation from contami-nated material and waste For three human intrusion scenarios there are analytical solutions available in IAEA’s technical document 1380 (IAEA 2003b). Descriptions of the solutions are given below.
Bathtubbing scenario (SCE4)
The analytical solution of the concentration of radionuclides in the overflowing leachate Cdisp [Bq/m3] used in evaluation of the bathtubbing scenario is expressed as:
𝐶𝑑𝑖𝑠𝑝(𝑡) = 𝑒−𝜆𝑡
𝐴𝑚𝑖
𝑉𝑑𝑖𝑠𝑝𝑢𝑛𝑖𝑡(𝜔𝑒𝑑+ 𝜌𝑏𝑑𝐾𝑑𝑑)
Eq. (17)
where e-t is the radioactive decay before the scenario [-]; Ami is the initial activity in the disposal unit [Bq]; Vdispunit is the volume of the disposal unit [m3]; ωcd is the moisture content of the disposal unit [-]; ρbd is the dry bulk density in the disposal unit [kg/m3]; Kd
d is the radionuclide distribution coefficient in the disposal unit [m3/kg].
The dose due to “bath-tub” effect is a sum of external dose (Doseext), inhalation dose (Doseinh) and ingestion dose (Doseing).
𝐷𝑜𝑠𝑒𝑒𝑥𝑡 = 𝑂𝐹
𝜌𝑠𝑜𝑖𝑙∙ 𝑇ℎ𝑠𝑜𝑖𝑙𝐶𝑑𝑖𝑠𝑝(𝑠𝑓 ∙ 𝑡𝑖𝑛+ 𝑡𝑜𝑢𝑡)𝐷𝐹𝑒𝑥𝑡
Eq. (18)
where OF is the water overflow to the garden during one year [m]; ρsoil is the soil dry bulk density of the soil [kg/m3]; Th
soil is the soil thickness [m]; Cdisp is the concentration of radionuclides in overflowing leachate [Bq/m3]; sf is the shielding
factor [-]; tin is the time spent indoors [h/y]; tout is the time spent outdoors [h/y];
DFext is the external exposure dose factor [Sv/h per Bq/kg].
𝐷𝑜𝑠𝑒𝑖𝑛ℎ = 𝑂𝐹
𝜌𝑠𝑜𝑖𝑙∙ 𝑇ℎ𝑠𝑜𝑖𝑙𝐶𝑑𝑖𝑠𝑝(𝑑𝑢𝑠𝑡𝑖𝑛𝑏𝑟𝑖𝑛𝑡𝑖𝑛 + 𝑑𝑢𝑠𝑡𝑜𝑢𝑡𝑏𝑟𝑜𝑢𝑡𝑡𝑜𝑢𝑡)𝐷𝐹𝑖𝑛ℎ
Eq. (19)
where dustin, dustout are the indoor and outdoor dust levels [kg/m3]; brin, brout are the indoor and outdoor breathing rates [m3/h]; DF
inh is the dose factor for inhala-tion [Sv/Bq]. 𝐷𝑜𝑠𝑒𝑖𝑛𝑔 = 𝑂𝐹 𝜌𝑠𝑜𝑖𝑙∙ 𝑇ℎ𝑠𝑜𝑖𝑙 𝐶𝑑𝑖𝑠𝑝(𝑇𝐹𝑣𝑒𝑔𝑡𝑄𝑣𝑒𝑔𝑡+ 𝑄𝑠𝑜𝑖𝑙)𝐷𝐹𝑖𝑛𝑔 Eq. (20)
where TFveget is the soil to plant concentration factor for the vegetable [Bq/kg fresh
Weight per Bq/kg dry soil]; Qveget is the vegetable consumption rate [kg/y]; Qsoil
is the inadvertent soil ingestion rate [kg/y]; DFing is the dose factor for ingestion [Sv/Bq].
On-site residence scenario (SCE6)
The analytical expression of activity to which the on-site resident is exposed, Ares
[Bq/kg of waste], is given by:
𝐴𝑟𝑒𝑠 = 𝐴𝑚𝑒−𝜆𝑡1 ∙ 𝑑𝑖𝑙 Eq. (21)
where Am is the initial concentration of the radionuclide disposed waste [Bq/kg]; λ is the radioactive decay constant [1/y] (if required other mechanisms contrib-uting to
diminishing the radioactivity could also be incorporated in an effective decay term (λeff)); t1 is the time before exposure starts [y]; dil is the dilution factor [-].
The dose due to on-site residence is a sum of external dose (Doseext), inhalation dose (Doseinh) and ingestion dose (Doseing).
𝐷𝑜𝑠𝑒𝑒𝑥𝑡 = 𝐴𝑚(𝑠𝑓 ∙ 𝑡𝑖𝑛+ 𝑡𝑜𝑢𝑡)𝐷𝐹𝑒𝑥𝑡 Eq. (22)
𝐷𝑜𝑠𝑒𝑖𝑛ℎ = 𝐴𝑚(𝑑𝑢𝑠𝑡𝑖𝑛𝑏𝑟𝑖𝑛𝑡𝑖𝑛+ 𝑑𝑢𝑠𝑡𝑜𝑢𝑡𝑏𝑟𝑜𝑢𝑡𝑡𝑜𝑢𝑡)𝐷𝐹𝑖𝑛ℎ Eq. (23)
𝐷𝑜𝑠𝑒𝑖𝑛𝑔 = 𝐴𝑚(𝑇𝐹𝑣𝑒𝑔𝑡𝑄𝑣𝑒𝑔𝑡+ 𝑄𝑠𝑜𝑖𝑙)𝐷𝐹𝑖𝑛𝑔 Eq. (24)
Road construction scenario (SCE7)
The analytical solution of the activity concentration to which the intruder is simi-lar to the Eq. (21) and is expressed as Aint [Bq/kg of waste], which is given by
𝐴𝑖𝑛𝑡 = 𝐴𝑚𝑒−𝜆𝑡1∙ 𝑑𝑖𝑙 Eq. (21)
where Am is the initial concentration of the radionuclide disposed [Bq/kg of waste]; λ is the radioactive decay constant [y] (if required other mechanisms con-tributing to
diminishing the radioactivity could also be incorporated in an effective decay term (λeff)); t1 is the time before intrusion starts [y]; dil is the dilution factor [-].
The dose due the road construction scenario can be expressed as (in [Sv/y]):
𝐷𝑜𝑠𝑒 = 𝐴𝑖𝑛𝑡(𝑄𝑠𝑜𝑖𝑙𝐷𝐹𝑖𝑛𝑔+ 𝐷𝐹𝑒𝑥𝑡+ 𝑏𝑟∙ 𝑑𝑢𝑠𝑡 ∙ 𝐷𝐹𝑖𝑛ℎ)𝑡2 Eq. (22)
where Aint is the activity to which the intruder is exposed [Bq/kg of waste]; Qsoil is the inadvertent soil ingestion rate of the intruder [kg/h]; DFing is the dose factor for ingestion [Sv/Bq]; DFext is the external exposure dose factor [Sv/h per Bq/kg]; br is the breathing rate of the intruder [m3/h]; dust is the dust level experienced by the intruder [kg/m3]; DFinh is the dose factor for inhalation [Sv/Bq]; t2 is the expo-sure duration [h].
4.3.3. Modelling of alternative scenarios
Two scenarios are selected as alternative scenarios, namely the flooding scenario and landslides scenario.
The model used for the flooding scenario is similar to the model used for the bath-tubbing scenario (Eq. (17)) except for no retardation considered in the vault. It is assumed that a sudden increasing of infiltration with a flooding event the retarda-tion effect might be reduced significantly. Therefore the concentraretarda-tion of radionu-clides in the overflowing leachate Cdisp [Bq/m3] used in evaluation of the flooding scenario is expressed as:
𝐶𝑑𝑖𝑠𝑝(𝑡) = 𝑒−𝜆𝑡 𝐴𝑚𝑖
𝑉𝑑𝑖𝑠𝑝𝑢𝑛𝑖𝑡𝜔𝑒𝑑
Eq. (23)
where e-t is the radioactive decay before the scenario [-]; Ami is the initial activity in the disposal unit [Bq]; Vdispunit is the volume of the disposal unit [m3]; ω
cd is the moisture content of the disposal unit [-].
Once the concentration of radionuclides in the overflowing leachate Cdisp is deter-mined rest of calculations are exact the same as in the bathtubbing scenario (see section 4.3.2).
For the landslides scenario we assume that the result of the on-site residence sce-nario can cover this case.
4.4 Data compilation
Radionuclide and element dependent data are given in the Appendix. Data used in evaluation of the alternative scenarios are covered by the data used for the human intrusion scenarios. Therefore, they are not given explicitly here again. The main source of the data are adapted from ISAM reports (IAEA 2004a,b) and IAEA technical document 1380 (IAEA 2003b) as well as data from the site investigation (section 3.2, 4.2).
4.4.1. Data used in evaluation of design scenario
Except for the source terms, radionuclide and element dependent data all the pa-rameter values used in the calculation of the design scenario are given below: Radionuclide transport:
- Infiltration = 0.573 [m/y] (10% of infiltration at the initial state and line-arly increasing to 100% at 500 years)
- the surface area of the disposal facility = 75 [m2] - the volume of the disposal facility = 225 [m3]
- the effective porosity in the medium = 0.4 [-] (see section 3.2.1) - the degree of saturation of the medium = 0.2 [-]
- the bulk density of the medium (unsaturated) = 1910 [kg/m3]
- the distance between surface and the aquifer = 1.5 [m] - the total distance to the well = 300 [m]
- the total distance to the stream = 50 [m] - the porosity of the medium (aquifer) = 0.4 [-]
- he bulk density of the medium (aquifer) = 2000 [kg/m3]
- the hydraulic conductivity of the sandy clay soil layer = 0.5 [m/y] (used for the stream case, see section 3.2.1)
- the hydraulic conductivity of the fine sand layer = 0.35 [m/y] (used for the well case, see section 3.2.1)
- the hydraulic gradient = 0.1 [-] (assumed as the same as surface inclination about 6 degrees, see section 3.2.1)
- the volume of the compartment representing the well = 8300 [m3] - the area of the biosphere object = 2.1104 [m2] (see section 4.2)
- the area of the catchment associated with biosphere object = 1.1106 [m2] (see section 4.2)
- precipitation = 0.573 [m/y] (see section 3.2.2)
- evapotranspiration = 0.46 [m/y] (assumed as 80% of the precipitation) Human behavior:
- average adult breathing rate = 1 [m3/h] - intake rate of drinking water = 0.73 [m3/y]
- the suspended particle concentration in the river water = 0.01 [kg/m3]
- consumption rate of grain = 148 [kg/y]
- consumption rate of root vegetables = 235 [kg/y] - consumption rate of green vegetables = 62 [kg/y] - consumption rate of cow milk = 330 [kg/y] - consumption rate of cow meat = 95 [kg/y]
- dust concentration during ploughing activities = 10-6 [kg/m3] - occupancy factor for ploughing activities = 0.034 [-]
Plants:
- irrigation rate per crop = 0.3 [m/y] Cattle:
- daily water consumption = 0.06 [m3/day] - daily soil consumption = 0.6 [kg/day] - daily pasture intake (wet) = 55 [kg/day] - average milk production = 5500 [kg/y] Soil:
- thickness = 0.25 [m] - kinematic porosity = 0.3 [-] - dry bulk density = 1800 [kg/m3] Atmosphere:
4.4.2. Data used in evaluation of human intrusion scenarios
Bathtubbing scenario
Except for the source terms, radionuclide and element dependent data all the pa-rameter values used in the calculation of the bathtubbing scenario are given be-low:
- water overflow to the garden during one year (OF) = 0.1 m - the volume of the disposal unit = 225 [m3]
- the moisture content of the disposal unit = 0.7 [-]
- for external exposure, a shielding factor (sf) of 0.1 for indoor activities is assumed.
- breathing rate indoor = 0.75 [m3/h]
- breathing rate outdoor = 1 [m3/h]
- time spent indoor = 6575 [h/y] - time spent outdoor = 2191 [h/y]
- consumption rate of root vegetables = 118 [kg/y] - consumption rate of green vegetables = 31 [kg/y] - inadvertent soil ingestion rate = 310-2 [kg/y] - soil thickness = 0.25 [m]
- soil dry bulk density = 1800 [kg/m3] - indoor dust level = 110-8 [kg/m3] - outdoor dust level = 210-8 [kg/m3] On-site residence scenario
Except for the source terms, radionuclide and element dependent data all the pa-rameter values used in the calculation of the on-site residence scenario are given below:
- dilution factor is 0.3
- the volume of the waste = 75 [m3] - the density of the waste = 1000 [kg/m3]
- for external exposure, a shielding factor of 0.1 for indoor activities is as-sumed.
- breathing rate indoor = 0.75 [m3/h] - breathing rate outdoor = 1 [m3/h] - time spent indoor = 6575 [h/y] - time spent outdoor = 2192 [h/y]
- root vegetables consumption rate = 118 [kg/y] - green vegetables consumption rate = 31 [kg/y] - inadvertent soil ingestion rate = 310-2 [kg/y] - indoor dust level = 110-8 [kg/m3]
Road construction scenario
Except for the source terms, radionuclide and element dependent data all the pa-rameter values used in the calculation of road construction scenario are given be-low:
- dilution factor = 0.3
- the volume of the waste = 75 [m3] - the density of the waste = 1000 [kg/m3] - inadvertent soil ingestion rate = 310-2 [kg/y] - exposure duration = 88 [h]
- Breathing rate of the intruder = 1.2 [m3/h]
- Inadvertent soil ingestion rate of the intruder = 3.4 10-5 [kg/h]
5. Results of the analyses
The models described in the previous chapter were implemented in Ecolego, which is a modelling software explicitly made for compartmental transport model-ling (Ecolego 2018). This chapter presents the results from various scenarios and calculation cases. Generally, a period of 100,000 years is simulated starting from the closure of the disposal facility, which is assumed as 2015 because the esti-mated inventory is for that year.
5.1 Results from the design scenario
The assessment of the design scenario comprises two variants, the well case and the stream case. In the design scenario it was assumed that the concrete wall was degraded already at the initial state, i.e., 10% of total infiltration at the beginning of the simulation. An overview of the main results obtained for the design sce-nario is presented below.
In the deterministic calculation for the well case of the design scenario, the maxi-mum dose is about 0.04 mSv/a at around 15 years after the closure (see Fig. 24). The dominating radionuclide is Co-60. The second peak is about 250 years after the closure. The dominating radionuclide is C-14. The third peak of the doses are caused by Pu-239 and its daughter radionuclides. Fig. 25 shows time series of an-nual effective doses across exposure pathways. As can be seen the ingestion dose dominates and coincides with the maximum dose.
A deterministic sensitivity analysis was performed by assuming the concrete wall was totally degraded, i.e., the 100 % infiltration at the initial state. Fig 26 shows the calculated total dose based on this assumption compared with the base case. As can be seen the maximum dose is 0.28 mSv/a which is significantly higher than that of the base case. However, it is still under the criteria (IAEA 2011).
Fig. 24 Effective doses to the most exposed group for releases from the disposal
facility in the well case of the design scenario after the closure.
For the stream case the calculated maximum dose is about 0.07 mSv/a at around 3000 years after the closure. The dominated radionuclide is Pu-239 (see Fig. 27). The first peak dose is mainly caused by Cl-36 one year after the closure. The sec-ond peak is about 50 years after the closure caused by Sr-90.
Since the assumption of no any retardation of waste itself and the engineered bar-rier for the design scenario was already pessimistic no further probabilistic and sensitivity analyses were conducted.
Fig. 25 Effective doses to the most exposed group for releases from the disposal
facility in the well case of the design scenario and contributions from the individ-ual exposure pathways.
Fig. 26 Comparison of calculated results between the well case with a totally
de-graded concrete wall at the initial state (red line) and the base well case with partly degraded concrete wall at the initial state (blue line).
Fig. 27 Effective doses to the most exposed group for releases from the disposal
facility in the stream case of the design scenario after the closure.
5.2 Results from the human intrusion scenarios
As mentioned in section 4.1.3 three human intrusion scenarios were selected to as-sess the disturbed evolution of the disposal facility: the bathtubbing scenario (SCE4); the on-site residence scenario (SCE6); and the road construction scenario
(SCE7). The earliest time for these scenarios to happen has been set to the end of institutional control 300 years after the closure. The results are presented below.
5.2.1. The bathtubbing scenario
The bathtubbing scenario expects that the existence of a cover and the partly de-graded nature of the disposal facility limits the site exploitation and thus reduce the transfer pathways. It is only considered that the water resulting from a leakage accumulation (bath-tub effect) could contaminate a residence system by over-flow.
Fig. 28 shows the results for the total dose for this scenario and main radionu-clides contributed to the doses. The maximum total dose is about 1 mSv/a and the main radionuclide contributed to the doses is C-14.
Fig. 28 Total annual effective dose for the bathtubbing scenario.
5.2.2. The on-site residence scenario
The On-site residence scenario expects that the engineered barriers of the disposal facility as well as the waste are totally degraded. The exposed residents in this scenario are supposed to live in a house that had been built directly on top of the facility. Due to this distribution of waste material, the soil around the house is ex-pected to be contaminated which is equal to the specific activity of the waste di-vided by a dilution factor. Residents grow vegetables in the garden for their own consumption.
Fig. 29 a) shows the results for the total dose for this scenario and main radionu-clides contributed to the doses. The maximum total dose is about 130 mSv/a. The results show that human intrusion activities after the institutional control can lead to radiological exposure above the level of 1 mSv/a for up to 100,000 years. The