Master thesis, 30 hp The Pharmacy Program, 300 hp Report approved: Spring term 2018
Supervisor(s): Dr. Cecilia Brännmark, Göteborgs universitet, Dr. Anders Öhman, Umeå universitet,
Examinor: Dr. David Andersson
Is adiponectin secreted via
caveolae?
The importance of caveolae for stimulated
adiponectin secretion in obesity
Abstract
Introduction: Obesity is a metabolic disease and it is a worldwide problem leading to
comorbidities but is also known to be the main risk of type 2-diabetes. The interesting link between obesity and type 2-diabetes has led to the interest in adipose tissues. Adiponectin is found to improve insulin sensitivity and higher levels of adiponectin is shown to be associated with lower the risk of type 2-diabetes. The adipocyte plasma membrane is covered by caveolae and is important in different cellular processes. Caveolae can be associated with adiponectin secretion; therefore have been investigated in this study.
Aim: The aim of this study was mainly to investigate if adiponectin is secreted via the
plasma membrane region caveolae but also to investigate if high fat diet (HFD) affects the expression of caveolin 1, a protein governing caveolae structure, and if the serum adiponectin levels are affected by caveolae depletion.
Method: To study adiponectin secretion primary mouse adipocytes was used. We used
three different secretagogs, insulin, FSK (forskolin)/IBMX (3-isobutyl-1-methylxanthine) and CL 3162431 to stimulate adiponectin from cells. The measurments of adiponectin and leptin was done by using Bradford and ELISA assay. Real-Time quantitative Polymerase Chain Reaction (RT qPCR) was used to determine the gene-expression of caveolin 1.
Result and discussion: We found a coupling between caveolae and adiponectin
secretion, which indicates caveolaes’ importance in adiponectin secretion. We could also show that the expression of caveolin 1 is influenced by HFD. Our serum adiponectin and leptin measurements on knockouts and wild-type mice showed higher adiponectin levels in wild-type mice. The case with leptin levels was alike, higher leptin levels in wild-type mice while the levels in knockout mice were slightly reduced.
Conclusion: Caveolae have a role in stimulated secretion of adiponectin. The
secretagogues insulin and CL 3162431 showed to serve a stronger stimulation for adiponectin secretion in mice than FSK (forskolin)/IBMX (3-isobutyl-1-methylxanthine). The reduced caveolin 1 gene expression in mice fed HFD indicates a reduced cavoelin 1 expression in obesity.
Abbreviations
Acrp30 Adipocyte complement related protein
ADHAS Adult-derived human adipocyte stem
AMP 5’ adenosine monophosphate –activated protein
AMPK 5’ adenosine monophosphate –activated protein kinase
APMI Adipose most abundant gene transcripts I
ATP Adenosine triphosphate
BMI Body mass index
BSA Bovine serum albumin
β3Ars β-3-adrenergic receptors
CAV Caveolin
cAMP Cyclic adenosine monophosphate
CV Coefficient of variation
ELISA Enzyme linked immunosorbent assay
Epac Exchange protein activated by cAMP
FSK Forskolin
HFD High fat diet
HMW High molecular weight
IBMX 3-isobutyl-1-methylxanthine
IR Insulin receptors
KO Knockout
LMW Low molecular weight
MMW Medium molecular weight
PBS Phosphate buffer saline
PCR Polymerase Chain Reaction
PDE3B Phosphodiesterase 3B
Abbreviations
qPCR Quantitative Polymerase Chain Reaction
RT qPCR Real-Time quantitative Polymerase Chain Reaction SEM Standard error of mean
SDS Sodium dodecyl sulfate
Content
1. Introduction
---
1
1.1 Adiponectin ---
1
1.2 Leptin---
2
1.3 Stimulated and constitutive exocytosis---
2
1.4 Adiponectin exocytosis---
2
1.5 Caveolae---
3
1.6 High Fat Diet, a model system of obesity---
4
1.7 Pharmaceutical relevance---
4
2. Aims
---
5
3. Materials and methodology
---
5
3.1 Separation of cells and medium---
6
3.2 Measurement of the protein content---
6
3.3 Measurement of secreted adiponectin---
6
3.4 Measurement of leptin and adiponectin in mouse serum---
7
3.5 Measurement of gene expression---
8
3.6 Statistical analysis---
8
3.7 Ethical considerations---
8
4. Results
---
8
4.1 Secretion of adiponectin via caveolae in mice---
8
4.2 Secretion of adiponectin via caveolae in human adipocytes---
9
4.3 Gene expression of caveolae---
9
4.4 Serum adiponectin and leptin levels---
10
5. Discussion
--- 10
5.1 Model system and methodology--- 10
5.2 The difference between human and mouse--- 11
5.3 Secretion of adiponectin via caveolae--- 11
5.4 Are serum adiponectin and leptin levels affected by caveolae? --
12
5.5 Is caveolin expression affected by HFD? --- 13
5.6 Future researches--- 13
6. Conclusions
--- 13
7. Acknowledgement
--- 14
8.
References
--- 15
1
1. Introduction
Obesity is a metabolic disease that poses a threat to human health and has become one of the leading causes of death [1]. Obesity also affects productivity and quality of life [2]. It affects both adults and children worldwide. Moreover, obesity is known to be the main risk factor of type 2-diabetes. There is a close relationship and comorbidity between obesity and diabetes that has led to the term 'diabesity'. This expression highlights the fact that the majority, but not all, individuals with diabetes are overweight/obese [1].
Great progress has been made towards a better understanding of the molecular basis of diabetes; however, the key links between obesity and type 2-diabetes is still inadequately described [2]. The interest in this coupling between obesity and metabolic disease, such as diabetes, has led to interest in the adipose tissue, which increases in obesity. The adipose tissue plays important roles in fuel storage, thermal insulation and mechanical protection, but has during the last 20 years been recognized as an important endocrine organ [3]. Two of the hormones secreted by adipocytes are adiponectin (also known as adipoQ and ACRP30) [2] and leptin [4].
1.1 Adiponectin
Adiponectin is a 30-kDA monomer; it binds through covalent and noncovalent bonds, to form oligomers by binding to other monomers [5], [6]. Adiponectin was first discovered in 1995 as a protein secreted from white adipose tissue into the circulation [2] and has a role in glucose and lipid metabolism [7]. The structure of adiponectin consist of three domains an N-terminal sequence, a globular and a collagenous domain [8]. Three different forms of adiponectin is found in the plasma, the trimeric, low molecular weight (LMW) form, the hexametric, medium molecular weight (MMW) form, and the multimeric, high molecular weight (HMW) form. The last has a major role in glucose homeostasis [6], but the insulin sensitivity correlates with the relationship between HMW and LMW adiponectin in humans [9]. HMW adiponectin is more bioactive, and is a better indicator of insulin sensitivity.Studies has shown an increase of HMW adiponectin on average by 90 % ± 50 %, while LMW was decreased by 50 % ± 15 %, when treating adult-derived human adipocyte stem (ADHAS) cells with tunicamycin (antibacterial and antifungal) or thapsigargin (induces apoptosis) [9], thus HMW is released in higher amount.
Adiponectin has been found to improve insulin sensitivity in major insulin target tissues, it is also important for regulation of energy metabolism and modulate inflammatory responses [2]. Studies have shown that 39%-70% of adiponectin plasma levels are directed by genetic factors [10]. Adiponectin is encoded by ADIPOQ (also called APMI) and there are several polymorphisms at the ADIPOQ locus that has shown to be associated with adiponectin plasma levels [4]. A lower risk of type 2-diabetes is shown to be associated with high levels of adiponectin in human plasma. Moreover, insulin resistance is reduced with increased adiponectin levels and adiponectin receptor levels, in vitro [3]. Moreover, it has been shown that mice over-expressing adiponectin show increased ” metabolic flexibility”, meaning that their ability to adjust to changes in total nutrient availability and/or switching between lipid and carbohydrate as primary fuel source is increased [11]. In the same paper adiponectin knockout mice was found to suffer from metabolic impairment [11]. It is therefore interesting to investigate adiponectin secretion in order to better understand the mechanisms behind metabolic disease. The regulation of adiponectin secretion and its link to obesity and metabolic diseases are not fully known. Beside this, the adipose tissue also plays important roles in fuel storage, thermal insulation and mechanical protection. It has also many functions related to for example endothelial function, the inhibition of inflammatory mediators and promotion of insulin sensitivity [9]. Adiponectin and insulin acts together in inhibiting the hepatic glucose production while the globular domain in skeletal muscle and other tissues [9].
2
1.2 Leptin
Leptin (Greek “leptos”=thin) is circulating protein with hormone/cytokine activities that has central and peripheral effects. Leptin is mainly released by subcutaneous white adipose tissue, however other tissues, such as skeletal muscles, stomach and ovaries does also secret lower amount of leptin. Leptin is found as a free adipokine or bound to leptin-binding proteins in the plasma. The bound form of leptin is mainly found in lean individuals while the free form is found in obese persons [12]. Like adiponectin, leptin is also involved in regulation of insulin sensitivity, energy balance [4], food intake, energy consumption and adiposity [13]. As mentioned before, the secretion of adiponectin is reduced in type 2-diabetes and obesity [3]; leptin on the other hand is increased [4]. Studies have shown that there is a sexual dimorphism in leptin circulating levels; women tend to have higher circulating levels of leptin than men, which are considered to be associated with the higher percentage of body fat in women compared to men. Other studies suggest that these sex differences in leptin plasma levels might be associated with estrogen or androgens [12]. Leptin acts via hypothalamus to regulate the energy expenditure and the food intake, but also activate oxidation of fatty acid in skeletal muscle (through a stimulation on the enzyme AMP-dependent kinase (AMPK)), while adiponectin improves the oxidation of fatty acid in skeletal muscles. Serum levels of leptin increases through feeding and decreases through fasting, and the level correlates with adipose cell mass and BMI (Body Mass Index) [4].
1.3 Stimulated and constitutive exocytosis
The process of constitutive exocytosis is required for the insertion of new cell membrane in essentially all cell types. Extracellular molecules such as antibodies, plasma protein, extracellular matrix components etc. are secreted by constitutive exocytosis. A second pathway does also exist in many cell types where exocytosis can tightly be regulated to allow the controlled release of vesicles content or regulate the insertion of new membrane components [14] [15].
While constitutive secretion is continuous regardless of external factors or signals, regulated secretion need to be triggered by a specific signal or certain external factors [16]. The cargo in exocytosis is packed in vesicles, which undergoes maturation into stimulus responsive secretory granules [17].
1.4 Adiponectin exocytosis
In the case of adiponectin, its release mechanisms are still somewhat unclear. However, it has been shown that it is secreted by exocytosis of vesicles and that exocytosis of adiponectin vesicles is triggered via the adrenergic signaling pathway and by insulin [18]. Adiponectin secretion under insulin stimulation has been suggested to function as autocrine signal (self-regulation of adipocytes) or as paracrine signal (for mediating local communication between adipocytes and other cell types) [15]. This is an example of regulated exocytosis that occurs after short stimulus. Dr. Charlotta Olofssons team has in their study shown that the adiponectin secretion and adipocyte exocytosis activates by cAMP and activation of Epac (Exchange Protein Activated by cAMP). Further, this study has shown that the cAMP-dependent stimulation is increased by intracellular Ca2+ and that
it requires ATP (energy-dependent process). The adiponectin exocytosis is suggested to be stimulated via catecholamine binding to β-3-adrenergic receptors (β3ARs) and Epac isoform activation [19]. Adiponectin is also constitutively released from adipocytes, that are mainly present in adipose tissue. The constitutive secretion of adiponectin from adipocytes is responsible for the major part of the adiponectin found in the blood.
Adiponectin secretion can be stimulated by addition of insulin, forskolin+IBMX (adenylate cyclase activator) [1] and1CL (CL 3162431, β3-agonist) [19]. The insulin induced
secretion of adiponectin has been shown to be mediated by a phosphoinositide 3 kinase
1CL-3162431 (the disodium (R, R)-5[[[[(3-chlorophentyl)-hydroxyethyl]-amino] propyl]-1,3-benzodioxole-2, 2-dicarboxylate) is a thermogenic and a highly selected β3-agonist [20].
3
(PI3K) and phosphodiesterase 3B (PDE3B) [21] and its defined that the regulation of adiponectin exocytosis following adrenergic stimulation through cAMP-triggered release by vesicles containing adiponectin [18], that is influenced by both Ca2+ dependent and
independent processes [19]. The induced Forskolin (FSK) adiponectin secretion is by activating the adenylyl enzyme and elevating the intracellular levels of cAMP. Furthermore, 3-isobutyl-1-methylxanthine (IBMX) works as a non-competitive selective phosphodiesterase inhibitor that increases the cAMP levels. The β3-agonist, CL has in
Komai el al showed to increase the cytoplasmic cAMP [18]. The cAMP-stimulated secretion is connected via Exchange Protein directly Activated by cAMP (Epac) and increased by an elevation of intracellular Ca2+ (figure 1) [22]. The regulation of adiponectin release is yet
unclear [18].
1.5 Caveolae
The adipocyte plasma membrane is covered with cave- like invaginations, called caveolae [3]. Caveolae are a type of lipid raft whose membrane is enriched in cholesterol and sphingolipids and is important in different cellular processes including endocytosis and cholesterol homeostasis. Furthermore, they are partly responsible of a typical flask-like morphology of caveolae through the asymmetrical membrane insertion and the tendency to knot into oligomers [23].
There are three major isoforms of caveolin Cav1, Cav2 (expressed in most cell types) and Cav3 (represent the muscle-specific isoform that is found only in smooth, skeletal and cardiac muscle) [23]. However, all three cell-types contain caveolin 1 (Cav1), which is a protein that regulates the caveolaer structure. It has been found that adipocyte caveolae is involved in insulin signaling, fatty acid transport and triacylglycerol synthesis, why it sometimes calls metabolic platform [3].
Caveolin has been involved in regulating cellular signal transduction with prominent expression in adipocytes and is a major structural component of raft structures within the plasma membrane. Furthermore, it plays an important role in intracellular cholesterol and sphingolipid transport [24]. Abolishing caveolae by Caveolin-1 knockout, results in a decrease of adiponectin in plasma, this suggests a role of caveolae in adiponectin secretion
Lipids Releaseable vesicles Ca2+ Reserv pool ATP+Ca2+ cAMP/Epac
Figure1.
Proposed illustration of white adipocyte exocytosis where it shows two functional pools of secretory vesicles. The release is regulated by the intracellular messenger’s cAMP, Ca2+ and ATP. Ca2+ is involved in replenishment of vesicles in the reserve pool and Ca2++ ATP reinforce the exocytose. An increase of cAMP alone release adiponectin-containing vesicles [19]. The illustration shows also where insulin, FSK/IBMX and CL functions in the cell.The figure is adapted from Komai et al [19]. CL, FSK/IBMX IR
CL
Adiponectin
Vesicle containing adiponectin Vesicle releases adiponectin
4
[3]. It has also been shown that mice overexpressing adiponectin has elevated caveolin-1 levels in adipocytes [25]. Interestingly, HMW adiponectin is more reduced in caveolin-1 knockout mice than the total adiponectin [24].
López et al have shown that caveolin 1 is upregulated in rat visceral white adipose tissue after a long period of high fat diet (HFD) feeding. This suggests a possible compensatory mechanism to the HFD. As mentioned above, caveolin 1 is an important constituent of adipocyte caveolae and binds to the insulin receptor (IR) by the beta subunit. It has been shown that the promotor, exon 1 and first intron of the caveolin 1 gene obtain a demethylation process and an induction of caveolin 1 when 3T3-L 1 cells undergoes an adipocyte differentiation. That gives an indication to that an epigenetic mechanism can have a main role in the differentiation process [26].
1.6 High Fat Diet, a model system of obesity
Challenging an animal model with different diets serves as an invaluable tool for researches when studying effects of diets on metabolism and metabolic diseases. When designing such studies it is important to take great care in ensuring comparable genetic backgrounds in order to minimize variability that can occur when detecting treatment related phenotypic differences [27].
When studying a certain issue/disease it is important to mimic that state/disease as closely as possible. Several studies have indicated that increased energy intake by HFD feeding is the best way to model in obesity [27]. HFD, used to increase the weight in animals consist of amino acid supplemented casein, maltodoxtrose or sucrose, cornstarch (carbohydrate 1%), soybean oil lard (72%), and supplements of minerals and vitamins. The fibers used in HFD are often provided by cellulose. To mimic normal weight controls, another diet is used namely chow and is a high fiber diet composed of agricultural byproducts such as corn, oat, soybeans, complex carbohydrates (70%), fat from variety of vegetable sources (10%) and proteins from fish (20%) the food is also supplemented with vitamins and minerals [28]. Obesity in humans is characterized by a low-grade inflammation and increases the risk of type 2 diabetes [29], cardiovascular disease, muscular and skeletal disorders (disabling degradation disease of the joints - osteoarthritis) and few cancer types such as breast, ovarian and prostate [30]. Obesity is also associated with dysregulation of functions in both the adipose and peripheral tissues [31]. The cause behind obesity is according to WHO an energy imbalance between the intake and the use of calories. Basically caused by an excessive intake of high energy (food), similar to a HFD in mice, and a physical inactivity [30].
1.7 Pharmaceutical relevance
The strong association of reduced adiponectin levels in obesity and diabetes has highlighted the importance of adiponectin. Especially as adiponectin contribute to improve insulin resistance, decrease inflammation and reduce the risk of cardiovascular disease. The role of adiponectin in improving obesity and metabolic disease can be a promising pharmaceutical target. Adiponectin has proven very hard to synthesize in its active forms, making the endogenous machinery of expression and secretion highly interesting as possible drug targets. It is therefore interesting to investigate the mechanisms of adiponectin secretion and understand how the mechanisms might be altered in metabolic disease.
5
2. Aims
The aim of this study is to investigate if adiponectin is secreted via the plasma membrane region caveolae. The specific questions will be; 1) are adiponectin vesicles secreted via caveolea? 2) Is caveolin 1 expression affected by HFD? 3) Are serum adiponectin levels affected by depletion of caveolea?
3. Materials and methodology
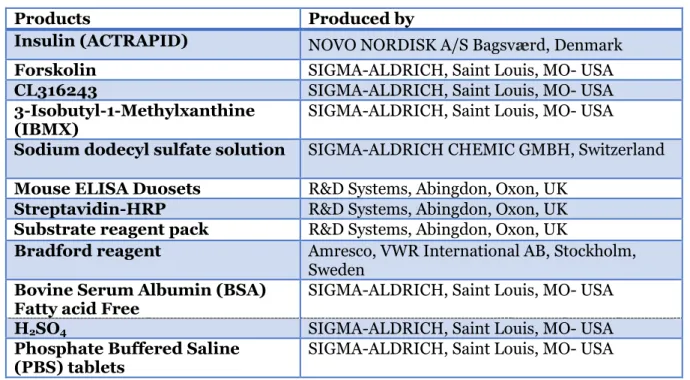
In this study several chemical products were used from different company supplies, as shown in table 1 below.
Table 1. The table shows the chemicals used in this study
Products Produced by
Insulin (ACTRAPID)
NOVO NORDISK A/S Bagsværd, Denmark
Forskolin SIGMA-ALDRICH, Saint Louis, MO- USA
CL316243 SIGMA-ALDRICH, Saint Louis, MO- USA
3-Isobutyl-1-Methylxanthine
(IBMX) SIGMA-ALDRICH, Saint Louis, MO- USA
Sodium dodecyl sulfate solution SIGMA-ALDRICH CHEMIC GMBH, Switzerland
Mouse ELISA Duosets R&D Systems, Abingdon, Oxon, UK
Streptavidin-HRP R&D Systems, Abingdon, Oxon, UK
Substrate reagent pack R&D Systems, Abingdon, Oxon, UK
Bradford reagent Amresco, VWR International AB, Stockholm,
Sweden
Bovine Serum Albumin (BSA)
Fatty acid Free SIGMA-ALDRICH, Saint Louis, MO- USA
H2SO4 SIGMA-ALDRICH, Saint Louis, MO- USA Phosphate Buffered Saline
(PBS) tablets SIGMA-ALDRICH, Saint Louis, MO- USA
Primary mouse adipocytes (recovered from subcutaneous fat) were used to study adiponectin secretion. The cells were firstly incubated at 320C with either, vehicle as a
control or β-cyklodextrin (50 nM), which is known to abolish caveolae in these cells [32] in 30 min. The adipocytes were then stimulated with known adiponectin secretagogs, such as insulin (200 nM), forskolin/IBMX (10 µM/200 mM) that will increase (cAMP), β -3 agonist (CL 3162431) (10 µM). A non-stimulated control was also included for each treatment. Secondly, stimulated adiponectin secretion from adipocytes wild -type mice (WT) was compared with that from knockout mice (KO), lacking a protein called caveolin 1, which is essential for the caveolaer structure. The cells used in this study were isolated from mice subcutaneous tissue and stimulated by using the previously described secretagogs.
3.1 Separation of cells and medium
The mice cells (recovered from subcutaneous fat) and medium (containing stimulated adiponectin) was separated in room temperature by a table-top centrifuge (at 500 rpm in one minute) through adding diisononyl phthalate, which is dense oil (unmeasured amount, filled half of the Eppendorf tube). The tubes were then frozen and cut with three parts, the cells floated on the surface of the oil and the adiponectin-containing medium, due to its higher density, was in the bottom of the tube (oil face in the middle was discharged). The cells (10 %, V/V) were then lysed in 25 µl lysis buffer PBS containing protease inhibitors (1 tablet per 10 ml; Complete Mini, Roche, Germany) and 200 µl 2% SDS (W/V), see
6
supplement A. Before protein measurements the cell lysate was sonicated (BRANSON SONIFIER 250) with the following setting: the timer at hold, duty cycle 30 % and the output control at 3 micro tip limit (in order to improve cell lysis). The samples were then centrifuged with a table-top centrifuge (at 1000 rpm in 3 minutes) and the lipid layer removed to minimize problems in the protein measurements.
3.2 Measurement of the protein content
Bradford assay was used to measure the total protein amount in the samples (figure 2). A seven point standard curve was used by two-fold serial dilution of bovine serum albumin (BSA) in PBS and added to a 96-well plate (#3690, Corning Inc.). The protein samples from the stimulation experiment were diluted in PBS (see supplement A) and added into the 96-well plate. The protein samples were diluted depending on the cell concentration; thre Eppendorf tubes were used to predict the cell concentration by adding 10 µl of the highest standard (50 µl stock solution (2000µg/ml) diluted in 50 µl PBS, see supplement A) in the first tube, certain amount of the sample (starting with 1 µl) diluted with 10 µl PBS in the second tube, 10 µl PBS (blank) in the third tube and finally 90 µl Bradford solution was added to all three tubes. When the color of the sample tube is in between the highest standard and the blank, the dilution factor is set. Bradford solution was then added to both standards and samples. A change of color was then achieved and the absorbance was measured using a spectrophotometer at 595 nm. The protein values of Bradford guided the concentration used for the ELISA assay. The standard and the samples were applied in duplicate in the 96-well plate and if the result from the microplate reader showed a difference between the duplicates, CV % value > 10, the assays were repeated till the duplicates in the assay showed CV% value >10.
3.3 Measurement of secreted adiponectin
ELISA (enzyme linked immunosorbent assay) was used to measure the secreted amount of adiponectin (figure 3). That was performed by using a 96-well plate (#3690, Corning Inc.). The plate was coated with 28 µl capture antibody (2 µl/ml) (see supplement A) in PBS (Phosphate Buffer Saline) and shaken for some seconds, then sealed and incubated overnight at room temperature. The plate was washed three times with wash buffer (PBS tablets + MilliQ H2O + 0,5 ml Tween, see supplement A) three times, followed by removal
remaining wash buffer.
Protein/sampel Coomassie Brilliant Blue G-250
Figure 2. Illustration of the molecular steps in Bradford. The Bradford sticks to the backbone of the protein.
7
50 µl/well 1 % BSA (Bovine Serum Albumin) was added and left for one hour. BSA binds to the sites where antibodies have not bound in the well and to prevent unspecific binding of the sample. Meanwhile, preparation of standards and the samples were done. A seven point standard curve was used by serial dilution in BSA, marked S1-S7. The standards were prepared by adding 250 µl BSA in S1 and 125 µl BSA in S2-S7. 7 µl adiponectin standard (2 ng/ml) was then poured in S1 and vortexed for some seconds, 125 µl from S1 was then diluted in S2 and vortexed, 125 µl was then poured in S3 etc. Samples were diluted in BSA (dilution factor depended on the Bradford values). The washing step was repeated before addition of the samples and standards. All samples and standards (with a blank well, only BSA) was applied in duplicate in the 96-well plate and incubated for two hours at room temperature.
The washing step was again repeated before the next step. Detection antibody, diluted in BSA (see supplement A) was added to the 96-well plate. The 96-well plate was then covered and incubated for two hours at room temperature. After repeating the washing step a mixture of streptavidin-HRP (diluted 1:200) and BSA was added to each well. The plate was incubated at 20 minutes at room temperature in the dark, to avoid direct light. The washing step was again repeated before adding 5 ml substrate solution (1:1 mixture of reagent A and reagent B), covered and incubated for 10-20 minutes at room temperature in the dark. A blue color appearedand 25 µl stop solution (2N H2SO4, diluted sulfuric acid) was added to each well and the color of the solution changed to yellow. The absorbance at 450 nm was read using a microplate reader (SoftMax Pro 7.0. software).
The secreted amount of adiponectin levels was expressed in relation to the protein amount by using Bradford Assay. If the result from the microplate reader showed a difference between the duplicates, CV % value > 10 based on one assay, the assay was repeated or the results discarded, the assay was repeted 2-4 times. The assay was repeated till the difference between the duplicates showed less than 10% (CV % > 10%).
3.4 Measurement of leptin and adiponectin in mouse serum
During termination of isolation subcutaneous fat, blood was collected from the axillary vessels (subclavian artery and vein). The serum was left to coagulate for an hour in room’s temperature, then table-top centrifuged in one minute (40C) at 1000 rmp. The serum was
then separated by transporting the top layer (serum) to another tube. Serum adiponectin concentration was measured using a serum adiponectin ELISA kit (Mouse Adiponectin ELISA Kit, 2901886)as previously described above.
Moreover, a specific ELISA kit for leptin was obtained from Bio-Ocean LLC (Lexington). The leptin content was measured in the mouse serum. The preparation and the
8
measurement of the serum leptin were done according to the BioOcean® Mouse Leptin
ELISA kit protocol, which is in essence the same as described previously.
3.5 Measurement of gene expression
The gene-expression of caveolin 1 was measured by Real-Time quantitative Polymerase Chain Reaction (RT qPCR). RT-qPCR is used to analysis the gene expression of caveolin 1 in mice fed chow and HFD. The starting material in this method is RNA that is first trascripted into complementary cDNA by reverse transcripting the total RNA. The total RNA was isolated using ReliaPrepTM RNA Cell Miniprep System (TM370) from Promega.
The cDNA was then used as a template for the qPCR.
RNA was retro-transcribed to cDNA. The preparation of primer solutions was made by mixing DNA-free water (MQ-Water/dH2O), SYBR Green Master Mix (Applied Biosystems
Fast SYBR® Green Master Mix, 4385612) and two primers (forward and reverse, specific for the gene of interest,see supplement A). β- actin was used to normalize the result of the gene expression using the relative ΔCt method described by Liviak et al [33]. The assay was
done in a 96-well Fast PCR plate. The samples was run in duplicates and measured with QuantStudioTM Real-Time PCR Software.
3.6 Statistical analysis
The data was analyzed by using student’-s t-test (using Excel) to evaluate the statistical significance of differences between groups. The results will be expressed as means ± SEM and the differences between the groups will be considered as statistically significant (p value <0,05).Relative ΔCt method (described by Liviak et al [33] was used to analyze the
gene expression of caveolin 1.
3.7 Ethical considerations
The local ethics committee at Gothenburg University authorizes ethical permissions for the use of murine and human tissues. All procedures follow the rules of the Swedish Research Council. All human subjects gave their informed written consent.
4. Results
4.1 Secretion of adiponectin via caveolae in mice
Adiponectin secretion was stimulated in three test groups; a control group with caveolae, a β-cyklodextrin group (treated with β-cyklodextrin to remove caveolae) and a caveolin-1 null mice (KO), which lacks caveolin-1, to investigate if adiponectin secretion is secreted via the plasma membrane region caveolae.
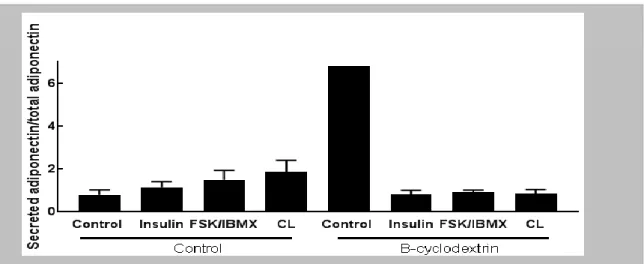
We stimulated murine adipocytes, isolated from white adipose tissue, with insulin, FSK/IBMX and CL divided in two groups a control one and one incubated with β-cyklodextrin previously shown to deplete caveolae [32] in adipocytes. We observed adiponectin secretion in the control group n= 4-6 (6 mice), especially when stimulated with CL (P 0,0003) and insulin (P 0,003), compared to the stimulation of FSK/IBMX (figure 4). However the stimulation of FSK/IBMX was also significant (P 0,006). The insulin and FSK/IBMX stimulated adiponectin secretion was very low in the β-cyklodextrin group n=4-5 (6 mice) (figure 4) we found increased adiponectin secretion when stimulated with CL (p 0,119) in β-cyklodextrin group (figure 4). Many repeats (2-4 repeats) was done to achieve convenient CV value (CV % value >10) on 6 mice.
To determine if the caveolae structure really plays a role in adiponectin secretion, we next stimulated adiponectin secretion in knockout mice (KO), lacking caveolin 1 (n=4-6, 5 mice). These mice have no caveolae, as previously mentioned. We found no increasedadiponectin secretion to any of the secretagogs; which is significantly different between the WT (the “control-group”) and caveolin-1 null mice (KO) (Figure 4).
9
4.2 Secretion of adiponectin via caveolae in human adipocytes
To compare our results from murine cells, we also stimulate human adipose cells in the same way as the murine cells. The results closely resembled the murine data, showing stimulation of adiponectin secretion with the known secretagogs, which was abolished in the group treated with B-cyklodextrin (lacking caveolae), see figure 5. We found slightly higher amount of adiponectin secreted when stimulating with CL compared to the stimulations with FSK/IBMX and insulin, but the differences are not significant. The group treated with β-cyklodextrin does not show any stimulation of adiponectin secretion.
4.3 Gene expression of caveolae
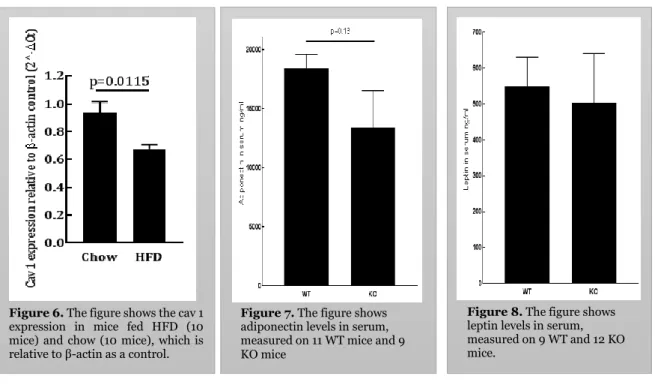
To investigate whether caveolin 1 expression is affected by HFD, we chose to perform a qt-PCR measurement on subcutaneous fat from mice fed chow (10 mice) or HFD (10 mice) during 16 weeks. The mice were 4 weeks at initiation of the diet intervention. The HFD-fed mice were significantly (p 0,00032) heavier (average weight 28,5 g) compared to chow-fed mice (average weight 22,0 g). We calculated ΔCt and obtained that HFD fed mice
Figure 4. The figure shows the stimulation of cells using insulin (200 nM), FSK/IBMX (10 µM/200 mM) and Cl (10 µM) in different groups. The control group is the group with caveolae,
Betacyklodextrin (50 nM) lacks caveolae and Cav 1 indicates the caveolin-1 null mice. The results
are obtained from 6 animals measured in several technical repeats. The data is presented as means ± SEM, n=4-6.
P ≤ 0,05 = * P ≤ 0,01 = ** P ≤ 0,001 = ***
Figure 5. The figure shows adiponectin secretion from human cells. The graphs shows adiponectin secretion stimulated with insulin, FSK/IBMX and CL in two different groups. Control group (with caveolae) and β-cyklodextrin (lacks caveolae). This data is collected from 1 human. The data is presented as means ± SEM. The controls in “control” and “B-cyclodextrin “ are not normalized to means of control
10
significantly (p= 0,0115) lower caveolin 1 gene expression compared to mice fed Chow diet, see figure 6.
4.4 Serum adiponectin and leptin levels
Circulating levels of adiponectin, measured in mouse serum, was lower in the caveolin-1 null mice (KO) compared to their WT littermates (figure 7); the difference is not significant. Here we used serum from 11 WT mice and 9 caveolin-1 null mice (KO). Moreover, leptin levels in serum were slightly lower in caveolin-1 null mice (KO) than in the WT littermates (figure 8); the difference was again not significant. We used 9 mice (WT) and 12 caveolin-1 null mice (KO) when measuring the serum leptin levels.
5. Discussion
The data that is used in this report is not completed to achieve a complete picture of the results. The reason is because of both time and limited access to human cells. The mice are also in some manner limited considering the waiting time for them to grow.
The stimulated adiponectin secretion has lately been an interesting question since adiponectin improve insulin sensitivity in major insulin target tissues and decreases the risk of type 2- diabetes [3], [9]. It has previously been shown that abolishing plasma membrane invagination caveolae; decrease adiponectin levels [3]. In this thesis, we have hypothesized that adiponectin is secreted via caveolae.
5.1 Model system and methodology
In the current work, we have studied adiponectin secretion and the role of caveolae in adiponectin secretion. The adiponectin secretion was studied in vitro in primary subcutaneous adipocytes isolated from mice. The fat was recovered from mice 6 weeks after birth since it is considered as a young adult age and have a more stable growth and have more ”mature cells” in order to mimic an adult’s state.
There are several methods to measure the secreted adiponectin in the media, such as I) Mass Spectro Metry (MS), II) SDS-PAGE-western blot and III) ELISA. The reason for choosing ELISA over the other two methods is that it is the fastest and cheapest method, which can also give quantitative results. In comparison to MS ELISA is inexpensive, mainly because the sample preparations for MS are tedious and time consuming.
Figure 6. The figure shows the cav 1 expression in mice fed HFD (10 mice) and chow (10 mice), which is relative to β-actin as a control.
Figure 8. The figure shows leptin levels in serum, measured on 9 WT and 12 KO mice.
Figure 7. The figure shows adiponectin levels in serum, measured on 11 WT mice and 9 KO mice
11
SDS-PAGE-western blot, on the other hand, could be a possible choice, mainly since it would have given extra information about the amounts of the different isoforms of adiponectin in the sample. This can be very valuable information in future studies, however not needed to answer our current question. Furthermore, SDS-PAGE-western blotting is more time- consuming than ELISA and results in semi -quantative results.
Several methods for normalizing for possible differences in number of cells between the different animals are available. The one that was used in this study is the Bradford assay. This method measures the total protein content, which is closely related to the cell number. Another possible method for normalization would have been to measure total DNA content in the samples, using a Pico green assay. This would be a bit more expensive to use, but maybe a bit more precise.
There are two main variabilities to consider when using ELISA and Bradford assays, the biological variance and the technical variance. Biological variance can appear between the different animals. To compensate for biological variations we used multiple animals for each series. Technical variance, on the other hand, can occur as a consequence of the accuracy of the assays we run, pipetting, temperature of the room, together these variations are sometimes called “daily variations”. To minimize the effects of the technical variations on our results we run our samples in duplicates (not more than duplicates because of the limited amount of material used).
5.2 The difference between human and mouse
Findings in mice, from numerous studies, are typically extrapolated to describe mechanisms in humans [34]. Mice have during many years been a valuable model organism for human disease. Many processes are widely assumed to be highly conserved with humans, such as biochemical, cellular and developmental pathways [35]. However, as we all know, there are differences between mice and human.
In this work we study adiponectin secretion from human adipocytes as well as murine adipocytes. We would to some extent like to extrapolate our data from murine cells to human cells. Doing this, it is very important to understand that there might be differences between the two species. In all aspects of adiponectin exocytosis that have been investigated this far, these has been qualitative as well as quantitative resemblance between the results from murine and human adipocytes ([3][36][37][38]). We have limited access to human material and therefore we only use that to confirm our most important findings from murine cells. Hence, we cannot be entirely sure that our results resemble what is going on in humans.
To confirm the data from mice, the human cells provided similar data as we obtained in mice. Our study on mice and human adipocyte cells showed a coupling between adiponectin and caveolae, thus caveolae is site of action in adiponectin secretion. Butthe results that we obtained showed also that there might be another pathway for adiponectin to be secreted. However, the data from human cells are collected from one human, which should be taken into consideration. More human samples are needed to be able to confirm the data from mice.
5.3 Secretion of adiponectin via caveolae
The isolated cells were stimulated with the known adiponectin secretagogs insulin, FSK/IBMX and CL ([18], [19]) We chose to incubate for 30 min because it is the optimal time of short time regulated adiponectin secretion studies as found previously ([18], [19]) On the other hand long-term regulation (hours to days) has in previous studies showed to reduce secretion of adiponectin [18].
To determine the role of caveolae in adiponectin secretion, we stimulated adiponectin secretion using previously described secretagogs in adipocytes from caveolin-1 null mice (KO). These knock out mice have no caveolae structure. We found that the stimulation of
12
adiponectin secretion from caveolin-1 null adipocytes is lower than in WT controls. That supports that caveolae can have a role in adiponectin secretion.
To use a completely different way of abolishing caveolae we depleted the structure chemically, using methyl- β-cyklodextrin that will extract cholesterol from the plasma membrane. This method is rather harsh but has previously been used by others to study human adipocytes [32]. It is suggested that long-term adverse the adiponectin secretion, thus suggesting drain of adiponectin-containing vesicles [18]. Using two different methods to deplete the cells of the caveolae structure serves to exclude that our findings on the adiponectin secretion are not unspecific effects related to the method used.
As it is shown in the results above, we found higherbasal adiponectin levels from the cells treated with β-cyklodextrin as compared to control (figure 4). This might be an indication of toxicity of the β-cyklodextrin. However, we found a similarly increased basal adiponectin release from the caveolin 1 KO adipocytes (figure 4), were no such toxicity is present. It is possible that cells contain different amount of adiponectin between the groups and that might influence our measurements. Another possibility is that as adiponectin secretion cannot be stimulated there is spillover resulting in increased constitutive adiponectin secretion.
In normal case, when the cell membrane is not treated with β-cyklodextrin, insulin and CL stimulate adiponectin through insulin receptor (IR) and β3-receptor. On the other hand, disrupting the cell membrane by treating with β-cyklodextrin affect the whole membrane (which is rich in cholesterol), especially caveolae since it contains higher amount of cholesterol and that might have led to disrupting the receptors, thereby decreased secretion of adiponectin. Since the stimulation on cells treated with β-cyklodextrin also showed a slight adiponectin secretion, thus another pathway of adiponectin secretion, or the IR receptor and β3-receptor can on a level still stimulate adiponectin secretion.
There are several steps in exocytosis and the entire process of adiponectin secretion is proposed to be a sequential regulation by Ca2+, cAMP and ATP [30]. With that we can
speculate that β-cyklodextrin might disturb one or several of these regulation steps and hence cause the lack of stimulation of adiponectin release by known secretagogs that we find in the β-cyklodextrin group (figure 4).
Since adiponectin exocytosis was stimulated via catecholamine by binding to β-3-adrenergic receptors [3], we then suggest that the stimulation via catecholamine receptors might be reason behind the adiponectin levels in this group (CL). It is possible since the mice we used for this part of experiment were lean mice and fed with regular chow, because the adrenergically stimulated adiponectin was previously shown to be reduced in obese mice because of the reduced levels of β-3-adrenergic receptors, which are referred to as catecholamine resistance [3].
We noticed also that the cells stimulated with insulin showed higher adiponectin levels when compared with FSK/IBMX. This indicates that insulin is a better adiponectin secretion stimulant, in short-term regulation. Even though the regulation of insulin- induced adiponectin secretion is not fully known, it is suggested that it is dependent on activation of phosphoinositide 3 - kinase [38], [7]. As has been showed, several adiponectin forms have different signaling routes and the most available forms in human are the MMW and HMW adiponectin [7].
5.4 Are serum adiponectin and leptin levels affected by caveolae?
We found that absence of caveolae; using caveolin 1 knock out mice reduced (not significant) the levels of adiponectin in serum (figure 7). This is in line with our results indicating the importance of caveolae for the adiponectin secretion. However, the plasma levels of leptin were also slightly reduced (not significant) in the caveolin 1 knock out mice (figure 8), thus the experiment must be repeated. This might be due to caveolae, which also can be important for the pathway for leptin secretion. Or it is due to that the caveolin-1 null
13
mice have over all disturbed adipocytes and hence the secretion of leptin is affected by a non-specific mechanism. If comparing the levels of adiponectin and leptin in figure 7 and figure 8 above, we find that the adiponectin levels is higher than the levels of leptin, which was expected ([3], [4]). As it is mentioned above leptin levels is reduced in lean individuals while adiponectin levels are increased.
5.5 Is Caveolin expression affected by HFD?
The results that we obtained in this study showed that the expression of cavoelin 1 is affected by HFD. As shown in figure 6 the expression of caveolin 1 in mouse fed HFD is significantly lower as compared to the chow fed mice, thus indicates a reduced cavoelin 1 expression in obesity. This result is in agreement with the fact that adiponectin secretion is reduced in obesity. The process behind the downregulation of caveolin 1 is unclear. However the downregulation of caveolin 1 during HFD is time dependent, as earlier tests on mice fed HFD in 8 weeks did not show a significant difference between the groups but the 16 weeks test (figure 6) showed a significant difference. This might mean that prolonged HFD or obesity is needed to reduce the caveolin 1 levels. Our results are very interesting, as stimulated adiponectin secretion seems to be depending on intact caveolae and if HFD reduces caveolin 1 which is essential for forming caveolae, this might be an explanation to the intriguing reduced adiponectin secretion found in human obesity [3].
5.6 Future researches
Why is there still some adiponectin secretion when caveolae is removed? It is likely that there might be other pathways for adiponectin release; which is worth to investigate because the strong association of decrease adiponectin levels in obese and diabetic. Fully understanding the mechanism of controlling adiponectin secretion is highly important in order to increase the levels of adiponectin. This might lead to a promising pharmaceutical target.It can also be worth to investigate if other pathways of adiponectin secretion can be stimulated. That would increase the secretion of adiponectin by targeting several pathways. Further, this would lead to reduce damages that might be caused when utilizing one pathway.
The promising results that we obtained in this study (current gene- expression of caveolae) can be studied further. The reason of reduced gene- expression of caveolae in obese need to be understood since it can be another point of view in understanding the adiponectin secretion. That would maybe enable enhance/increase the adiponectin secretion in obese individuals.
6. Conclusions
In conclution, this study showed that Caveolae have a role in stimulated secretion of adiponectin. The secretagogues insulin and CL showed to serve a stronger stimulation for adiponectin secretion in mice than FSK/IMBX. The results from serum adiponectin and leptin levels were not signifacant thus no conclution can be taken upon them, the experiments need to be repeated and perhaps with more data. The reduced caveolin 1 gene expression in mice fed HFD indicates a reduced cavoelin 1 expression in obesity.
14
7. Acknowledgement
In the accomplishment of this project, I would like to thank many people that have bestowed upon me their blessing and support. Here, I utilize to thank everyone for their help and support.
I would like to express my sincere gratitude to Associate Professor Dr. Charlotta Olofsson for providing me an opportunity to do my master's thesis at the unit of metabolic physiology.
I would also like to express my special gratitude and thanks to my supervisor Dr. Cecilia Brännmark, at Göteborg university, for her guidance and constant supervision as well as providing necessary information regarding the project but also for her support and special thanks for her supporting words that gave me strength to accomplish this project.
I am very thankful to Saliha Musovic, post-graduate student at the unit of metabolic physiology, for always being in charge in emergency situations in the lab. I would also like to thank my supervisor Dr. Anders Öhman, at Umeå University, for being available during the project.
Last but not least I would like to thank my husband for his moral and practical support during my whole study time, but also my family for their support and my two sons for their patience.
15
8. References
[1] Leitne D. R, Frühbeck G, Yumuk V, Schindler K, Micic D, Woodward E et al., Obesity and Type 2 diabetes: Two diseases with a need for combined treatment strategies-EASO can lead the way. Obes facts. 2017 Oct. 10(5): 483-492.
[2] Ruan H, Dong L. Q. Adiponectin signaling and function in insulin target tissues. J Mol Cell Biol. 2016 Apr, 8(2): 101-109.
[3] Spranger J, Kroke A, Möhlig M, Bergmann M.M, Ristow M, Boeing H, et al. Adiponectin and protection against type 2 diabetes mellitus. Lancet. 2003 Jan. 18;361(9553): 226-8.
[4] Hivert M. F, Manning AK, McAteer JB, Florez JC, Dupuis J, Fox C.S et al. Common variants in the adiponectin gene (ADIPOQ) associated with plasma adiponectin levels, type 2 diabetes, and diabetes-related quantitative traits: the Framingham Offspring Study. Diabetes. 2008 Dec, 57(12): 3353–3359
[5] DeClercq V, d'Eon B, McLeod R. S, Fatty acids increase adiponectin secretion through both classical and exosome pathways. Biochimica biophysica acta. 2015 Sep. 1851(9): 1123-1133.
[6] Liu M, Chen H, Wei L, Hu D, Dong K, Jia W, et al., Endoplasmic reticulum (ER) localization is critical for DsbA-L protein to suppress ER stress and adiponectin down-regulation in adipocytes. J Bio Chem. 2015 Apr. 290(16): 10143-10148. [7] Brochu-Gaudreau, K, Rehfeldt C, Blouin R, Bordingon V, Murphy BD, Palin M.F,
Adiponectin action from head to toe. Endocrine, 2010 Feb. 37(1): p. 11-32.
[8] Simpson K. A, Singh M. A, Effects of exercise on adiponectin: A systematic review, Obesity (Silver Spring). 2008 Feb. 16 (2): 241-56.
[9] Mondal A. K, Das S.K, Varma V, Nolen GT, McGehee R.E, Elbin S.C et al., Effect of endoplasmic reticulum stress on inflammation and adiponectin regulation in human adipocytes. Metab Syndr Relat Disord. 2012 Aug. 10(4): 297-306.
[10] Skypnik K, Suliburska J, Skypnik D, Pilarski T, Regula J, Bogdanski P. The genetic basis of obesity complications. Acta Sci Pol Technol Aliment. 2017 Jan. 16 (1): 83-91
[11] Cohen AW, Razani B, Schubert W, Williams TM, Wang XB, Iyengar P et al. Role of caveolin-1 in the modulation of lipolysis and lipid droplet formation. Diabetes. 2004 May. 53 (5):1261–1270.
[12] Carter S, Caron A, Richard D, Picard F. Role of leptin resistance in the development of obesity in older patients. Clin Interv Aging. 2013 Jul. 8: 829-844.
[13] Barr VA, Malide D, Zarnowski MJ, Taylor SI, Cushman SW. Insulin stimulates both leptin secretion and production by rat white adipose tissue. Endocrinology. 1997 Oct. 138 (10):4463–4472.
[14] R. D. Burgoyne, A. Morgan, Secretory granule exocytosis. Physiol Rev. 2003 Apr. 83(2): 581-632.
16
[15] Lim C.Y, Hong W, Han W, Adiponectin is released via a unque regulated exocytosis pathway from a pre-formed vesicle pool on insulin stimulation. Biochem J. 2015 Nov. 471(3): 381-389.
[16] McClean Ph, Johansson Ch. Virtual cell animation collection [Internet]. U.S: National Scince Foundation [cited 2017-11-08]. Available from:http://vcell.ndsu.edu/animations/constitutivesecretion/index.htm
[17] Burgoyne R.D., Morgan A. Secretory granule exocytosis. Physiol Rev. 2003 Apr. 83(2): 581-632.
[18] Komai A. M. Musovic S, Peris E, Alrifaiy A, El Hachmane M.F, Johansson M, et al., White Adipocyte Adiponectin Exocytosis Is Stimulated via beta3-Adrenergic Signaling and Activation of Epac1: Catecholamine Resistance in Obesity and Type 2 Diabetes. Diabetes. 2016 Nov. 65(11): 3301-3313.
[19] Komai, A.M, Brännmark C, Musovic S, Olofsson CS, et al., PKA-independent cAMP
stimulation of white adipocyte exocytosis and adipokine secretion: modulations by Ca2+ and ATP. J Physiol. 2014 Dec. 592(23): 5169-86.
[20] Himms-Hagen J, Cui J, Danforth E. Jr., Taatjes D.J, Lang S.S, Waters B.L et al. Effect of CL-316,243, athermogenic beta 3-agonist, on energy balance and brown and white adipose tissues in rat. Am J physiol 1994 Apr. 266(4 Pt 2): 1371-82
[21] Cong L, Chen K, Li J, Ping G, Li Q, Mi SH et al. Regulation of adiponectin and leptin secretion and expression by insulin through a PI3K-PDE3B dependent mechanism in rat primary adipocytes. Biochemical J. 2007 May. 403 (3): 519-525.
[22] Komai A. M, Brännmark C, Musovic S, Olofsson C. S, PKA-independent cAMP stimulation of white adipocyte exocytosis and adipokine secretion: modulations by Ca2+ and ATP. J Physiol. 2014 Dec. 592 (23), 5169-5186.
[23] Ortegren K.U, Yin L, Öst A, Karlsson H. Separation and characterization of caveolae subclasses in the plasma membrane of primary adipocytes; segregation of specific proteins and functions. FEBS J. 2006. 273(14): 3381-92.
[24] Asterholm, I.W, Mundy D.I, Weng J, Anderson R.G, Scherer P.E. Altered mitochondrial function and metabolic inflexibility associated with loss of caveolin-1. Cell Metab. 2012 Feb. 15(2): 171-85.
[25] Combs TP, Pajvani UB, Berg AH, Lin Y, Jelicks LA, Laplante M, et al. A transgenic mouse with a deletion in the collagenous domain of adiponectin displays elevated circulating adiponectin and improved insulin sensitivity. Endocrinology. 2004 Jan. 145(1): 367–383.
[26] López I.P, Milagro F.I, Martí A, Moreno-Aliaga M.J, Martínez JA, De Miguel. Gene expression changes in rat white adipose tissue after a high-fat diet determined by differential display. Biochem Biophys Res Commun. 2005 Jul. 318(1): 234–239 [27] Gortmaker SL, Swinburn B, Levy D, Carter R, Mabry PL, Finegood D, et al.
Changing the Future of Obesity: Science, Policy and Action. 2011 Aug; 378(9793): 838-847.
[28] Warden CH, Fisler JS. Comparisons of diets used in animal models of high fat feeding. Cell Metab 7. 2008 Apr; 7 (4): 277.
17
[29] Patrice D.C, Bibiloni R, Knauf C, Waget A, Neyrinck A.M, Delzenne N.M et al. Changes in Gut Microbiota Control Metabolic Endotoxemia-Induced Inflamation in High-Fat Diet-Induced Obesity and Diabetes in Mice. Diabetes. 2008 Jun; 57 (6): 1470-1481.
[30] Omatsu-Kanbe M, Matsuura H. Novel intracellular mediator of adiponectin secretion from adipocytes. J Physiol. 2014 Dec; 592 (23): 5141.
[31] Murdolo G, Kempf K, Hammarstedt A, Herder C, Smith U, Jansson PA. Insulin differentially modulates the peripheral endocannabinoid system in human subcutaneous abdominal adipose tissue from lean and obese individuals. J Endocrinol Invest. 2008 Aug. 30:17–21
[32] Parpal S, Karlsson M, Thorn H, Strålfors P. Cholesterol depletion disrupts caveolae and insulin receptor signaling for metabolic control via insulin receptor substrate-1, but not for mitogen-activated protein kinase control. J Bio Chem 276. 2001 Mar. 276 (13): 9670-8.
[33] Livak KJ, Schmittgen TD. Analysis of relative gene expression data using real-time quantitative PCR and the 2(-Delta Delta C(T)) Method. Methods. 2001 Dec. 25 (4): 402-8.
[34] J. Dolensek, M. S. Rupnik, A. Stozer, Structural similarities and diffrences between the human and the mouse pancreas. Islets, 2015. 7(1): 1024405
[35] L. Shin et al., Comparison of the transcriptional landscapes between human and mouse tissues. Proc Nati Acad Sci U S A., 2014. 111(48): 17224 -17229.
[36] Brännmark C, Paul A, Ribeiro D, Magnusson B, Gabriella Brolen, Enejder A, et al., Increased adipogenesis of human adipose-derived stem cells on polycaprolactone matrices. Plos One. 2014 Nov. 9(11):e 113620.
[37] Nyman E, Rajan M.R Fagerholm S, Brännmark C, Cendersund G, Strålfors P. A single mechanism can explain network-wide insulin resistance in adipocytes from obese patients with type 2 diabetes. J Bio Chem. 2014 Nov. 28; 289 (48): 33215-30. [38] Brännmark C, Nyman E, Fagerholm S, Bergenholm L, Ekstrand E.M, Cendersund G, et al., Insulin signaling in type 2 diabetes: experimental and modeling analyses reveal mechanisms of insulin resistance in human adipocytes. J Bio Chem. 2013 Apr. 5; 288(14): 9867-80.
18
Supplement A
Table 1. Primary sequence
Table 2. Concentration and calculations of needed compound
Mouse Adiponectin/Acrp30 (DY1119)
Capture Antibody (CA) C + 1,0 ml PBS = 360 µl/ml
Working concentration = 2,0 µg/ml Calculation of working volume:
(2,0 µg/ml x 5,0 ml PBS)/360 µg/ml = 27,77 = 28 µl
(The amont is for one 96-well plate) Detection Antibody
(D) D + 1,0 ml BSA = 4,5 µg/ml Working concentration = 25 ng/ml
(25 ng/ml x 5,0 ml BSA) / 4,5 µg/ml = 27,77 = 28 µl
(The amont is for one 96-well plate) Standard (S) S + 0,5 ml BSA = 65 ng/ ml
(The standard should sit for minimum 15 min with gentle stirring to make dilutions) Highest S:
Concentration = 2000 pg/ml = 2 ng/ml Volume = 250 µl
(2 ng/ml x 250 µl) / 65 ng/ ml = 7,69 µl = 8 µl
Table 3. Needed solutions
Phosphate Buffered Saline (PBS) (stimulations, ELISA and protein measurements)
1 L, pH 7,4
1000 ml Milli-Q-Water, 2 PBS tablets
Lysis buffer (stimulations) 10 ml PBS, 200 µl (2 %)SDS, 1 complete EDTA free protease inhibitor tablet
Wash buffer (ELISA)
1 L, pH 7,4 1000 ml Milli-Q-Water, 2 PBS tablets, 0,5 ml concentrated Tween
BSA 1 % (ELISA)
1 L, pH 7,4 1000 ml Milli-Q-Water, 2 PBS tablets, 10g BSA
Oligo Name
Sequence (5' to 3')
Cav1 FW
ATGGCAGACGAGCTGAGCGAG
19
Department of Pharmacology and Clinical NeuroscienceUmeå University
SE-901 87 Umeå, Sweden www.umu.se