Examensarbete 30 hp
Augusti 2008
Query-Based Visualization of
Iso-Surfaces for Tetrahedral Meshes
Muhammad Zahid Abbas
Pokala Prasad
Institutionen för informationsteknologi
Teknisk- naturvetenskaplig fakultet UTH-enheten Besöksadress: Ångströmlaboratoriet Lägerhyddsvägen 1 Hus 4, Plan 0 Postadress: Box 536 751 21 Uppsala Telefon: 018 – 471 30 03 Telefax: 018 – 471 30 00 Hemsida: http://www.teknat.uu.se/student
Query-Based Visualization of Iso-Surfaces for
Tetrahedral Meshes
Muhammad Zahid Abbas and Pokala Prasad
This is an application of information visualization in object relational database. This will present query based visualization of iso-surfaces for tetrahedral meshes. An Amos 2 object-relational database is used for domain modeling of discrete geometrical objects (like points) and for assigning them temperature values. Java 3D API is used to visualize the result of graphical queries. AmosQL an extensible query language has been used for database design and for composing of graphical queries. This report also has some basic information about OpenGL (API) and spatial query languages attributes (like their famous algorithms). In this application, Delauny triangulation and interpolation of vertices play major role for construction of iso-surfaces. Simulation of work is done by usage of sample queries in different size of meshes according to 3D coordinates. Interpolation is done for the usage of colors spectrum to display different isosurfaces based on their temperature values. Finally, we have discussed scalability of this application for future work. By using of this application users can compose queries and have 3D visual results against their geometrical and temperature queries.
Tryckt av: Reprocentralen ITC IT 08 029
Examinator: Anders Jansson Ämnesgranskare: Kjell Orsborn Handledare: Kjell Orsborn
Preface
This research is conducted in Uppsala Database Laboratory of Uppsala University Sweden. The main goal of this laboratory is to design and implement an object relational database (Amos 2). An Amos 2 is a main memory database, which has a property that it can work as a mediator between multiple types of clients and multiple kinds of data sources. AmosQL an extensible query language is a main part of Amos 2 project. AmosQL is more flexible to support object oriented user defined queries and functions. This thesis work is related with AmosQL query based information visualization of temperature contours in Amos 2 database. This thesis has been done by two students of Master in Computer Science at Uppsala University, Sweden. The participants are following:
1. Muhammad Zahid Abbas, MSc student in Computer Science, Uppsala Uni-versity, Sweden.
2. Pokala Prasad, MSc student in Computer Science, Uppsala University, Swe-den.
3. Kjell Orsborn, Examiner and supervisor at Department of Information Tech-nology, Uppsala University.
Table of Contents
1 Introduction . . . 6
1.1 Thesis Work . . . 7
1.2 Contributions . . . 8
1.3 Report Outline . . . 8
2 Related Work and Theories . . . 9
3 Finite Element Analysis . . . 11
3.1 Introduction . . . 11
3.2 Finite Element Analysis Process . . . 11
Finite Elements Analysis Importance in Computer Aided design 11 FEA Models . . . 12
Finite Element Analysis phases . . . 12
FE Analysis importance . . . 13
4 Database Techniques . . . 13
4.1 Different types of database models . . . 14
Hierarchical data Model . . . 14
Network database Model . . . 14
Relational database Model . . . 14
Object Oriented Database Model . . . 14
Object Relational Database Model . . . 14
4.2 Spatial Database Systems . . . 14
Modeling in spatial databases . . . 15
Spatial Relationships: . . . 15
Pros and Cons of spatial data modelling . . . 15
4.3 AMOS 2 . . . 15
Amos 2 as a Mediator . . . 16
Amos 2 java Interface . . . 16
4.4 Spatial Query processing in databases . . . 17
Famous algorithms for querying in spatial databases . . . 17
Spatial Operations . . . 17
AmosQL query language . . . 18
5 Visualization Techniques . . . 18
Common Attributes of Standard APIs . . . 18
5.1 OpenGL . . . 19
Introduction . . . 19
Open GL Architecture . . . 19
5.2 JAVA 3D API . . . 20
JAVA 3D API Design Goals . . . 20
JAVA 3D API Versus Other APIs . . . 21
Scene Graph Programming Model . . . 21
Using of Java 3D API in iso-surfacess (contours) construction and visualization . . . 22
6 Domain Model . . . 24
6.1 Mesh Techniques . . . 24
Structured Mesh . . . 24
Unstructured Mesh . . . 24
6.2 Mesh Model in Amos 2 . . . 24
Schema (commands) for designing of Geometrical Mesh model 24 6.3 Finite Elements Mesh . . . 27
Tetrahedron Mesh . . . 27
6.4 Finite Element Procedure . . . 29
Boundary conditions . . . 29
Finding of iso levels on each edge of the triangle . . . 29
Calculation and generation of iso level points . . . 30
6.5 Contours Generation process . . . 31
Interpolation(Connection of points and drawing of Triangulated surfaces) . . . 31
Contour colors pattern generation on the base of iso levels . . . 31
Contour Generation Steps . . . 32
6.6 Data Model . . . 36
7 Spatial Queries and their results . . . 37
7.1 Sample queries . . . 37
7.2 Sample models . . . 38
7.3 Cutting on the base of geometrical queries . . . 39
7.4 Cutting of the planes from 3D Mesh . . . 39
8 Conclusion and Further work . . . 40
8.1 Future work . . . 40
Importance of this application in other fields . . . 40
Further Enhancements . . . 41
List of Figures
1 Basic Architecture of Finite Element Analysis . . . 11
2 Finite Element importance in Computer Aided Design . . . 12
3 Basic elements and their relationships in Amos 2 data model . . . 16
4 Open GL pipeline . . . 20
5 Scene Graph java 3D API . . . 22
6 Contour generation data structures (java 3D API) . . . 23
7 Basic Mesh Model . . . 26
8 Transparent Tetrahedron Mesh . . . 28
9 One edge of a triangle . . . 30
10 Division of triangle edge into different iso levels of temperature . . . 30
11 Triangle Element without subdivision into iso-levels . . . 33
12 Triangle Element with subdivision into two iso-levels . . . 33
13 Triangle Element with subdivision into three iso-levels . . . 34
14 Triangulated Element of 2D space . . . 34
15 Tetrahedral element with 3D triangulated contours . . . 35
16 Temperature Contours on 3D Tetrahedral Mesh . . . 35
17 3D Iso-Surfaces Generator on the basis of Temperature values . . . 36
18 Amos 2 Query result to display sample models for different size of Tetrahedral meshes . . . 38
19 Transparent Tetrahedron Meshes of different size. . . 38
20 Amos 2 Queries results on the basis of different geometrical coordinate and temperature values . . . 39
21 Amos 2 Queries results for planes cutting samples from mesh model (a) of section 7.2 . . . 39
1 Introduction
This thesis treats query-based visualization capabilities of spatially distributed scientific and engineering data that is usually generated in computational appli-cations. During this work three main areas of research are explored, importance of object oriented main memory database in spatial applications, help of compu-tational work in spatial data modeling and query based information visualization. Before going into details of this thesis work, first we are describing a bit infor-mation about these areas of research.
Today, database management systems (DBMSs) plays a vital role in many types of computer applications, as in conventional business administration, most web-based applications and in more advanced applications in data warehousing and mining. The database system is also considered as a basis for complex applica-tions as found in complex scientific and engineering applicaapplica-tions. These appli-cations are found in many different computational appliappli-cations in various dis-ciplines including impact analysis of mobile phones, structural analysis of air-crafts, earthquake analysis, analysis of blood flow in human hearts and analysis of weather forecasting.
These complex applications normally require more advanced modeling techniques as provided by the oriented model found in oriented and object-relational database management systems. For example, many applications involve modeling and mathematical analysis of three-dimensional (3D) spatial and tem-poral concepts such as geometries and other quantities distributed over these geometries, like temperature or velocity distributions. Conventional relational database systems are not well-suited to model and manage these type of data since the relational data model is to rigid.
Data of this type also normally need tailored data representations to meet the high requirements on computational performance usually involved. Here, the tech-niques of main-memory databases have many advantages in comparison to con-ventional disk-based systems running the database from hard disk since main-memory database has much faster response time and it helps in computational work as well [1]. Now a days main-memory is relatively cheap and the size of memory is quite large, which can further be exploited using network databases.
Main purpose to use spatial data modeling and comuptational (numerical analy-sis) work in this thesis is to design an application which should work for query based visualization of scientific data. Query based visualization works for visual-ization of objects in object oriented databases rather than display of tables against queries of conventional databases. Query based visualization is a type of informa-tion visualizainforma-tion, which is normally used to visualize data which is not avaial-able in visual forms on the base of user queries, like scalar (temperature, density, volume, pressure etc) and vector (acceleration, displacement, etc) values. Spatial data modeling is commonly used to design data model for these kinds of the data. For visualization normally these values are associated with geometrical objects.
Besides, query based visualization can aggregates data in such a way that is easy to understand, but it is comparatively more difficult and complex to design and
implement data model for such kind of applications.
1.1 Thesis Work
The main focus of this thesis work was to build an application, which helps for visualization of queries results in 3D bodies. This work was concerned with query based visualization of the data in tetrahedron meshes. The project plan was to de-sign an application that was supposed to be simple in understanding of its domain model and gave good support for multiple types of views in tetrahedron meshes. The main important property of this application is its active behavior and quick response, because it can work on embedded queries and for good response we used main memory database. We have not used any JDBC/ODBC bridge to con-nect with database because query language is embedded in database.
This application was mainly involved with designing of domain model for 3D (tetrahedron) meshes and visualization of iso-surfaces on 3D (tetrahedron) meshes. Domain model has been designed on the basis of spatial database modeling tech-niques, which are normally used to design geometrical models for doing of spa-tial operations on complex scientific data. Firstly, we have designed geometrical meshes in our domain model, like structured mesh modeling was used for de-signing of basic mesh but for construction of iso-surfaces we used unstructured tetrahedron mesh. Our goal was to design tetrahedron meshes but as each tetra-hedron is made up from triangles so we considered triangles as a basic unit for our computational work and for the visualization of iso-surfaces. Triangles were chosed because these are basic geometry elements, which are commonly used in finite element modeling. Our technique for iso-surfaces constructions was based on dividing of high order surfaces (like tetrahedrons) into triangles and triangu-lation was used for the building of iso-surfaces. This triangutriangu-lation technique was worked like delauny triangulation to create sub triangles inside of each base trian-gle. As discussed before in introduction that information visualization works for representation of scalar (like temperature, density, volume, etc) and vector(like acceleration, displacement, etc) values by assigning of their values to geometri-cal objects but specifigeometri-cally in this application we have used temperature value to represent it on 3D iso-surfaces in tetrahedron meshes.
For Visualization, typically simple techniques are used to represent data, such as images, diagrams, graphs, bars and tree data structures. In this application we have used tree like data structure and a high level API (Java 3D API), which have rich libraries of constructs and its geometrical primitive functions (like points, lines, triangles, etc) are utilized in visualization of our discrete geometrical ob-jects. These primitive functions are much more important because they are al-ways basic identities of any geometrical model. Java 3D API was also used for visualization of iso-surfaces. Java 3D API has property that it follows tree like data structure in its scene graph model for rendering of geometrical objects and have good support of advanced computer graphics, which are normally used in finite element models. We have designed a specific interpolated colors spectrum for the display of different iso-surfaces and colors these iso-surfaces were di-rectly effected with their iso level temperature values. For easy to interact with application, users have opportunity to compose his own query for visualization
of iso-surfaces in tetrahedron meshes.
This thesis work is based on integration of the following 3 layers.
1. Database : An object relational main memory database (Amos 2) has been used in this application, which have support to design spatial data model. 2. Extensible query language: AmosQL query language has been used for
spa-tial operations, which have support to use object oriented queries.
3. Visual Interface: Java 3D API has been used to visualize results of spatial queries.
AmosQL queries worked for integration of the above layers, like basic geometri-cal objects and interface objects have been been connected by the use of foreign functions. Foreign functions are normally used in call-in interface of Amos 2 Java interface. After completion of this thesis, it is proved that Amos 2 database has a powerful mechanism to design spatial data model for object oriented applications and also have a support of extensible query language (AmosQL).
1.2 Contributions
The main contributions this thesis are followings.
1. Designing of data model for geometrical objects (in case of vertices, trian-gles, tetrahedrons).
2. Assigning of temperature value to each vertice by used of customized spher-ical formula.
3. Analysis of different visualization techniques.
4. How to create different types of mesh views (different types of cuttings, display of iso-levels with interpolated colors spectrum)?
5. How model can be more scalable for different size of 3D (tetrahedron) meshes? 6. A prototype model should be establish which can support sample queries
and display expected visual results.
7. Achievements and suggestion for improvements and future work.
1.3 Report Outline
This whole research report has been organized and divided into 8 chapters. The 1st chapter is comprised of research scope and thesis outline,the 2nd chapte con-sists of some of the related work of other researchers. Chapter 3 deals with the Finite Elements Analysis which takes part in our research. As our model has been designed in a spatial database so we have explained the importance of spatial databases in Chapter 4. For visualization different types of techniques have been discussed and this has been confined in Chapter 5. Chapter 6 specifies our work and pinpoints our domain model, etc. Chapter 7 contains testing results of our model by using sample of spatial queries. At the end of report, Chapter 8 high-lights achievements,future work and ideas about further enhancements regarding this application.
2 Related Work and Theories
Lord Tim and Russold Martin have discussed ideas about mesh modeling and interpolation technique. Using of FEM was discussed comprehensively in their project. They discussed about different types of finite elements meshes (struc-tured and unstruc(struc-tured mesh) with their properties, such kinds of meshes we have also implemented in our model. They defined structured mesh as it has regular topology and regular or irregular geometry but geometrical elements should have regular shapes while unstructured mesh can have irregular topology and geometry but their geometrical elements can have irregular shapes. Standard user interface requirements have been explained in a good manner, which are also close to our application interface and some are left for future in our application. They have established a very comprehensive data model, our data model is also very close to their domain model. For example, in their domain model they have explained that their geometrical model was stored in Amos 2 and they used well organized order of labels like we used for our geometrical objects [1].
Junkin research was much informative in terms of creating contour surfaces by using of a triangulation. He discussed a technique to divide base triangles into sub triangles and hierarchy of triangles is also maintained, by using of similar triangulation technique we have established iso-surfaces in our application. Their mesh was made by base triangles then base triangles are divided into nested sub triangles by using of their labels and common edges [2], we follow same way but here is some difference between our technique that we used computational formulas for finiding and drawing of iso level points, then reconstructed triangles with division of iso levels. We have not used any concept of common edged, each of base triangle is taken individually.
Ramanujam have discussed good ideas about generation of contour surfaces on base of some scalar value (such as temperature like we used in our model). His geometrical model was based on polyhedral elements but intersection of polygons created contour surfaces or cutting plane. Contour surfaces or cutting planes were used to divide whole model into different zones. Contour surfaces were associated with specified ranges of temperature and cutting planes were used to subdivide surfaces by intersections of planes [3]. His work of plane cutting was some how related with our work but he divided whole body into zones on the base of planes but we have divided each edge of the base triangle into different iso levels and palnes cutting is implemented on edges of the base triangles.
Bel at el has discussed iso-surfaces and contour generation in detail. Descrip-tion of his domain model was very easy to understand and helpful in ordering of vertices for mesh. Their ordering can be helpful in contour generation and also in designing of geometrical models. They attached scalar value with vertices of mesh then generated iso-surfaces (contour surfaces) on the base of that scalar value. The main idea behind the generation of iso-surfaces was relying on the use of a discretized volume [4] for representing the basic geometry, we used similar idea but our iso-surfaces were based on discretized elements (triangle) surfaces of tetrahedron meshes.
Shiaofen Feng and Pooja Gupta were discussed new ideas for surface extrac-tion methods from volume data-sets by applying iso-surface technique of zero-crossing edges in volumetric domain. First volume data set was filtered then marching cube process helped to extract the entire zero crossing surface that could be viewed on various intensity ranges and gradient scales. Their mecha-nism for extraction of iso-surfaces is better than traditional techniques used for iso-surfaces retrieval [5], in case of iso-surfaces extraction their work was close to our work but they used marching cube algorithm for extraction of volumetric iso-surfaces while we used trianglution for construction of iso-surfaces on the face of each base triangle.
For contour generation, Michael J Zayada used 3D Grid algorithm, which was basically designed for 2D sub Grids (slices). Main focus of this algorithm was to generate 2D contour lines on 3D Grids. In his algorithm only outer surface have been used for contour lines generation, without any usage of volume rendering. His algorithm was close to our computational formula but major difference is that he used 2D iso lines while we have been designed 3D iso-surfaces, which covers whole 3D mesh not only outer surfaces. The author used tree structures to organize nodes of different levels and used easy way to traverse nodes. First he divided 3D grid into 2D slices then contour lines generated on these slices. After successful generation of contour lines, slices were fixed again in 3D grid. A com-prehensive way has been used for calculation of nodes positions and connections of same level nodes, like we used for connection of iso-levels points in our iterpo-lation technique for sub triangles vertices. Different ways of contour generation, connections and drawings have been discussed in details in his research report. In 2D contour generation his algorithm can work as a milestone. The most advanced benefits of his algorithm is that he used components (slices) based technique so it is easier to mange and efficient to add different functionalities [6].
J. Ramsden and T. D. Charters have discussed triangular elements data structure (mesh) [23]. Their idea was basically used on rectangular grid and they divided their grid into triangles. They mapped scalar value on vertices of triangles by us-ing of interpolation they found and connected the points of same iso-level to draw contour lines. Searching of vertices was implemented by using of homogeneous coordinate system and each triangle had a direct link with at least 3 neighboring triangles and associated points, like nearest neigbour algorithm used in spatial data modeling, this algorithm is more explained in section 4.4 of this report. Their work have relationship with our work only because they made body by using of triangles like we design our base triagles mesh but our contour generation tech-nique is different because we consider every triangle element separately, their is no any use of neigbour triangles or combine edges in our model.
3 Finite Element Analysis
3.1 Introduction
FEA (finite element analysis) is a famous computer simulation technique widely used in engineering applications. FEA is based on FEM (finite element methods). Finite Element Analysis was invented by researchers of applied Mathematics, Physics and Engineering. Firstly Richard Courant developed FEA in mathemat-ics for numerical analysis to obtain approximate solutions for vibration system. In case of Engineering application FEA was developed for matrix analysis and later it was emerged with aerospace research [8]. Basically it was developed only for structured analysis but later due to its better performance it also became im-portant in physical analysis. The importance of finite elements analysis increased day by day and was widely used in engineering projects. Now a days it is nothing wrong to say that finite elements methods are used in almost every field of en-gineering. By the invention of digital computers it has become easier to use and also powerful for finite elements analysis in scientific computing. Finite element analysis is based on mathematical models effectiveness and comprehensiveness.
3.2 Finite Element Analysis Process
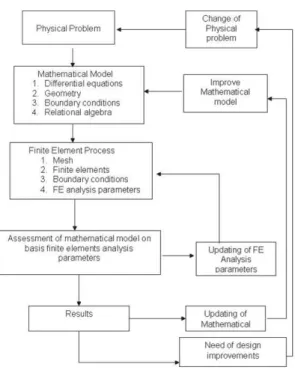
Fig. 1. Basic Architecture of Finite Element Analysis
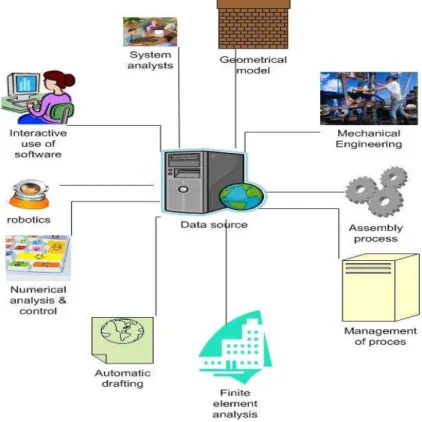
Finite Elements Analysis Importance in Computer Aided design In the early days of computing science, Finite Element Analysis was only used for
structured analysis mainly in the field of aerospace and civil engineering indus-tries. With the passage of time FE analysis has become an integral part of almost all engineering projects. The current trend in FEA software demands is in increase due to the flexibility in integration between solid modeling and FEA analysis. Engineers need FEA for regular updating during the design process of products. Engineers like to use FEA because it is more robust and collaborative, which also helps in computer-aided design to eliminate problems in the beginning [8].
Fig. 2. Finite Element importance in Computer Aided Design
FEA Models
1. Dynamic Modeling: Mostly FEA is used in dynamic modeling because if there happens any change in finite element formula, then it should effects the whole model.
2. Modeling Assemblies: This is basically a component based model because mostly engineers use FEA on some part of the model rather than implemen-tation on whole model [8].
Finite Element Analysis phases Finite Element Analysis process is typically divided into 4 phases.
1. Specification: This is the phase to define problem specification and domain model (geometrical entities, boundary conditions, etc).
2. Discretization: This phase decomposes the mesh into finite elements and nodes.
3. Analysis: Analysis can be done by using mesh data and boundary conditions to build equation system.
4. Evaluation: Results are evaluated in this phase by using standards tests. If once evaluation results do not come accurately then all phases are repeated until getting the expected results. This works in an iterative fashion where the complex analysis can be solved in more and more accurate way. Each FEA pro-cess iteration can refine the whole mesh. An optimization criterion is used to stop these iterations. FEA complexity of calculation is increased by using of multiple levels of equations and large numbers of unknowns in equations.
On the basis of problem definition, corresponding FEM is recommended to apply. Multiple categories of FEA formulations are available and classified on the base of boundary value problems, initial-value problems, and specific kinds of partial differential equations. Several Finite Element Methods are available for static linear elasticity or heat conduction problems [9].
FE Analysis importance FEA Important features:
1. Finite Element Methods are mostly reliable and robust in functionality. 2. Finite Element Methods should not be sensitive to material data and
bound-ary conditions.
3. Results of FE accuracy are directly linked with mesh topology; if mesh topology is fine the FE methods must give accurate results.
4. Finite Elements Analysis technique is a key to have better check on error estimation.
Mostly FE analysis is used in designs of some parts in complex engineering ap-plications to enhance their accuracy. Most of the engineers do not use all of its processes; rather they just use it in a customized way. In future finite elements, analysis techniques can be fruitful to use in other engineering fields. It can be more important in the future if more automatic ways be used for error estimation and FE analysis parameters will be automatically upgraded [7].
4 Database Techniques
All types of software have databases as their integral part. Basically databases were designed to store related types of data in an organized way. When the size of data gradually increases it becomes more complex and difficult to handle ACIDity (Atomicity, Consistency, Isolation and durability) in databases. Database struc-ture is designed and manipulated by Database Management System, which pro-vides logical and physical data independence. DBMS can work as a controller between user queries and physical databases, it provides opportunity to commu-nicate, update and modify database schema.
4.1 Different types of database models
Hierarchical data Model In this model data is stored in a hierarchal tree structure on the base of related record types. Records have embeded set of op-erators to traverse the tree for accessing or updating of data. IMS was the most famous DBMS based on the hierarchical model.
Network database Model As known from its name, data is arranged in the form of a network. Using set operators, which contain information about con-nected nodes and their relationships, made the network model. The main feature of this data model was that, it could support one to many relationships. Data Ma-nipulation can be done by using of embedded set operators.
Relational database Model This technique is based on a relation (table), which contains data and relationships with other tables. Instances are represented by tuples of the tables. In domain modeling it gives more control on data by the implementation of several constraints. For data manipulation it uses high-level language, which gives more security on physical data model. It helps to use rela-tional calculus and relarela-tional algebra based on mathematical theories to provide multiple ways for structured queries. The most famous RDBMS is Oracle.
Object Oriented Database Model This technique was designed on the ba-sis of objects oriented programming and used object stores. Its basic architecture is like other high level languages that everything is based on objects (entities). It supports object-oriented properties of abstraction, methods, encapsulation, op-erator overloading, inheritance, and configuration management. This modeling technique uses objects ID, composite objects and methods to store objects and their properties. The structure and behavior of objects are defined by classes and objects.polymorphism is an imporatant property of object-oriented modeling.
Object Relational Database Model This technique is almost the same as the OO database model. Its architecture is based on Methods (functions) and Types (classes). The idea behind the object relational data models is that object stores are used to design and manipulate databases, which also support query lan-guages. Advanced feature of object relational data models is that they can support high level SQL queries, user defined data types, and user defined functions. Ob-ject relational database support embedded queries to access stored procedures (functions). Indexing can also be implemented on stored procedures and data . It provides strong views for abstraction of entire data and data independence can also be possible. Generalization, Classification and specialization are the main attributes of objected oriented database modeling(normally used in Extended ER diagram).
4.2 Spatial Database Systems
A spatial database is that which supports spatial data types, spatial indexing and efficient algorithms to work on spatial data. Their basic characteristic is to man-age large collections of relative geometric objects.
Modeling in spatial databases Abstraction of model is required for model-ing of spatial databases, discrete geometric objects and algebra used to maintain relationships between geometrical objects. Some special techniques of DBMS are used to integrate geometrical objects into data model. Two types of views are mostly used for the abstraction of spatial models:
1. Geometrical objects position in space. 2. Space relationship with geometrical objects.
Spatial modeling is based on designing of a single object and their relationships. The best spatial model is that which can avoid intersection of points in geometric computational operations. For geometrical modeling, objects and operations are firstly needed to be defined and then numerical analysis (like FEA, etc) are used.
Spatial Relationships: Spatial relationships are mostly designed on the base of following criteria.
1. Topological: inside, intersects, adjacent. 2. Directional: above, below, north, south, etc. 3. Metrical: To compute distance between objects.
There are many ways to implement these relationships between objects but mostly it is recommended to divide space into regions and implements relationships on the geometrical objects in their specific region. Some special operations are needed in spatial DBMS to manipulate spatial databases. It is very important to take care of the requirement analysis so that it can be more collaborative and great care must be needed to design the mathematical model.As mathematical model can give consistent results by using of numerical analysis.
Pros and Cons of spatial data modelling Limitations
1. Handling of complex polygon structures is very difficult in spatial data mod-eling, while mixed polygons can be modelled together.
2. Operations on geometrical objects (like intersection, multiplication, subtrac-tion etc) can be implemented only by using relasubtrac-tional algebra computasubtrac-tions. 3. Critical numerical operations are mostly difficult to use in spatially
opera-tions. Benefits
1. It is very easy to understand spatial model by using of simple geometrical objects.
2. Comprehensive documentation of requirements helps a lot in spatial data modeling.
3. They are mostly used to represent the scientific data (scalars, vectors) which cannot be represented normally.
4. Spatial algorithm gives very easy ways to do operations on spatial model [10].
4.3 AMOS 2
Amos 2 is an object relational main memory database. The object relational database was used for the first time in Iris research institute to develop a re-search database. Amos 2 can work as an intelligent mediator between users and data sources. Basically Amos 2 is based on the object-oriented technique for data
abstraction (data models) but on the other hand it can support declarative queries. It provides a more flexible model for implementation of databases and query-ing. Amos 2 users can customize their models by creating their own data types and functions; they can also use customized queries. It works like a middleware between multiple databases that can communicate with each other and multiple languages can be used for querying.
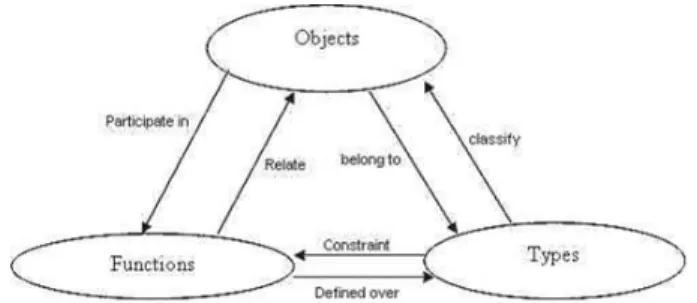
Fig. 3. Basic elements and their relationships in Amos 2 data model
Amos 2 and Iris system have the same data model. Instead of using tables and tuples they use types, functions and objects for data modeling. Amos 2 data model uses extended ER diagram, which can normally supports Object Oriented attributes like specialization and generalization. While in schema designing it can use classification and inheritance of the objects.
Amos 2 as a Mediator As discussed before, Amos 2 can work as middle-ware by using the mediator approach. As a mediator Amos 2 can works in four ways, as an integrator, as monitor, as domain model, and as a locator to find other databases. As an integrator it can combine heterogeneous data models for higher level applications. As a monitor Amos 2 mediator works like a controller; which have regular integrity checks of data sources and provide consistency of data. The idea behind the use of the domain model was that it could provide sup-port for better designing of schema and to provide easy control on transactions. Locators organize the data sources for transparent communications and for the manipulation of records (which data belongs to which data source) [11].
Amos 2 java InterfaceAmos 2 has several interfaces to coordinate with other languages like C, LISP or Java. In contrast, java interface is more convenient than C and Lisp interfaces. It is safer to use java interface because errors in java do not affect Amos 2 database. In the case of best memory usage, java interface is better because memory is automatically reallocated by using of garbage collector. Java is a high-level language that contains rich libraries, packages for window and web applications Amos 2 can take benefits of these java packages. Due to usage of high-level language java interface is not so fast but still for Amos 2 java interface is the best than other interfaces.
Using Callin Interface Amos 2 methods can be called in java programs by using callin interface, which can support both ways of queries (embedded queries and fast path interface). Tight connection is established between java and Amos 2 by shared libaraies and a special driver used to maintain this connection and data transferred in jar files. Tuple is a basic data type of Amos 2 for callin interface and the Scan method is used to extract data from Amos 2 datasets. Tuples has many attributes to organize or update objects during communication.
Using Callout Interface Amos II uses foreign functions to import java meth-ods. Simple and multidirectional foreign functions are used in callout interfaces. These are mostly user defined functions and classes with the same name in java and Amos can call these functions by using same names of foreign functions. AmosQL queries can be used for functions definition and implementation. Cost estimation of functions can also be possible. Foreign functions are mainly used by two parameters, callContext (to maintain communication) and tpl used for transferring of datasets (results). The bag valued functions are used for getting streams of data. For better optimization, multidirectional function capabilities are used. Foreign functions can also handle exceptions(like no more data exception and Amos Exception) [12].
4.4 Spatial Query processing in databases
The most popular spatial queries are range search queries, nearest neighbours queries, closest pairs and distance joins queries in spatially connected geometrical objects. Conventional spatial query languages cannot work properly for mobile applications, so extended queries language is needed to fulfil these requirements. The main spatial constraints are implemented on nodes and their connections in space. In most of the cases nodes are static but their connections are dynamically manipulated on the base of queries.
Famous algorithms for querying in spatial databasesR-Tree is the most popular indexing criteria in spatial databases based on B-Tree indexing but it can also work on multi dimensions for range search spatial queries. Nearest neighbour algorithm is used to find the nodes, which are closer to queried node. Intersect-ing joins can retrieve all the objects, which belongs to their data sets intersection. Closest pair queries retrieve the pairs of objects, which have mimimum distance between each other, almost same like nearest neighbour algorithm but with addi-tion of spatial joins (in pairs) [13].
Spatial Operations Spatial queries almost work like relational algebra queries but implemented on geometrical objects with some geometrical constraints. Spa-tial queries are needed for selection of geometry objects in space and to retrieve groups of objects by using spatial join algorithms. Spatial queries can use alge-braic data sets operations (overlay of graphical objects, combinations of graphical objects, etc) but it is not easy to handle these operations. DBMS has difficulty to differentiate spatial algebra from relational algebra. Spatial queries operations normally work under some specific circumstances (like needs spatial data types, overlay functions to combine regions, graphical display for queries results, math-ematical functions of geometric algebra). Most of the graphical queries may have
three parts, firstly describe all objects, Secondly divide set of objects into subsets, thirdly each subsets objects renders their graphical results and latterly combine their results into a graphical scene [10].
AmosQL query language This is an object relational query language used to update or manipulate Amos 2 (Object relational database). This is designed to support the function of simple relational algebraic SQL queries by using geomet-rical objects.
Syntax of AmosQL queries is based on BNF (context free grammar) notations. AmosQL is basically case sensitive (mostly written in lowercase) other than Amos 2 identifiers (which are mostly capitalized). AmosQL uses two kinds of variables, local variables are mostly used to identify data types and interface vari-ables mostly used to hold their sessions results. Expressions (single valued or multiple valued) can be used in AmosQL queries; to retrieve sets of objects used bags (unsorted and can be duplicate) or vectors (sequence of objects).
AmosQL general statements are used for designing database scheme and manip-ulation like create types, create functions, update queries, etc. Objects oriented properties (generalization and specialization) can be implemented by using in-heritance in Amos 2 types (using under keyword for inin-heritance).
Example of inheritance query in AmosQL.
create type point under triangles;
Key is a specific word used for implementation of candidate key constraint. If the attribute is specified as unique then all instances of this attribute must be unique. Multiple inheritances of objects can be implemented by using more than one super type (parent types). AmosQL functions are normally used to define the attributes of data types [14].
5 Visualization Techniques
Many tools and technologies are used to implement visualization operations. Most famous are OpenGL and Java3D API. Basically these are designed to es-tablish graphical (geometrical objects) applications.
Common Attributes of Standard APIs
Primitive functions These are used to define geometrical objects, which can be utilized for visualization (like points, lines, etc). They are basic identities of any geometrical model.
Attribute functions Behavior of objects can be defined by using these func-tions. In primitive functions, objects are defined but their functionalities are im-plemented in the attribute functions.
Viewing functionsAs discussed before, geometrical objects are defined in prim-itive functions, their functionalities are implemented by attribute functions, but graphical views (orientations and positions) are necessary to display geometrical objects. Viewing functions are designed to specify various types of views.
Transformation functions These functions help for transformation operations (rotation, scaling) by giving stability to objects in space.
Input functionsThe idea behind using these functions is to handle input devices and provide more control on their different input modes.
Control functions In real time work many users can interact simultaneously with the domain model (h/w devices). For better control these functions are im-plemented, to check and balance the entire system.
Inquiry functions These functions support in the operation of different devices. Every device has specific parameters and limits so these functions record devices and regularly updates their information in advance [15].
5.1 OpenGL
Introduction Open graphics library is an API, which can works as interface of graphics hardware. It helps programmers to use its implicit functions and pro-cedures for interaction with graphical hardware. Normally it is difficult to coor-dinate directly with geometrical objects but Open GL interface provides a user friendly environment for programmers.
Open GL Architecture Open GL functionality is totally based on the H/W frame buffer that helps to respond against calling of geometrical objects (points, lines, polygons, etc). In programmer prospective it works like a low level lan-guage. A programmer needs to establish a framework buffer by calling basic ge-ometrical objects. After the establishment of the framework, programmer is free to use other OpenGL functions (commands) for rendering of geometrical objects. Programmers can implement controls (boundary conditions) over geometrical ob-jects by using OpenGL commands. Open GL contains a set of commands that can be used for operations on graphical objects. CPU needs an interface to separate the graphics hardware commands. Basically OpenGL commands works implic-itly but in modern versions it is tried to be more user friendly by adding of explicit calls. There is nothing wrong to say that Open GL works as a state machine for controlling of drawing operations. If once objects behaviors are set, then objects persist in the same state until changed explicitly [16].
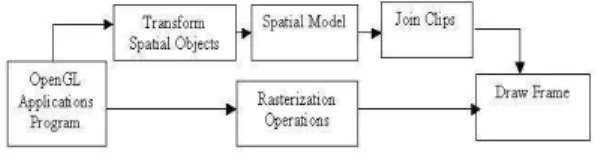
Fig. 4. Open GL pipeline
Open GL supports geometric and raster primitives and the whole flow of Open GL applications works in the pipeline made by these primitives. Geometrical primi-tives are used to design a problem domain and abstractions. The raster primitive are used to visualize these results in pixels on the screen. They work as building blocks of the whole model. Geometric primitives cannot be visualized in space until they pass from raster primitives for visualization [15].
5.2 JAVA 3D API
Java 3D API was basically designed for structure analysis applications but later started to be utilized in scientific visualizations application, online business inter-face developments and many kinds of advanced engineering applications. Due to good responses, currently it is becoming more important in the development of interactive graphical applications (real time application). JAVA 3D is high level API, which can support in most features of graphics applications. Its programing architecture is designed by scene graph modelling. Geometrical objects (nodes) are defined hierarchically but compliers join them during building of scene graph. JAVA 3D API is an extension of java and contains high level constructors. In pro-grammers prospective other than low level API, Java 3D API works fast and easy to write program. For spatial modeling and operation it is good to use java 3D API because it gives high-level support of functionality.
For next generation graphical abstraction, java 3D API gives broad spectrum of views (in different directions, with different frequencies of light, different ranges of colors, different amplitudes and computational functions). To implement con-straints in domain models, it gives very easy way of management and controls. It becomes more portable by implementation of transformation on scene graphs. It can support to display multiple screens with different sizes.
JAVA 3D API Design Goals It is important to use java 3D API in Computer Aided Design. Still one questions that is not answered is ”Why was java 3D API designed? ”. As already low level APIs were available in the market but the reason behind creation of JAVA 3D API was to provide more user friendly environment for programming.
JVM Support Java 3D API is derived from core Java,so it has support from Java that it can use java libraries with additional features of itself. It is more portable by
using java virtual machine (JVM). With little modification it is easy to integrate in the already available java application. Already available graphical tools of java can also be helpful for programmers (like swings, applets) to establish better strcuture of scene graph.
Scalabilty Java 3D API always follows standard of java so it is more scalable than low-level APIs. For Programmer it is comparatively a fast way to build an application on java 3D API due to familiarity of JAVA programming.
Communication with other API s JAVA 3D API can communicate and use features of other low-level API (2D, OpenGL, Direct3D, etc) of java. Java 3D API can also communicate with graphical hardware designed by low level API (Open GL, Direct3D).
Importance in Complex Application Java 3D API was basically designed to build more complex application, which is difficult to handle in low-level APIs. For Scientific application it has rich libraries and can also take advantage of using core java functions. Large and complex applications can be designed very easily in Java 3D API
JAVA 3D API Versus Other APIs Java 3D API provides a user-friendly environment for interaction with geometrical objects by using many input de-vices (mouse, keyboard, etc). This high level interface provides more realistic interaction between objects. Rendering of objects is very simple in java 3D API. Within a short time its drawing frame can be established but in Open GL it is a complicated way to establish frame for graphical display [17].
Scene Graph Programming ModelJAVA 3D applications are based on tree like data structures, called scene graphs. Scene graphs give an easy way of render-ing and representrender-ing geometrical objects. A scene graph works like a container (which has all the information about virtual objects their attributes and relation-ships). Nodes are the basic building blocks of scene graph tree (DAG) [18].
It follows hierarchical tree structure. There must be one virtual universe object, which can contain many scene graphs and establish a visualization platform for other objects. Branch group nodes are used in scene graphs to isolate different kinds of objects on the bases of their scene graphs. Leaf nodes were designed to implement the spatial functionalities of shapes (geometry and appearance) and behaviour (rotation, scaling) in geometrical domains [19].
Fig. 5. Scene Graph java 3D API
Java 3D API provides 4 different kinds of rendering objects in scene graph. It is used to establish connection between all geometrical objects. Leaf nodes must be inherited from branchgroup nodes and branchgroup nodes must have connection with virtual universe object. In real times applications it is needed to reuse the objects, java 3D API also supports reusability of scene graph by the use of shared group nodes. Geometrical objects can be accessed only during creation of scene graphs. To make objects alive, then they should be explicitly needed to SET or GET before scene graph creation [18].
Using of Java 3D API in iso-surfacess (contours) construction and vi-sualization Java 3D Application Programming Interface contains a number of packages, which can help for virtual universe application development. Scene ob-ject creates instances of branch group class and works as root of the scene graph. To set the graphical visualization frame, several objects are needed to attach with the scene graph, like scaling, rotation, background, and light. There are many vi-sualization policies available to design the views. Simple universe object contains all the necessary attributes to set visualization frame with a small piece of code.
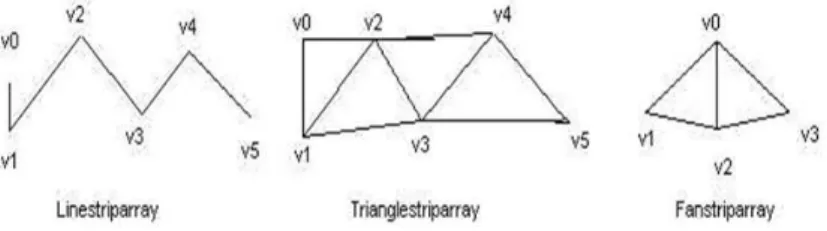
Drawing of scene graph geometrical model Java 3D API provides several dif-ferent kinds of geometry classes (like point array, line array, triangle array, quad array, strip array, etc). For contours display, mostly strip arrays and fan array are used. In most of the geometrical models, point array is used for nodes. Connec-tions of nodes are depend upon their condiConnec-tions and implemented by goemetrical object of java 3D API. These geometrical classes have rich constructors, and a
large geometrical model can be constructed with their help [20]. Geometry Strip Arrays for drawing of contours
Fig. 6. Contour generation data structures (java 3D API)
LineStripArray is mostly used for drawing of polygons boundaries. A line array needs two points to draw a line in space but a line strip can take more than 2 points, normally it starts drawing line from first point and stop drawing at last point. Triangle fan array and triangle strip array are very close in their function-alities; the main difference is just their sequences of reused vertices. As shown in the above figure, Triangle Fan Array always use first points in drawing of all triangles just 2nd and 3rd points are changed.
Due to limitations in strip arrays we used simple triangle array objects for visu-alization of temperature contours. Triangle class is derived from basic geometry array classes. Our model is based on vertices positions and temperature values. Points are passed as arguments to a triangle array constructor. Triangles are drawn by taking of points with their positions in space. A triangulation technique is used for drawing of connected triangles, nested sub triangles and also used to generate dynamic contour strips [22].
6 Domain Model
6.1 Mesh Techniques
A mesh is always constructed by using of finite set of elements. Different types of elements are used in different types of meshes, for example triangles, quadran-gles, etc are used commonly in 2D meshes. In case of 3D meshes tetrahedrons, cubes elements can be used. In mesh each element has specific set of nodes and edges in order to form specific shape of that element. In finite elements methods commonly problem area is splitted into finite elements.Mesh is always estab-lished by nodes in space and commomnly nades have extra attributes like some scalar or vector values. Before going in details of our mesh model first we would like to introduce types of meshes. There are two main kinds of meshes used in Finite Elements Modeling.
Structured Mesh By using basic parameters for meshes, structured mesh must have regular connections between nodes but it can have regular or irregular ge-ometry. Regular topology elements of structured mesh always maintain specific shapes. Mostly it is recommended to use structured mesh because it is more ef-ficient in utilization of memory and easy in implementation rather than unstruc-tured mesh.
Unstructured Mesh Unstructured mesh has properties almost opposite to structured mesh. Elements of unstructured mesh usually do not have uniform shapes because it has no regular geometry and nodes are connected irregularly and just depend on formula for connections. For customized models unstructured mesh is better and more efficient in rendering of objects [1].
6.2 Mesh Model in Amos 2
Our basic mesh model is organized and designed intellectually so that spatial operations can be implemented on the whole mesh. Mesh should have flexibil-ity to support division and connections of finite elements. In our application we have utilized both techniques of mesh modeling, like structured mesh modeling for designing of nodes positions in space and unstructured mesh modeling for tetrahedron mesh. To implement constraint of , different kinds of boundary con-ditions are used on finite elements mesh [22]. In our data model, geometrical objects with their positions and temperature values are designed and stored in Amos 2 database. In case of any disaster our database model has backup, because we kept original database separetly and by using of Amos 2 stored procedures its easy to reload original database. Amos 2 is based on object oriented programming technique so it was more compatible for us to work with other Object oriented languages like java classes.
Schema (commands) for designing of Geometrical Mesh model In Amos 2 database schema is normally designed by using of following three object oriented attributes of AmosQL.
2. Functions 3. Objects
In database schema we have considered types as classes of object oriented lan-guages. Type means any thing, which have existence in universe like an entity in relational database.
Designing of Basic Mesh Model As our work is based on geometrical objects like points, triangles and tetraherdons, so we have created three main types of them to create their objects for establishment of basic mesh model.
1. Points (Vertices) 2. Triangles 3. Tetrahedrons
To set position of vertices in 3D space and assigning of temperature values in geometrical objects we used following functions.
1. Position () 2. Temperature ()
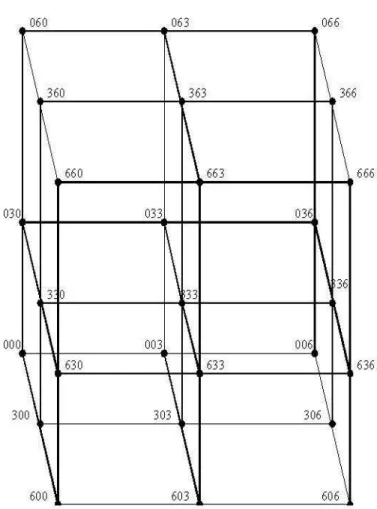
Construction of Basic Mesh Model In our basic Mesh model, nodes (points) are considered as basic building blocks of geometrical model. We have construc-tred our basic mesh by creation of unique nodes (points) and setting of their po-sitions in 3D space. For generation of nodes (points), we have created type point by using of below command.
create type point properties(Id Integer);
In our data model each node (point) must have two attributes ( coordinate posi-tions and temperature value). We have added these attributes to each point by the using of following Amos 2 functions.
Create function position (point p)->
<real x,real y,real z>as stored; Create function temperature (point p)->
<real> as stored;
On requirement of geometrical model first we have declared and initialized point objects, which are necessary for our mesh model. For example following Amos 2 commands were used for creation of point instances, setting of their coordinate positions in 3D space and assigning of temperature values to these nodes (points).
create point(Id,position,temperature)
instances :p000(0,<0.0,0.0,0.0>,0.0); create point(Id,position,temperature)
Fig. 7. Basic Mesh Model
After establishment of nodes (points) mesh, our next step was to establish tri-angles and tetrahedron meshes. Each triangle object was considered as a unique object and it always require at least three Nodes (points) as arguments. Triangle objects were created by these kinds of AmosQL commands.
create type Triangle properties(Id Integer);
create function triangle(Triangle t) ->
<point,point,point> as stored;
create Triangle(Id, triangle)
As each tetrahedron must needed at least 4 triangles for construction of tetrahe-dron element so first it was required to have triangles objects. Tetrahedral ele-ments are created by using of these available triangle objects and this was done by these kinds of AmosQL commands.
create type Tetra properties(Id Integer);
create function tetra(Tetra t) ->
<Triangle t1,Triangle t2,Triangle t3,Triangle t4> as stored; create tetra(Id, Tetra)
instances :r0(0, <:t0,:t1,:t2,:t3>);
6.3 Finite Elements Mesh
Tetrahedron Mesh It is well known that nodes (points) are always basic units in almost all kinds of geometrical models. Our basic mesh model is also designed by setting of nodes (points) positions and their relationships in 3D space. After creation of all points instances we have passed these points as argumnets to tri-angle objects. Our main goal was to construct tetrahedron mesh and construction of terahedron elements need triangles, so our model designend in a sequential way. First we start from construction of structured mesh nodes (points) by or-ganization of points in 3D space then construction of triangles mesh is done by utilization of available points and at the end we construct tetrahedron mesh by using of available triangle objects. This whole work became clear by looking on our tetrahedron mesh and we used below code for construction of Tetrahedron Mesh.
create function points(point p1)-> Vector v as select v from real r1, real r2, real r3, real r4 where <r1,r2,r3> =position(p1) and r4 =temperature(p1) and v={r1,r2,r3,r4};
create function tripoints(Triangle t) -> vector ve as for each point p1, point p2, point p3
where <p1,p2,p3> = triangle(t) begin
set ve = {points(p1), points(p2), points(p3)}; result ve;
end;
create function tetrapoints(tetra t) -> vector ve as for each triangle t1,triangle t2,triangle t3,triangle t4 where <t1,t2,t3,t4> = tetra(t) begin set ve={tripoints(t1),tripoints(t2), tripoints(t3),tripoints(t4)}; result ve; end;
Foreign functions are used in Amos2 java interface for sending of Amos2 tuples to JAVA 3D API primitive functions. In interface of our application we have used primitive function of java 3D API, for example drawT for drawing of triangles and drawTR for drawing of Tetrahedron Meshes. These AmosQL commands are used for establishment and connection of foreign functions with primitve inter-face function.
create function displayTriangles(Vector v)->object as foreign "JAVA:Viewer/drawT";
create function displayTetra(Vector v key )->object as foreign "JAVA:Viewer/drawTR";
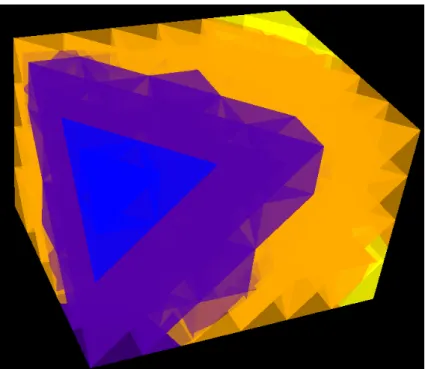
Fig. 8. Transparent Tetrahedron Mesh
After establishement of tetrahedron mesh, we have taken triangles one by one from Tetrahedral mesh and used them for our computational work. Iso level points were generated on each edge of the each base triangle by using of its corner points temperature values and computational formulas. Delauny triangulation is used for drawing of nested triangles inside of each base triangle to construct iso-surface. There is no any restriction for defining of temperature values in our mesh but it is
purely depend upon temperature formula. In our application we have used follow-ing spherical formula for smoothly distribution of temperature in our tetrahedron mesh.
T(x,y,z) = T(xˆ2 + yˆ2 + zˆ2) - 10
6.4 Finite Element Procedure
Tetrahedron mesh was used for temperature contours generation. For computa-tional work our technique was based on division of higher surface (tetrahedrons) to lower order surfaces (triangles). First we took one tetrahedron element then each triangle of that tetrahedron element was considered as a basic unit for com-putation of temperature and contours development, because triangle is a basic geometry element of finite element modeling. All functions and constraints were implemented on each triangle element of all tetrahedron elements. After creation of iso-surfaces on each triangle face we fix these triangles back into tetrahedron mesh, which is more clearly shown later in data model (iso-surfaces generator). We have tried to use finite element procedure which would have to be more flex-ible and can be implemented smoothly on whole mesh.
Boundary conditions As each triangle of tetrahedron elements was consid-ered as a basic unit of our model, so boundary conditions were implemented on each triangle element. Each triangle used its local coordinates and edges made by using of their corner points. Great care has been taken that base triangles should not be overlapped each other. For drawing of sub triangles, connection of vertices should always start from the minimum temperature corner point toward the max-imum temperature corner point of the base triangle. Dynamically generated iso level points must have positions on the edges of the base triangles neither inside of triangle nor outside of triangle boundary.
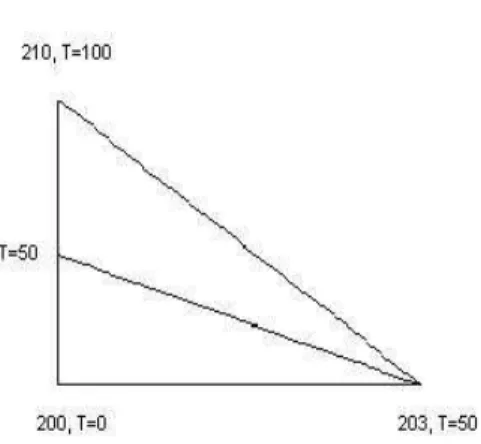
Finding of iso levels on each edge of the triangleBefore going into details about iso level, first we would like to define iso levels. In this application iso lev-els are created during visualization of iso-surfaces and mainly used to divide each edge of the base triangle into temperature regions by using of user queries and temperature scale of tetrahedron mesh. For finding of different iso level points, each edge of the base triangle is taken individually, ordered their vertices sequen-tially on the base of their temperature values (min-mid, mid-max, max-min). Af-ter finding of iso level points on edges, each base triangle was reconstructed by using of updated edges. We used distance function to find the exact positions and temperature values of the dynamically generated iso level points on each edge of the base triangles, These formulas were discussed later in this section.
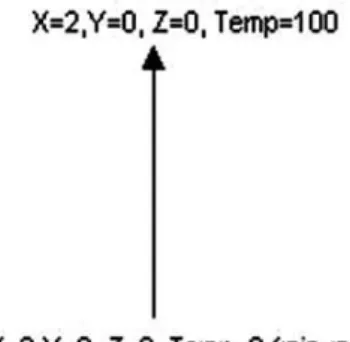
For example: First we took one edge of the base triangle, which had following values (temperature and coordinates).
Fig. 9. One edge of a triangle
If T(min)=0 // Mininmum temperature of the mesh T(max)=100 // Maximum temperature of the mesh difference = T(max)-T(min)/n(total no of isolevels) So by using of above values if (Number of isolevels)n = 4 Then each edge of this triangle divided in to 5 regions.
Fig. 10. Division of triangle edge into different iso levels of temperature
This procedure was repeated with all edges of the each base triangle and after this process each base triangle was divided into different no of iso levels. Iso level points were calculated and generated by using of below formula.
Calculation and generation of iso level points After finding of different no of iso levels, we were needed to calculate exact position for iso level points. For this purpose, we used specific distance formula and temperature parameters to generate dynamic isolevel points on each edge of the base triangle on the base
of temperature values. We have implemented this functionality by using of the following formula and formula is designed for our basic finite elements (triangles of tetrahedron mesh). Finding of new iso level point coordinates was done by us-ing of temperature value and addus-ing of 4value in X, Y and Z coordinate. X1+4X, Y1+4Y, Z1 +4Z
Dynamic points are generated in 3D space so all coordinates value are changed after calculation.
T1(x1,y1,z1) = Minimum temperature and positions of edge corner point T2(x2,y2,z2) = Maximum temperature and positions of edge corner point Tc(4x,4y,4z) = Temperature value and coordinates of iso level point
4X= (x2-x1)(Tc-T1)/T2-T1 X coordinate of iso level point. 4Y= (Y2-Y1)(Tc-T1)/T2-T1 Y coordinate of iso level point. 4Z= (Z2-Z1)(Tc-T1)/T2-T1 Z coordinate of iso level point.
Above process is shown for calculation of one iso level point but this formula was used for calculation of all iso level points in the whole points. After generation of first iso level point T(min) was changed to T(min)+ diff (difference between first two iso levels) and used as T(min) in calculation of second iso level point, this updation in T(min) was repeated for generation of all remaining iso level points.
6.5 Contours Generation process
Interpolation(Connection of points and drawing of Triangulated sur-faces)After finding of the all iso level points by using of above distance formula, we used delaunay triangulation to divide face of each face of the triangle into iso-surfaces. As discussed in boundary conditions that triangulation was performed in local coordinates of the each base triangle of tetrahedron mesh.Delaunay trian-gulation has property that it needs to have locations of both iso level points and boundary (corner) points of each triangle.In case of drawing of triangles first we have sorted points (vertices) based on their temperature values. For connection of points we took first three consective points from the sorted vertices and we have created sub triangles with connection of these vertices by usage of vertices interpolation and delauny triangulation [20]. This interpolation technique will be repeated with each base triangle until construction of whole tetrahedron mesh .
Contour colors pattern generation on the base of iso levels For vi-sualization of results, we have used different continues colors spectrum for the temperature contour surfaces in our 3D mesh. One dimensional colors pattern was used and color combinations are specified on the base of iso levels temper-atures(minimum to maximum temperature values). We have done interpolation between 3 colours (blue, red, yellow), which were used to display different iso levels of temperature. The continues colors interpolation is implemented, for ex-ample if a temperature value of the body increases then color should be changed gradually. In our colors spectrum, minimum temperature contours have blue color then by gradually increasing of temperature red and yellow color contours were displayed [20].
In java3D API colours values will be varies between 0.0.0 to 1.1.1. As for con-tour generation we have sorted vertices (minimum to maximum values of tem-perature). For colours interpolation we used same way as used in generated of iso level points but we have divided vertices into two halves(min-mid and mid-max colour values). In first half we have interpolated blue and red colors by using of below formula.
ctt= difference of Temperature value for iso-surfaces.
cdiff1(lower bound of colours spectrum)= 0 and cdiff2(upper bound of colours spectrum)= 100.
c11,c12,c13,c21,c22,23 are basic colour values used for interpolation. ct1,ct2,ct3 are calculated colour values of vertices.
c11=0.0;c12=0.0;c13=1.0;c21=1.0;c22=0.0;c23=0.0; ct1=c11+((c21-c11)*(ctt-cdif1)/(cdif2-cdif1)); ct2=c12+((c22-c12)*(ctt-cdif1)/(cdif2-cdif1)); ct3=c13+((c23-c13)*(ctt-cdif1)/(cdif2-cdif1));
In second half from Middle to Maximum color valued vertices we have done interpolatation between red and yellow colors by using of below formula.
c11=1.0;c12=0.0;c13=0.0;c21=1.0;c22=1.0;c23=0.0; ct1=c11+((c21-c11)*(ctt-cdif1)/(cdif2-cdif1)); ct2=c12+((c22-c12)*(ctt-cdif1)/(cdif2-cdif1)); ct3=c13+((c23-c13)*(ctt-cdif1)/(cdif2-cdif1));
Contour Generation Steps Case 1: N=No of isolevels
Min=Minimum Temperature value of Mesh Max=Maximum Temperature Value of Mesh
Diff=Differences of temperature between isolevels (Max-Min/N) If N=1, Max = 100, Min= 0
Fig. 11. Triangle Element without subdivision into iso-levels
Case 2:
If N=2,Max=100,Min=0 Diff=100-0/2=50
Fig. 12. Triangle Element with subdivision into two iso-levels
Case 3:
If N=3,Max=100,Min=0 Diff=100-0/3=33.3
Fig. 13. Triangle Element with subdivision into three iso-levels
Fig. 15. Tetrahedral element with 3D triangulated contours
6.6 Data Model
7 Spatial Queries and their results
7.1 Sample queries
Query to display whole tetrahedron mesh:
JavaAMOS 1> display (select t from tetra t);
Queries based on temperature
ranges:-display body which has temperature Greater than 40:
JavaAMOS 2> display (select t from tetra t
where temperature(t) > 40.0);
display body which has temperature less than 40:
JavaAMOS 3>display (select t from tetra t
where temperature(t)< 40.0);
display body which has temperature Greater than 60:
JavaAMOS 4>display (select t from tetra t
where temperature(t) > 60.0);
Queries based on coordinate
positions:-display body whose all x coordinates are Greater than 0.3:
JavaAMOS 5> display (select distinct t from tetra t where x(t) > 0.3);
display body whose all Y coordinates are Greater than 0.0:
JavaAMOS 6> display (select distinct t from tetra t where y(t) > 0.0);
display body whose all Z coordinates are Greater than 0.1:
JavaAMOS 7> display (select distinct t from tetra t where z(t) > 0.1);
display body whose all X&Y coordinates are Greater than 0.3:
JavaAMOS 5> display (select distinct t from tetra t where x(t)+y(t) > 0.3);
7.2 Sample models
(a) (b) (c)
Fig. 18. Amos 2 Query result to display sample models for different size of Tetrahedral meshes
(a) (b) (c)
7.3 Cutting on the base of geometrical queries
(a)
(b)
Fig. 20. Amos 2 Queries results on the basis of different geometrical coordinate and temperature values
7.4 Cutting of the planes from 3D Mesh
(a)
(b)