Faculty of Technology and Society Computer Engineering
Bachelor thesis
Real-time vehicle and pedestrian detection, a data-driven
recommendation focusing on safety as a perception to
autonomous vehicles
Detektering av fordon och fotg¨angare, en datadriven rekommendation med fokus p˚a m¨anniskors s¨akerhet runt ett autonomt fordon
Ahmed Abdulkader
Chippen Vlahija
Exam: Bachelor of Science in Engineering Subject Area: Computer Engineering Date of final seminar: 26-05-2020
Supervisor: Reza Malekian Examinator: Johan Holmgren
Acknowledgement
We would like to thank our supervisor Reza Malekian for great feedback and many helpful meetings. We also want to thank our examinator Johan Holmgren for contribution of a great Axis IP camera and Magnus Krampell for great guidelines to start this thesis.
Glossary
ADAS - Advanced Driver-Assistance Systems CPU - Central processing unit
CNN - Convolutional Neural Network DBN - Deep Belief Network
FPS - Frames per second
GPU - Graphics Processing Unit SSD - Single Shot Detector YOLO - You Only Look Once
Abstract
Object detection exist in many countries around the world after recent growing interest for autonomous vehicles in the last decade. This paper focuses on a vision based approach focusing on vehicles and pedestrians detection in real-time as a perception for autonomous vehicles, using convolutional neural network for object detection. A developed YOLOv3-tiny model is trained with the INRIA dataset to detect vehicles and pedestrians, and the model also measures the distance to the detected objects. The machine learning process is leveraged to describe each step of the training process, it also combats overfitting and increases the speed and accuracy. The authors were able to increase the mean average precision; a way to measure accuracy for object detectors; 31.3% to 62.14% based on the result of the training that was done. Whilst maintaining a speed of 18 frames per second.
Contents
1 Introduction 1
1.1 Background . . . 1
1.2 Research aim . . . 1
1.3 Problem descriptions and Research Questions . . . 2
1.4 Limitations . . . 3
2 Theoretical Background 4 2.1 Image processing . . . 4
2.2 Object detection . . . 5
2.2.1 Machine learning . . . 5
2.2.2 Machine learning evaluation . . . 6
2.2.3 Deep learning . . . 6
2.3 Machine Learning process . . . 7
2.4 Convolutional Neural Network (CNN) . . . 7
2.5 YOLO (You Only Look Once) . . . 8
2.6 Single Shot Detector (SSD) . . . 8
2.7 Speed/Accuracy trade-offs . . . 9
2.7.1 GPU (Graphical Process Unit) . . . 10
2.8 Transfer learning . . . 10
3 Related Work 11 3.1 Object detection algorithms . . . 11
3.2 Distance estimation . . . 13
3.3 Training the algorithm . . . 13
4 Method 15 4.1 Construct a conceptual framework. . . 15
4.2 Develop a system architecture. . . 15
4.3 Analyze and design the system. . . 18
4.4 Build the (prototype) system. . . 18
4.5 Observe and evaluate the system. . . 20
5 Results 21 5.1 Testing . . . 21 5.1.1 Daytime . . . 22 5.1.2 Nighttime . . . 22 5.2 Distance . . . 23 5.3 Evaluation . . . 24
6 Discussion and Analysis 27 6.1 Threats to validity . . . 27
6.2 Speed/Accuracy trade-off . . . 27
6.3 Training . . . 27
6.3.1 Dataset . . . 27
6.3.2 Transfer learning . . . 28
6.4 Mean Average Precision (mAP) . . . 28
6.5 Future work . . . 28
7 Conclusion 29
References 31
List of Figures
1 The lines around the dog is a boundary box. . . 5
2 CNN Architecture[1] . . . 7
3 Network structure of SSD model[2] . . . 9
4 Non-maximum suppression . . . 9
5 Speed/Accuracy trade-off . . . 10
6 Unmanned-aerial-vehicle (UAV) imagery-capturing schematic concept . . . 13
7 Nunamaker’s approach on system development research process[3] . . . 15
8 Graphical view of the IoU equation . . . 17
9 System architecture . . . 17
10 System overview showing every step it will take . . . 18
11 Angle-of-view formula[4] . . . 19
12 Graphical view of the calculation . . . 20
13 Example of dataset re-labeling. . . 21
14 Demonstration of how the system can detect multiple cars in daytime. . . . 22
15 Demonstration of how the system can detect a car and multiple persons in nighttime. . . 23
16 Demonstration of how the system can detect distance. . . 23
17 The green vertical lines illustrate the midpoint. . . 24
18 Demonstration of warning notification . . . 24
19 Illustrating mAP during training process . . . 26
20 Illustration of calculation with 2 equipment . . . 29
21 Function tree . . . 36
List of Tables
1 Comparison between YOLO-R and YOLO v2 using INRIA pedestrian dataset . . . 112 Table illustrating the average precision for each class trained with Open Images Dataset v4 . . . 25
3 Table illustrating the average precision for each class trained with INRIA dataset . . . 25
4 Table is showing the relation between speed, mAP and different input layers 25 5 Table illustrating the mean average precision for each trained model with dataset . . . 26
1
Introduction
In this chapter we introduce the background of the thesis, and the focus area. Furthermore the problem descriptions and research questions, research aim and limitations.
1.1 Background
With the growing demand and popularity of autonomous vehicles, sets high requirements for pedestrian safety. The autonomous vehicles must be able to detect pedestrians and other relevant objects such as vehicles and bikes. Pedestrian accidents occur daily in our increasingly intensive traffic environment. Studies have shown that almost every day 3,700 are killed globally in road traffic crashes[5], and more than half of them are pedestrians, cyclists and motorcyclists[6][7]. The World Health Organization analyze the different risk factors causing traffic accidents, and nearly (94-96%) of all car traffic accidents are due to human errors[8]. Accidents occurring because of irresponsible human behavior as speeding and driving under the influence (DUI) of psychoactive substances such as alcohol. Other growing human error is that the driver pays attention to something other than driving such as using mobile phone or getting generally distracted with their thoughts[7][9].
In 2010, Volvo developed a pedestrian detection mechanism with full auto brake[10]. This was ground breaking because, there was no other manufacturer that had a technology that could avoid collisions with a pedestrian. Volvo’s vision was that by 2020 no one should be killed or seriously injured in a new Volvo vehicle. Volvo contributed with results that allowed other companies to further develop in this area, creating its own safer detection system.
Working with machine learning, the model can be seen as an independent machine that can adapt to new data by using previous computations[11]. Since the beginning of deep learning development, many different neural networks (NN) architectures have been pro-posed. This improved the performance of computer vision in object detection and other similar technologies. When working with data, requires the data to be stored in some kind of way, cloud storage is a great way of handling for an instance big data[12].
With distance estimations in a autonomous vehicle that detect objects the vehicle system will be able to warn the user about potential risks. According to the National Highway Traffic Safety Administration (NHTSA) [13] the most commonly accidents in traffic is rear-end collisions, in most cases this occurs because of a distracted driver. [14] [13]
In 2015, James Munis wrote ”Humans work and trade within the currency of information, just as computers do. But, unlike computers, we apprehend the value of that currency.” [15] which means that although artificial systems are now competent enough to handle some human tasks, the system will never know the value of the task it is executing. Now even though the machine learning systems can adapt to what it has previously been com-puted, the system will never know the value of what has been comcom-puted, in this case, the pedestrians and people that drive are highly valuable because lives are at risk.
1.2 Research aim
The research aim of this thesis is to detect vehicles and pedestrians in a real-time environ-ment with fast image processing of 20-25 frames per second (FPS). Due to the fact that
road accidents are causing disabilities and loss of human life, this project is investigating on an approach to detect vehicles and pedestrian and give notification to drivers in terms of distance. There are several algorithms that can be used to achieve this, which is indi-cated in the next chapter. Because of the requirement of real-time detection, one of the primary candidates is the YOLO algorithm, but if another algorithm is better suitable for the project we could consider that instead. The aim is also to increase the accuracy while maintaining the speed in real-time.
In this thesis, the focus will be on human and vehicle safety as it occurs many acci-dent in a traffic environment, therefore we propose an developed computer vision system for real-time vehicle and pedestrian detection which will increase safety in the road.
1.3 Problem descriptions and Research Questions
An object detection algorithm will be built with many neural network layers with different purposes. A developer choose an algorithm and develop it according to the usage purpose. (RQ1)
Vehicle and human detection and distance estimation for safety is the main purpose of this thesis, relevant contributes (RQ1.2-RQ1.4) will be developing a object detection algorithm for increasing human safety. At the same time the object is detected, the distance of the object will also be displayed (RQ1.1). When the distance of the objects around the vehicle is known, a warning (RQ1.4) can be displayed to the driver when the distance to the car in front is short. The distance to the detected object will be displayed next to the class description.
The research questions for this thesis are listed below. The research questions is sorted by priority.
RQ1 What object detection algorithm can effectively contribute in solving real-time de-tection processing in a traffic environment?
When the main question is answered (RQ1), the questions below are formulated and are the additional features for the algorithm:
RQ1.1 How distance between the camera (vehicle) and the detected object can be calcu-lated?
RQ1.2 How can the object detection algorithm be limited to only detect relevant ob-jects in traffic (vehicle, pedestrian)?
RQ1.3 How can the accuracy of the object detection algorithm increase, while main-taining the speed?
RQ1.4 How can the customized algorithm warn the driver if the distance to a car is to small?
1.4 Limitations
Some limitations in this type of area can occur if a low resolution camera is used which may result in bad image quality or if a computer with low (GPU) graphics processing unit is used which may lead to slower object detection process. To train a new dataset requires a effective GPU, in our case we are using AMD RX 580 graphic card. In order to speed up the process a better performing GPU is needed otherwise, the time required to train our dataset will be longer than usual. Also to achieve better FPS (Frame per second), the GPU plays a fundamental role.
When two people stand close to each other it can become difficult for the algorithm to detect it correctly. Most commonly the algorithm generate a bigger bounding box and interpret it as one person. However, there is still a notification of pedestrian detection to the driver by the developed system in such circumstances.
This project provides a perception and recommendation to autonomous cars while the core research contribution is development of the vision-based real-time vehicle and pedes-trian detection system. A Level 2 of automation is used in the test to verify result of the developed algorithm and the system, while level 3 or level 4 requires an autonomous vehicle which was not available for the test.
2
Theoretical Background
This section focuses on the theoretical background in some related areas. Analyzing an image and detecting object requires algorithms and methods, which is described in this section, along with the background theory of image processing.
2.1 Image processing
Image processing is a method that is widely used to detect any type of objects, patterns and perform some operations on the image that is captured and retrieve valuable information. The processing of digital images can be divided into several classes: image enhancement, image restoration, image analysis, and image compression[16]. The main component used to perform image processing is a good resolution camera. In addition, a processing unit or computer with image processing with on-board image processing algorithms. A gigabyte storage to store the pixels of the images during the processing.
• Image enhancement: An image that is manipulated by techniques like (e.g., me-dian filtering[17], linear contrast adjustment[18] can help a human viewer to extract valuable and useful information from it [19].
• Image restoration: A process that restores an image from a degraded version that is often blurred or noisy[20]. An image can be degraded for different reasons, for example an image can be blurred by a camera shake. Image noise is often caused by environmental conditions such as rain, snow, etc. or even by thermal signals. • Image analysis: Images that contain useful information can be used to outline
objects and describe them[21]. Some examples of image analysis are edge extraction, image segmentation and texture and motion analysis[22].
• Image compression: When an image is compressed, the image bytes is minimized without degrading the quality of that image. The advantage of compression is more images can be stored on a disk or memory by compression.
2.2 Object detection
Object detection is a computer vision technique that makes a system able to locate objects in an image or video. This bounded box[23] from the segmentation can help a human or driver to identify and locate the objects in a matter of seconds and quicker than unpro-cessed images. Therefore, the goal of object detection is to implement this intelligence to a computer.
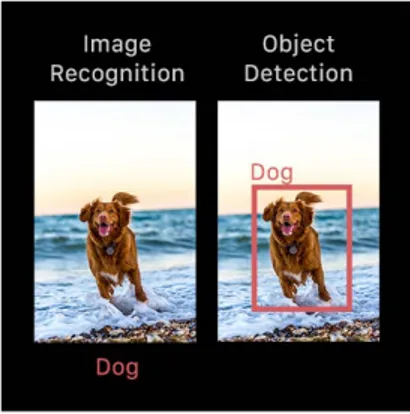
There are different techniques to perform object detection. Popular deep learning–based approaches using convolutional neural networks CNNs, such as YOLO and SSD, which will automatically learn to detect objects within frames. To explain further on object detection, more knowledge on machine learning is presented below. The Figure 1 below shows the difference between image recognition and object detection.
Figure 1: The lines around the dog is a boundary box.
2.2.1 Machine learning
Machine learning is an area within Artificial Intelligence (AI), that focuses on decision making and predictions. The primary aim is to allow the computer to be further devel-oped without any human intervention, it will train based on observations or data[24]. The machine learning algorithms are often categorised as supervised or unsupervised, where supervised applies what has been learned in the past to new data using labeled examples.
Supervised learning - Supervised learning is a machine learning task, where some data is labeled and input is given to the algorithm which then can learn from in order to classify the label. The aim of supervised learning is to approximate the mapping function so, that when given new input dataset, it can predict the right output for that dataset. It is a algorithm learning process that iteratively continuous until it achieves an acceptable level of performance.
The problem that occurs can be further grouped into classification and regression prob-lems.
• Regression: is the problem of predicting a continuous quantity output for an ex-ample.
• Classification: is the problem of predicting a discrete class label output for an example.
Unsupervised learning - Unsupervised learning is a technique of machine learning, where the data provided is not labeled to classify or predict. The algorithm instead de-tects patterns which may not be obvious, or gains insight of processed data. Therefore, unsupervised learning is very useful when handling big data, but it is less accurate and, a trustworthy method compared with supervised learning[25].
The problem that occurs can be further grouped into clustering and association prob-lems.
• Clustering: Clustering is mainly a task of grouping a set of uncategorized data by finding structure or patterns.
• Association: Association is a unsupervised technique that is dealing to find rela-tionships between variables in big databases.
2.2.2 Machine learning evaluation
When creating a machine learning algorithm, it is useful to evaluate the different aspects of the algorithm, for an instance the speed, precision or accuracy.
To evaluate the accuracy of an object detection model, calculating the Mean Average Precision or mAP[26][27], and this will be evaluated in the results to show the performance of the training set. To do calculation of AP in object detection Intersection of Union (IoU)[26]S is needed, as it is used to determine if a predicted bounding is true positive, false positive or false negative. To explain further on this metrics, then some terms like precision and recall must be explained. Precision measures the accuracy of the predictions made in advanced, recall measures how good you find all the positives.
P recision = T P
T P + F N (1)
Recall = T P
T P + F P (2)
• True Positive (TP): The prediction that was made is true, and the actual output is positive.
• False Positive (FP): The prediction that was made is false, and the actual output is positive.
• False Negatives (FN): The prediction that was made is false, and the actual output is negative.
2.2.3 Deep learning
Deep learning, a technique of Machine Learning that is based on automatically learning good feature representation from input data. The typical architectures for deep learn-ing are deep belief networks (DBNs), stacked auto encoder and convolution neural net-work (CNN) (2.4) which are the most effective methods that is being used for image
classification[28]. As Machine Learning is also a subset of Artificial Intelligence, this is a term that refers to techniques that is set to enable a computer to mimic a humans behavior[29]. Inspired by the human brain, it also creates the layout by mimicking the human brains own layout which consist of neurons.
2.3 Machine Learning process
Choosing a machine learning algorithm to solve a given problem is important in the ma-chine learning process. However, there are many other aspects to consider when using machine learning to solve problems. The solution depends on the existing data that must be carefully gathered and labeled.
A model can have difficulty recognizing data instances when the class gets overrepre-sented. Negative data should also be included, especially when certain objects are often misidentified. The data should also be trimmed to obtain inconsistencies and outliers. Overfitting may occur, which means that the algorithm will adapt to its training data, but it will perform poorly on any other data. This means that it has memorized rather than learning to generalize it correctly. Adding more data helps to solve this problem.
2.4 Convolutional Neural Network (CNN)
Convolutional Neural Network is a category of Neural Network, that has been proven to be highly proficient in areas such as classification, image recognition, segmentation and object detection[30]. A CNN consist of many convolutional and subsampling layers. The architecture of a CNN has input and output, as well as multiple layers. The hidden layers consist of a series of convolutional layers that has convolve with a multiplication[31].
Figure 2: CNN Architecture[1]
1. Convolutional layer: The input is an image that passes through a convolutional layer result in creating a feature map that predicts the class probabilities for each feature by applying a filter that scans the whole image, few pixels at a time. 2. Pooling layer: The pooling layer reduces the dimensions of the data by combining
the output from the convolutional layer generated from each feature and maintains the most essential.
3. Fully connected layer: Takes the result of the convolution and pooling layer process to then decide and reach a classification decision.
2.5 YOLO (You Only Look Once)
You Only Look Once (YOLO) is a method used for real time object detection. When YOLO gets an input image, it divides the image into S x S grid where S is an random value for the amount of grids, and where each cell grid produces bounding boxes and gives them a confidence score, each cell also does a class prediction. The same convolution neural network (CNN)(2.4) is used for the class prediction and the generated bounding boxes [26]. Each cell produces multiple bounding boxes, The class predictions and the produced bounding boxes happen in the last layers of the CNN.
YOLO is an open source with different versions [26]. The strongest advantage YOLO has compared to similar methods is the speed of 45 frames per second. Other similar algo-rithms such as R-CNN[32] and DPM [33] has a much lower FPS. R-CNN has an FPS rate of 0.05 and DPM has a rate of 0.07. [34]. However, R-CNN and DPM contributes with better accuracy. There are other implementations of YOLO, in this paper YOLOv3-tiny is used as it is faster than YOLOv3 but less accurate.
Humans sees an image and instantly know what objects are in the image, how the objects interact and where they are. For humans, it is fast and accurate which allow us to per-form different complex tasks such as driving with little conscious. To add perceptions to autonomous cars, an object detection algorithm needs to be accurate and be able to give real-time scene information to the driver.
2.6 Single Shot Detector (SSD)
Like the YOLO algorithm, the SSD takes only one shot to detect multiple objects that is present in the frame. It is a multi-target detector that is based on a single neural network[35]. SSD uses the convolution layer of the VGG16 [36], and removes the fully connected layer of the VGG16 network, then it adds multiple convolution layers to form a full convolutional network. The model adopts a 3x3 convolution kernel layer to execute the operations on the feature graphs of different convolutional layers, and then outputs the score and position of the detected objects.
Figure 3: Network structure of SSD model[2]
In Figure 3 that describes the network structure of SSD, the model extracted image fea-tures from conv4 7, conv7, conv8 2, conv9 2, conv10 2 and conv11 2 for object detection. The last result is recovered by non-maximum suppression as shown in Figure 4 below.
Figure 4: Non-maximum suppression
2.7 Speed/Accuracy trade-offs
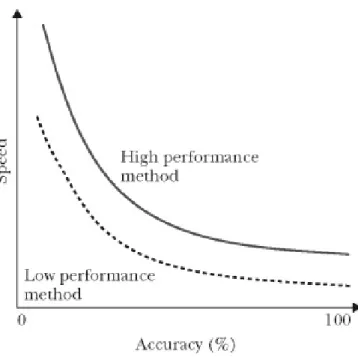
The relation between these two is very complex, as it is very hard to maintain them both at a high level. In the case of real-time environment where the focus is on Advanced driver-assistance systems (ADAS), a decision needs to be made fast, and by that means that the detection of pedestrians and vehicle needs to be fast. In a trade-off there are two alternatives, decisions are made fast which results to higher error-rate or slow which then results in higher accuracy[37][38].
Figure 5: Speed/Accuracy trade-off
As shown in the Figure 5, the performance of each axis depend on the other, so if speed decreases than the accuracy increases. The trade-off between speed and accuracy needs both at a balanced level, otherwise it will be fast with weak detection or good detection with low speed. The trade-off between speed and accuracy needs to be at a balanced level[38].
2.7.1 GPU (Graphical Process Unit)
GPU is important for consideration in Deep Learning, as it is efficient for matrix multipli-cation and convolution. Each GPU provides many processing cores that have much faster arithmetic operations than a classic Central Processing Unit (CPU)[39]. CPU is latency optimized while GPU is bandwidth optimized. The CPU can fetch some memory (pack-ages) in the RAM quickly while the GPU is slower in doing that (much higher latency).
The CPU has to go back and forward numerous times to do its work area (A → pick up 3 packages → work area B ... repeat) while the GPU can fetch much more memory at once (work area A → pick up 120 packages → work area B ... repeat).
2.8 Transfer learning
A machine learning methodology named Transfer learning, is a method used to transfer knowledge across domains[40]. Transfer learning aims to use knowledge from a source domain (related domain) to improve the learning performance, this is inspired by human beings’ capabilities to transfer knowledge. When transfer learning from other existing models, it can be useful as it takes time to train a model from scratch, even with pow-erful computer hardware. Transfer learning allows the user to re-use data from proved learning[41].
3
Related Work
In this section different related works will be presented.
3.1 Object detection algorithms
Deep learning approaches have become very useful and popular for object detection prob-lem in the last recent years. The deep learning approaches can be divided and classified into regression based techniques and region based techniques. Region-based convolution neural networks(R-CNN)[32] contributes with better performance in terms of classifica-tion accuracies and localizaclassifica-tion. Although R-CNN can give good results, the problem is the high cost in terms of latencies and storage. When utilizing neural network instead of selective search in Faster R-CNN and in Fast-RCNN not only improves the speed, but also helps them achieve better and higher accuracies[42].
YOLOv3[27] and Redmon J. et al’s algorithm[26] integrate the tasks of classification and localization into a single convolutional network, with that improving the speed at the cost of precision. SSD is an recently popular that introduces multi-scale feature mapping layers[35] and default boxes.
If we discuss the two approaches above, there is an valuable difference between them as the first approach focuses more on predicting the object correctly, but on the cost of la-tency and memory, while the second approach is more focused on producing faster results at a reduced precision. Here, the second approach would be more suitable for vehicle and pedestrian detection as it must be real-time.
As explained above, pros and cons were presented for the two deep learning approaches. We came to conclusion that the YOLO model was best suitable for this project because of its result on real time comparing to other models. Even though the accuracy of YOLO is less compared to the other models as discussed above, The accuracy of YOLO is slightly compared to the other modules as discussed, the great ability of YOLO to classify and detect objects at real-time outweighs its disadvantages.
In a study made by Lan et al[43], an improvement of YOLOv2 is presented. This pa-per proposes a new structure of the YOLO network, called YOLO-R. With the ambition to have an algorithm that has better precision, recall and intersection over union (IOU). Precision measures the accuracy of the predictions made in advanced, recall measures how good you find all the positives.
A comparison between YOLOv2 and YOLO-R were made using INRIA pedestrian dataset, the result showed a clear improvement, YOLO-R showed better result on Precision, Recall and IOU. YOLO-R showed a reducing false detection and missed detection rate, with a speed reaching 25 frames per seconds.
Table 1: Comparison between YOLO-R and YOLO v2 using INRIA pedestrian dataset YOLO-R YOLO v2
Precision 98,56% 97,37% Recall 91,21% 89,33% IOU 76,18% 74,46%
Extra layers were added to the original YOLO algorithm to achieve those results. The three passthrough layers that were added consists of Route layer and Reorg layer. Their role is to link both high and low resolution and also connect the deep layer pedestrian features with the shallow pedestrian layer features. The Route layers role is to pass infor-mation about the pedestrian characteristic of the specified layer to current layer, then with the Reorg layer match the feature map of the next layer with the currently introduced Route layer feature map.
Chen et al[44], introduces a object detection, localization and tracking system for mobility applications like traffic road and railway environment. The approach for this project is not set, as they were going to compare two deep learning approaches: You Only Look Once (YOLOv3) and Single Shot Detector (SSD), to identify their applicability in traffic environment. The objective is to dictate if the direction of a vehicle or pedestrian can result to a dangerous situation. According to [44], when they compared the YOLOv3 al-gorithm with the SSD, it was shown by evaluation that YOLOv3 had better performance than SSD[44]. If the SSD has an input resolution at 300*300, it would have the same inference as the YOLOv3 at the input resolution 416*416, the precision of YOLOv3 is higher. YOLOv3 is faster than SSD, which is applicable to real-time. This was a useful paper for this project which contribute with valuable information about the difference between the two approaches that are considered for this project as well.
Chandan et al[45] presents a solution for a system to detect object in real time using deep learning and OpenCV. In this paper, an SSD and MobileNets algorithms that are implemented for object detection in a python environment. The algorithm is set to detect objects in motion, by using methods like (Frame differencing, Optical flow and Background subtraction). A python program is developed for the SSD algorithm and implemented in OpenCV. The model is trained to detect 21 object classes like car, person, motorbike, dog and many more with the accuracy of 99%. This paper is relevant to this thesis as it focuses on a different algorithm and compare the results of YOLO and SSD which the result is beneficial. Chandan et al has used OpenCV which is a library of programming function, was designed and mainly aimed at real-time computer vision.
Zhang et al[46] proposed an retime pedestrian detection based on Tiny-YOLOv3 al-gorithm, as the detection speed is the fastest algorithm in the present. The method used is k-means clustering on the training set to find the best priors. The authors also improved the structure of the Tiny-YOLOv3 algorithm to increase the accuracy, while also main-taining the speed. From the results it was shown that the detector has higher detection accuracy. The average precision (AP) from the improved Tiny-YOLOv3 was increased by 5.44% from the previous structure of Tiny-YOLOv3. This paper has provided us with wider aspect of how we can adjust the Tiny-YOLOv3 algorithm to increase the average precision. It gave us more options on how we should approach our problem in increasing the AP while maintaining the speed.
3.2 Distance estimation
Philips et al[47] presents low-cost system the collision risk from an time horizon from a monocular camera, like a dashboard-mounted camera. The system includes components for object tracking, object detection, and state estimation. The system is designed such that alternative components can be substituted with minimal effort. This paper helps us to get an better understanding of how distance estimation is calculated, and how we can implement it in to our system. The camera is also mounted on the dashboard.
Haseeb et al[48] a machine learning setup that provides obstacle detection system with a method to estimate distance from the monocular camera mounted on the dashboard to the captured object. From this paper we get a better understanding of which components can be used to triangulate and estimate distance, one of those can be either two stereo camera or a camera and laser.
Saleh et al[49] has implemented the deep learning model with YOLO, to minimize the size of the labeled dataset and provide higher accuracy. This is an effective method using a single monocular camera to perform real-time traffic signs recognition and distance es-timation between traffic sign and camera pose. The model based on YOLOv2 is applied to recognize traffic signs with an average speed of approximately 60 ms/frame and with an accuracy of 97%. The distance is estimated based on the ratio between the area size of the boundary box containing the traffic sign. By using an algorithm that is one of our candidates, and by calculating distance to an object, which in our case will not be traffic signs, could be adjusted and implemented to our own case which is vehicle and pedestrians.
In this paper a vehicle-detection method using a convolutional-neural-network (CNN)-based object detector is proposed. A module is designed DRFBNet300, to improve the accuracy of MobileNet v1 backbone SSD300, which is a light and fast detector. Seongkyun Han et al[50] also proposed a Split Image Processing (SIP) method to improve the accuracy of the model created. The authors own designed module achieved 21 mAP with 45 FPS in the MS COCO metric. A proposed method for distance measurement was bird-view UAV imagery.
Figure 6: Unmanned-aerial-vehicle (UAV) imagery-capturing schematic concept
3.3 Training the algorithm
Tong et al[51] proposed to improve children’s automatic speech recognition performance with transfer learning techniques by using two approaches of transfer learning. The first method is by using pre-trained models to adapt to their own adult model and the second
method is to train acoustic model with deep neural network based multi-task learning ap-proach. This paper has given us a good understanding of the two approaches the transfer learning consists of. We are therefore considering to use the first method as it applies better for this thesis, and by using pre-trained model to be trained upon.
J.Ponce et al [52] presented a paper about different datasets for object recognition pur-poses. In the paper a discussion is made based on lessons learned from existing efforts towards algorithms trained with different datasets, as well as innovative methods for ob-taining large and diverse annotated datasets. This paper discuss datasets that would be suitable for this thesis and displays the test results between different datasets in a clear graph. They also proposed some criteria for collecting future datasets, which is helpful for this thesis later in the machine learning process.
4
Method
The research methodology that is going to be used for this thesis is outlined by Nunamaker et al.[3]. This method is used when developing a product or a system, and the aim of this work is to further develop our chosen algorithm. As shown in Figure 7, the method consists of 5 stages where it describes the systematical approach of how to construct and evaluate a system. The main reason why we choose this method is because it has the capability for iteration and even for being systematical, which we used to design the system.
Figure 7: Nunamaker’s approach on system development research process[3]
A function tree diagram is developed with the purpose to illustrate all the functions which is needed to achieve the goal of this paper (see Figure 18 ).
4.1 Construct a conceptual framework.
The important step in this initial stage is to establish the problem domain and research questions. When the literature search has been utilized, it will provide useful related work that can be helpful for this thesis. It is also a great opportunity to investigate the field area of machine learning and object detection, and use that to then further develop the system.
4.2 Develop a system architecture.
The system will be developed consisting of a Axis IP camera in the image resolution 1440x1080 and 960x720. The processing part for detection is executed from the laptops. The Axis camera will be placed on the vehicles dashboard and will record the road ahead in real time. The developed YOLOv3 tiny algorithm detect objects and segment them using the developed segmentation method bounding boxes. Each segments represents the relevant objects either cars ahead in traffic road or pedestrians. A driver or user can also monitor the performance of the algorithm and detected objects using the system and performance of the system. it is noteworthy to indicate that no data will be stored in the laptop due to General Data Protection Regulation. All data in the project will be treated according to the EU law: GDPR 2016/679, the system can be observed in Figure 8. The key steps in the machine learning training process have also been identified.
The project is to develop and test a computer vision system for real-time vehicle and pedestrian detection for giving notification to the system, a level 2 of automation for cars was used to verify the result of the developed algorithm and the system.
1. Data collection: The data will be collected, and will dictate how accurate the model is based on the quantity and quality. The first step will be to start to look for annotated object detection datasets for specific objects like vehicles and pedestrians, and this is where RQ1.2 will be answered. The Open Images Dataset V4[53] is one of dataset that will be selected because of the huge amount of data it contains, 15.4M
bounding boxes for 600 object classes. After downloading the images, the data will be analyzed to see if there exist any negative data, and maybe images that is not labelled correctly.
2. Data preparation: After the collection training data, the next step will be to proceed to data preparation, loading the data to the appropriate location, and then preparing for machine learning training. First the data will put together, then the order are randomized, because the order of the data should not affect what the model learn. If the dataset consists of negative data it will be discarded as it can impact the performance. The images will be re-labeled so the bounding boxes on the images will better identify an object. The first part used to train the model will be most of the dataset, and the second part will be used to evaluate the performance of the trained model.
3. Choosing a model: By reviewing literature, the decision will be made to choose a suitable algorithm for the purpose. Thereafter weights and configuration files will be downloaded from an open source neural network framework written in C and CUDA[27] called Darknet, created by Joseph Redmon, the author of YOLO. 4. Training:
When starting a machine learning process, there are several steps that needs to be familiar before start[54]. First of all, is choosing an algorithm that is suited to solve a specific problem. Then the data used to train the model on must be labeled cor-rectly, as it is very common that the objects can be falsely identified. Overfitting is an issue that can occur when a model that trains the training data too well, that slowly gives negative impacts in the performance of the model. A way to work against overfitting is adding more data[55].
When training a model based on the new data, the aim of training is to increase the performance, and a way to do that is to use transfer learning, for an instance if a model is trained to detect trucks, it could be useful to help train another model on detecting cars. We even improved the dataset for this project as the dataset that was downloaded considered images that was taken from different angles, and bounding boxes that did not catch the object well.
5. Evaluation: The model is evaluated and checked if the accuracy is good enough.
Metrics that will be used:
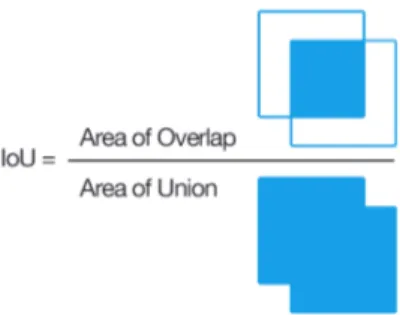
IoU (Intersection over Union), is a evaluation metric that measures the overlap between the boundaries of the ground truth of an annotation and the predicted boundary. IoU evaluates whether a prediction is good enough[41], IoU has a score between 0 and 1, and if the score is close to 1 then prediction is close to perfect.
IoU = area of overlap
area of union (3)
Figure 8: Graphical view of the IoU equation
When an IoU threshold is set, it can determine the correctness of an prediction. A prediction can be considered correct if IoU ≥ 0.5 [27]. With the help of IoU can calculate precision and recall. Another mathematical definition is calculated when the average precision beyond all the recall values is taken, the result will be the mAP of a model which is shown in Section 5.3 [27].
mAP =
PD
d=1AveP (d)
D (4)
In equation 4, the D is the number of detections and AveP(d) is the average precision for a detection, D.
6. Parameter tuning: The input layer of the model will be altered as well as the batch sizes which will be set to 64, and the the amount of training steps present in one batch will affect the model performance[56]. Momentum will be set to 0.9, learning rate will be set to 0.001, and it is how quickly the network replaces the concepts it has learned up until now with the new ones, training steps will be (8000,9000), and this is the amount of steps based on the batch size it takes to complete the processing of the whole dataset. This is to the tune model for improved performance of accuracy and faster training.
7. Predictions: This is the step where inference comes in part, the model will be tested in a real world environment where challenges such as light and weather are not under control, to find out if the detection is accurate, and if it has improved.
4.3 Analyze and design the system.
The detection system is designed, and distance measurement between the Axis camera and object detected is implemented. The Axis camera is then used to catch the camera-feed on the frame, which was then feeded to the model which will output the segmentation using bounding boxes representing where the cars and persons is located.
4.4 Build the (prototype) system.
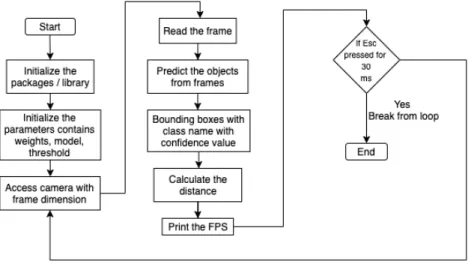
A model is trained to detect pedestrians and vehicles. The configuration file and dataset are needed for labeling the classes[23]. The system is implemented based on the design. The Figure 10 below shows the system overview.
Figure 10: System overview showing every step it will take
Initialize the packages/library
Since the aim is to detect objects in real-time, then it was decided to use OpenCV-Python is a good choice as it is a library of Python bindings designed to solve computer vision problems. OpenCV use Numpy which is a highly optimized library used for numerical operations.
Initialize the parameters contains weights, model, threshold
The model decided for this purpose was YOLOv3-tiny, because it has a simpler network that can improve the detection speed. Speed of object detection is of high importance because the system needs to perform object detection within a second or milliseconds, therefore the model needs to perform fast. For this purpose, in this thesis, the YOLOv3-tiny weights and a configuration file will be trained.
Confidence score
The confidence score determine what the lowest matching value allowable to activate a reaction is. If the matching score is not acceptable, then it is below the cut-of threshold therefore the system will tell the user to repeat the query. In our system the cut-of thresh-old is set to activate the detection per objects, and if the confidence score of the object is lower than the set threshold it will not detect it.
The threshold range must be in the range of 0-1, where 0 means 0% and 1 means 100%. The default confidence score is set to 0.5 which means 50%.
Calculate the distance
To calculate the distance, the derivation of the angle-of-view formula was proposed as it which considers a rectilinear lens in a camera used to photograph an object at a distance S1 which is described in the Figure 11 below. The inspiration of using this formula was
from the paper done by Han et al[50] were the authors proposed a method for distance measurement which was bird-view UAV imagery, but the method will be re-adjusted for the camera to be placed on the dashboard of the car.
Figure 11: Angle-of-view formula[4]
The angle-of-view formula is then described in to the graphical view of the calculation below which is seen in Figure 12 below.
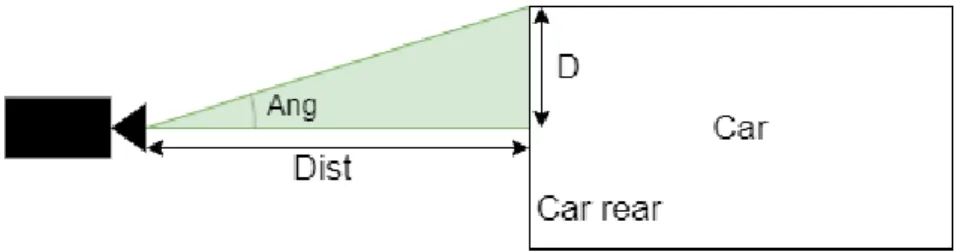
Figure 12: Graphical view of the calculation D = width 2 (5) tan(Ang) = D Dist (6) Dist = D tan(Ang) (7)
This is where the distance is calculated(RQ1.1), when Ang and D is known. Dist is the Distance from the camera to the car, Ang is the angle-of-view, since it is the angle including the largest object whose image can fit on the frame and D is the half width of the car. The width of the car is taken from the generated bounding box surrounding the car.
4.5 Observe and evaluate the system.
The system is evaluated as to whether it can detect objects in real time and display the speed and distance of the detected object. If problems occurs, relevant method steps are repeated until a functioning prototype is developed.
5
Results
All results and data in the project are treated according to the EU law: General Data Protection Regulation (GDPR) 2016/679.
An object detector has now been developed in Python version 3.8.2, able to detect persons and cars in real-time, performing in 6, 18 or 28 frames per seconds on a camera-based sys-tem which is shown in Table 4. The decision was to work with the YOLOv3-tiny algorithm due to the fact that in previous works it has been concluded that the YOLO algorithm is faster than SSD and other object detection algorithms mentioned in Related work when it comes to traffic environment, this answers RQ1. Speed is in relation with the input layer that was provided, which resulted to speed being traded for accuracy. Our customized model of YOLOv3-tiny is able to detect cars and persons in daytime and nighttime, which meets the project objective as shown in Figure 13 and Figure 14.
By following the machine learning process the customized YOLOv3-tiny model was trained with 2 different datasets, and the results were highly improved based on the datasets. In the first dataset, the average precision was initially low for the two classes of the first dataset, which resulted the system detecting the objects with difficulties. To overcome this issue, the dataset was changed from Open Images V4[53] to INRIA[57] which turned out to have better labeled images, and we re-labeled 1000 of 5500 images which improved its performance see Figure 13.
For re-labeling images the software Preview was used which is the image viewer of the MacOS operating system. The problem of the first dataset occurred due to weak labeling of images, which is solved by improving the labeling in the second dataset. Thereafter the performance of the model was increased.
Figure 13: Example of dataset re-labeling.
5.1 Testing
The tests and figures shown in the results were captured from the Axis IP camera, the recording took place during both daytime and nighttime as shown in Figure 12 and Figure 13. The recording was in a moving car with the camera mounted on the windshield of the car. Since the project was processed in accordance with EU law no faces or number-plates are shown.
5.1.1 Daytime
The Figure 14 below demonstrates how the system can detect multiple cars at once. Each generated bounding box produces a class prediction and shows the confidence score besides. The confidence score value is between 0.0 to 1.0. To avoid wrong object detection, the confidence score must be above 0.7 to generate a bounding box. The values (0.95,0.9,0.99) are the confidence score for the cars. The tests were made in Malmo during rush hour.
Figure 14: Demonstration of how the system can detect multiple cars in daytime.
5.1.2 Nighttime
The Figure 15 below demonstrates the detection of the two classes in nighttime. The confidence score was at its peak, and the persons confidence score value were kind of low as it detected multiple persons at once. The confidence threshold was set to 0.5 because the system did not have the same confidence when detecting in nighttime. The value of the car is 1.0 and for the three persons (0.56, 0.6, 0.61) which is the confidence score resulted for the persons. This was a test performed in Helsingborg during nighttime in a calm environment.
Figure 15: Demonstration of how the system can detect a car and multiple persons in nighttime.
5.2 Distance
The main purpose of measuring the distance is to be able to warn the user and vehicle system when the distance to a car is small. Therefore, it is only appropriate to measure distance to the car right in front, and not parked or oncoming cars, to avoid warning spam. This is the reason, Equation 5, Equation 6 and Equation 7 expressed in Chapter 4 was applied for calculation of distance between the moving car and the detected objects ahead. As seen in the Figure 16 below, the distance is only calculated in 1 of the 3 detected vehicles and the unit of measurement is meters. The values (0.9, 0.81, 0.92) are the confidence score for the cars, and distance value is 14.9 meters from the car. If the distance is below 10 meters a warning notification will appear, and this answers the RQ1.4.
Figure 16: Demonstration of how the system can detect distance.
To only detect vehicles in front two vertical lines is generated see Figure 15, with the requirement that the car or person is between these two lines.
Figure 17: The green vertical lines illustrate the midpoint.
The Figure 17 illustrates the vision of the camera to the car, and W is width and H is height.
A demonstration of the warning notification is demonstrated in Figure 18 below. Since the distance is less than 10 meters the warning appear.
Figure 18: Demonstration of warning notification
5.3 Evaluation
The FPS was decreased from 22 to 18 when the model was trained with INRIA dataset[58], the speed/accuracy trade-off affects it, see Figure 5. In this model with INRIA dataset, the detection rate was higher than the previous dataset but it resulted to slower FPS. In this thesis the aim was to achieve around 20-25 FPS with good accuracy, but when having a hard time testing and developing with the laptops GPU which is Intel Iris Graphics 550, a switch to a better performing GPU which was AMD RX580, it showed better results
because the FPS increased, and the model started detecting a lot faster, and this also answers RQ1.3.
The Open Images dataset[53], was trained upon this model but resulted with very low average precision (AP) in the person class and that would not be useful in this thesis, as the person class is one of the critical classes to this custom made detection model. Which is noted in the Table 2.
Table 2: Table illustrating the average precision for each class trained with Open Images Dataset v4
Classes AP Car 65.64% Person 26.94%
The INRIA dataset were used with a training set of 5500 images which was around 2250 images per class, and the training model was able to increase the car class average precision (AP) from 65.63% to 83.04% and person class from 26.94% to 41.24% as shown in Table 3. Batch size was set to 64, momentum was set to 0.9, learning rate was set to 0.001 and training steps was set to (8000,9000) which is 80% and 90% of the total training steps. Table 3: Table illustrating the average precision for each class trained with INRIA dataset
Classes AP Car 83.04% Person 41.24%
When the input layers of the model was customized, it showed that there exist a relation-ship between mAP, speed and the size of input layers. Increasing the width and height of the input layer in the configuration file resulted to a slower but more accurate model. When instead decreasing the size of an input layer, it resulted to a faster but less accurate model, as the Table 4 below shows.
Table 4: Table is showing the relation between speed, mAP and different input layers Dataset composition mAP FPS
832x832 Input layer 63.24% 6 416x416 Input layer 62.14% 18 224x224 Input layer 43.64% 28
The original YOLOv3-tiny has an mAP of 33.1%, trained with the COCO dataset [59], in Table 5 a comparison between the original YOLOv3-tiny and our customized models is made. Table 5 shows an improvement from the original models mAP of 31.3% to the latest version of our customized YOLOv3-tiny mAP of 62.14%. The dataset was changed to INRIA dataset by using transfer learning, a conclusion was made that it yields higher mAP for models, which can be seen in comparison between the two customized Tabel 4 and Table 5 where the mAP improved in the second dataset. When the customized model
was trained with the Open Images dataset, it did not get high mAP due to bad images that it contained. However, when the dataset was changed to INRIA dataset it increased to a mAP of 62.14% before overfitting. Batch size was set to 64, momentum was set to 0.9, learning rate was set to 0.001 and training steps was set to (8000,9000). The train-ing process for each dataset is shown below in Figure 17. As it can be seen in Table 5, our customized YOLOv3-tiny algorithm using INRIA dataset achieved higher mAP than Open Images Dataset and existing YOLO-v3-tiny using COCO dataset. More reason for this improvement in presented in Analysis chapter. A analysis of mAP is presented in Section 6.4.
Table 5: Table illustrating the mean average precision for each trained model with dataset Pre-trained model Dataset mAP
YOLOv3-tiny COCO Dataset 31.3% Developed YOLOv3-tiny Open Images Dataset v4 46.28% Developed YOLOv3-tiny INRIA dataset 62.14%
Figure 19: Illustrating mAP during training process
As can be seen in the Figure 19 the training process was stopped at around 4000 iterations due to overfitting. One iteration process 64 images, almost 312 iterations are one epoch which is when an entire dataset is passed forward and backward through the neural network only once.
6
Discussion and Analysis
6.1 Threats to validity
The problem with the dataset is that it could not improve the result to its maximum, due the fact that the data was not all labeled correctly, and that the small cars were not removed from the dataset. Small cars that are far away who does not effect the driver or contributes with some risks. If these cars are removed the model would have a higher mAP. The system is not focused or tested in bad weather conditions, which is something that would be on focus for future work.
6.2 Speed/Accuracy trade-off
This study shows that when a model’s performance is increased, the speed to detecting objects will decrease. A trade-off between the both is the main reason for this, as the system would like to detect the objects correctly it will result to the system will be slower in FPS, because it wants to be more cautious when detecting. The GPU played a fun-damental role which was also mentioned in the section Limitations, which is when an object detection process is active, one of our laptops achieved up to 2-3 FPS which all depended on the GPU, as the other components were strong enough to run the detection. When the testing part was in process, a better GPU was tested and resulted in 17-18 FPS.
Another factor that affected the accuracy was detecting in nighttime. The lights from the vehicles was a hindrance because it made the camera deflect which resulted in diffi-culties for the camera to focus on the objects. To handle that, during testing in nighttime the confidence threshold was decreased from 0.7 to 0.5.
6.3 Training
6.3.1 Dataset
When the data was collected, the first choice of dataset was Open Images Dataset V4, which resulted to a small increase of mAP but the value was not satisfying as the model detecting objects with difficulties. An examination of the first dataset had to be done, to get a rare look of what images the dataset consisted of. The images consisted of cars in bad angles, labeling of the cars and persons were not labeled correctly and some images were duplicates. All of this is negative data that can affect the training process, and would not make it possible to achieve the performance that was expected. In this study, the focus was to collect a dataset that consisted of images that is related to an traffic environment, where it consisted of many multiple cars and persons in every image.
Therefore we started to look for other datasets, based on the literature studies, we come to a conclusion that the INRIA dataset was the proper choice as it focused more on traffic environment. An overview of the dataset was made, and it contained almost all of the images that we were looking for which is image of cars and persons in different angles. The negative data existed in this dataset as well, almost 1500 images of the 5500 that was downloaded, had not been labelled correctly. As previously stated in the results, 1000 images of the INRIA dataset was re-labeled and then trained the model on the customised INRIA dataset, after the training we find out that the accuracy of the YOLOv3-tiny increased significantly.
6.3.2 Transfer learning
The results show that using transfer learning can indeed improve the accuracy of the YOLO object detection algorithm. The datasets that the original models are trained upon is relevant to their purpose. Models trained using broad datasets with the ability for detecting many different object classes in the hidden layers, will not be suitable for a model detecting just a few specific objects. In this thesis the results of a customized model of the YOLOv3-tiny algorithm is presented, with an increased mean average precision, trained on similar object shapes to contribute with the best results. Transfer learning is an optimization, and it is an approach to save time or get better performance while training your model, therefore we reused the YOLOv3-tiny weights from Darknet[60].
6.4 Mean Average Precision (mAP)
The mAP considers the average of everything for the average precision. Some models do not perform well on small objects but perform better on larger ones (e.g. cars that are close vs cars that are far and small in the image). In this project, we have not removed small cars in the dataset which may increase the performance if undesired far-way (small) cars are neglected as they do not have any cause to the accidents or safety of a car.
6.5 Future work
This study has focused on improving the performance of the object detector by using previous existing datasets. Another approach could be to create our own dataset which could be time consuming and not in the scope of this project. To capture high resolution images, and labeling every image correctly from the beginning, instead of relabeling parts of a dataset. A way to combat overfitting is to gather more data, this is maybe something to consider.
Future work concerns developing a system with multiple high resolution cameras, which will make it possible to keep track on the traffic lanes. With traffic lane tracking further warnings can be notified to the driver, if a car approach the driver’s lane inappropriate. In addition, research directions on traffic lights and traffic signs detection can also be carried out in future. Contributed detection to the algorithm gives opportunity for further safety of the system. Furthermore, speed estimation is a great contribution as well.
6.5.1 Distance
The distance measurement accuracy would increase with two cameras recording, or a combination of a camera and a laser. When two equipment (camera + camera) or (camera + laser) are used[48], the distance between the equipment is measured, which make it easier to calculate the distance, because when using the triangulation method the baseline (L) is already known before starting the distance calculation. The prototype would look like Figure 20 below.
(a) Two cameras (b) Camera and laser
Figure 20: Illustration of calculation with 2 equipment
Since the resources for this project was one IP camera, measuring the distance got more challenging. We managed to solve this by flipping the triangle as shown in Figure 12. Measuring the distance with a laser only measures the object pointed at by the laser, and it requires a laser of high quality. While using one or two cameras the distance can be measured on all detected objects in the field of view. Using multiple cameras can also contribute in detection of objects in right or left lanes in front of the cameras.
In our developed YOLOv3-tiny, the distance is only measured with one camera and only for cars in front as shown in Figure 16. The reason for that is to reduce notification spams for oncoming and parked cars on the side of the road. The two generated verticals lines illustrated in Figure 17, can easily be removed from the algorithm to be able to get dis-tance from all detected objects. Since statistics shows that most commonly accidents in traffic is rear-end collisions [13], the focus was set to increase safety for those those types of collisions.
7
Conclusion
After research and compression, results showed that the You Only Look Once (YOLO) algorithm is the most suitable for solving real-time object detection in traffic environment. In this thesis a version of the YOLO entitled YOLOv3-tiny is developed and presented with higher mean average precision on vehicles and pedestrians detection in real-time. The developed YOLOv3-tiny object detection model is trained with distance measurement to the detected objects, with the purpose to increase road safety. The distance is limited to only detect vehicles in front to reduce warning notification. The warning notification appear when the distance to vehicles in front is less than 10 meters. The model is trained
with different datasets, but INRIA dataset resulted with highest mAP, increasing from 31.3% to 62.14% before overfitting, with a performance of 18 frames per second and a input layer of 416x416. The model is capable of real-time detection and all the test results is from a real world environment, where the environment can not be controlled, such as light and weather. The proposed system was tested using an Axis IP camera in the real-environment using level 2 automation. The project aimed increasing the accuracy while maintaining the speed of detection.
References
[1] Y. Lecun, L. Bottou, Y. Bengio, and P. Haffner. Gradient-based learning applied to document recognition. Proceedings of the IEEE, 86(11):2278–2324, 1998.
[2] Wei Liu, Dragomir Anguelov, Dumitru Erhan, Christian Szegedy, Scott E. Reed, Cheng-Yang Fu, and Alexander C. Berg. SSD: single shot multibox detector. CoRR, abs/1512.02325, 2015.
[3] Jay F. Nunamaker Jr., Minder Chen, and Titus D.M. Purdin. Systems development in information systems research. Journal of Management Information Systems, 7(3):89– 106, 1990.
[4] Wikipedia contributors. Angle of view — Wikipedia, the free encyclopedia, 2020. [Online; accessed 6-June-2020].
[5] Road traffic injuries and deaths — a global problem. 2019. https://www.cdc.gov/ injury/features/global-road-safety/index.html.
[6] Global status report on road safety 2018. 2018. https://apps.who.int/iris/ bitstream/handle/10665/277370/WHO-NMH-NVI-18.20-eng.pdf?ua=1.
[7] Road traffic injuries. Feb, 2020. https://www.who.int/news-room/fact-sheets/ detail/road-traffic-injuries.
[8] Evidence stacks up in favor of self-driving cars in 2016 nhtsa fatality report. Feb, 2017. https://www.digitaltrends.com/cars/2016-nhtsa-fatality-report/. [9] Causes of distracted driving—and what they all have in
common. Jul, 2014. https://safestart.com/news/ top-10-causes-distracted-driving-and-what-they-all-have-common/.
[10] Pedestrian detection with full auto brake - world-class cutting-edge technology in the new volvo s60. Mar, 2010. https://www.media.volvocars.com/se/sv-se/media/ pressreleases/31773.
[11] SAS. Machine Learning - What it is why it matters. Feb. 2017. https://www.sas. com/it_it/insights/analytics/machine-learning.html.
[12] Martin Strohbach, J¨org Daubert, Herman Ravkin, and Mario Lischka. Big Data Storage, pages 119–141. 01 2016.
[13] 2015 motor vehicle crashes: Overview. page 9, 08 2015.
[14] George A. Peters and Barbara J. Peters. The distracted driver. Journal of the Royal Society for the Promotion of Health, 121(1):23–28, 2001. PMID: 11329694.
[15] James. Munis. More a than i: Why artificial intelligence isn’t, but you are. In 2015 IEEE International Conference on Systems, Man, and Cybernetics, pages 2429–2434, Oct 2015.
[16] Eduardo A.B. da Silva and Gelson V. Mendon¸ca. 4 - Digital Image Processing. In Wai-Kai Chen, editor, The Electrical Engineering Handbook, pages 891 – 910. Academic Press, Burlington, 2005.
[17] Guobo Xie and Wen Lu. Image edge detection based on opencv. International Journal of Electronics and Electrical Engineering, 1:104–106, 2013.
[18] Mr Salem, Saleh Al-Amri, N Kalyankar, and Khamitkar. Linear and non-linear con-trast enhancement image. IJCSNS International Journal of Computer Science and Network Security, 10, 01 2010.
[19] Marc Romanycia and Francis Pelletier. What is a heuristic? Computational Intelli-gence, 1:47 – 58, 01 1985.
[20] Stanley J. Reeves. Chapter 6 - Image Restoration: Fundamentals of Image Restora-tion. In Academic Press Library in Signal Processing: Volume 4, volume 4 of Academic Press Library in Signal Processing, pages 165 – 192. Elsevier, 2014.
[21] T Pavlidis. Image analysis. Annual Review of Computer Science, 3(1):121–146, 1988. [22] Song Yuheng and Yan Hao. Image Segmentation Algorithms Overview. arXiv, July
2017.
[23] Tsung-Yi Lin, Michael Maire, Serge Belongie, James Hays, Pietro Perona, Deva Ra-manan, Piotr Doll´ar, and C. Lawrence Zitnick. Microsoft coco: Common objects in context. In David Fleet, Tomas Pajdla, Bernt Schiele, and Tinne Tuytelaars, editors, Computer Vision – ECCV 2014, pages 740–755, Cham, 2014. Springer International Publishing.
[24] E. Alpaydin. Introduction to Machine Learning, pages 1–20. 2014.
[25] Laura Fiorini, Filippo Cavallo, Paolo Dario, Alexandra Eavis, and Praminda Caleb-Solly. Unsupervised machine learning for developing personalised behaviour models using activity data. Sensors, 17:1034, 05 2017.
[26] Joseph Redmon, Santosh Divvala, Ross Girshick, and Ali Farhadi. You only look once: Unified, real-time object detection. In The IEEE Conference on Computer Vision and Pattern Recognition (CVPR), June 2016.
[27] Joseph Redmon and Ali Farhadi. Yolov3: An incremental improvement. arXiv, 2018. [28] Nassim Ammour, Haikel Alhichri, Yakoub Bazi, Bilel Benjdira, Naif Alajlan, and Mansour Zuair. Deep learning approach for car detection in uav imagery. Remote Sensing, 9(4), 2017.
[29] T. J. Sejnowski. The Deep Learning Revolution, pages 1–10. 2018.
[30] J. Salamon and J. P. Bello. Deep convolutional neural networks and data aug-mentation for environmental sound classification. IEEE Signal Processing Letters, 24(3):279–283, March 2017.
[31] P. Samudre, P. Shende, and V. Jaiswal. Optimizing performance of convolutional neu-ral network using computing technique. In 2019 IEEE 5th International Conference for Convergence in Technology (I2CT), pages 1–4, 2019.
[32] R. Girshick. Fast r-cnn. In 2015 IEEE International Conference on Computer Vision (ICCV), pages 1440–1448, 2015.
[33] Hye Choi, Yoon Lee, Duk-Sun Shim, Chan Lee, and Kwang Choi. Effective pedestrian detection using deformable part model based on human model. International Journal of Control, Automation and Systems, 14, 10 2016.
[34] Bing Wang, Kap Chan, Gang Wang, and Haijian Zhang. Pedestrian detection in highly crowded scenes using “online” dictionary learning for occlusion handling. 10 2014.
[35] Di Fan, Shuai Fang, Xiaoxin Liu, Yongyi Li, and Shang Gao. A multi-scale face detection algorithm based on improved ssd model. pages 1–9, 05 2019.
[36] H. Qassim, A. Verma, and D. Feinzimer. Compressed residual-vgg16 cnn model for big data places image recognition. In 2018 IEEE 8th Annual Computing and Communication Workshop and Conference (CCWC), pages 169–175, 2018.
[37] Lars Chittka, Peter Skorupski, and Nigel Raine. Speed–accuracy tradeoffs in animal decision-making. Trends in ecology evolution, 24:400–407, 05 2009.
[38] Richard P. Heitz. The speed-accuracy tradeoff: history, physiology, methodology, and behavior. Frontiers in Neuroscience, 8:150, 2014.
[39] Igor Coelho, Vitor Coelho, Eduardo Luz, Luiz Ochi, Frederico Guimar˜aes, and Eyder Rios. A gpu deep learning metaheuristic based model for time series forecasting. Applied Energy, 201, 01 2017.
[40] Fuzhen Zhuang, Zhiyuan Qi, Keyu Duan, Dongbo Xi, Yongchun Zhu, Hengshu Zhu, Hui Xiong, and Qing He. A comprehensive survey on transfer learning, 2019.
[41] Schalk Pienaar and Reza Malekian. Human activity recognition using visual object detection. 05 2019.
[42] M. Mathias, R. Timofte, R. Benenson, and L. Van Gool. Traffic sign recognition — how far are we from the solution? In The 2013 International Joint Conference on Neural Networks (IJCNN), pages 1–8, 2013.
[43] W. Lan, J. Dang, Y. Wang, and S. Wang. Pedestrian detection based on yolo network model. In 2018 IEEE International Conference on Mechatronics and Automation (ICMA), pages 1547–1551, 2018.
[44] Z. Chen, R. Khemmar, B. Decoux, A. Atahouet, and J. Ertaud. Real time object detection, tracking, and distance and motion estimation based on deep learning: Ap-plication to smart mobility. In 2019 Eighth International Conference on Emerging Security Technologies (EST), pages 1–6, 2019.
[45] G Chandan, Ayush Jain, Harsh Jain, and Mohana Mohana. Real time object detec-tion and tracking using deep learning and opencv. pages 1305–1308, 07 2018.
[46] Zhang Yi, Shen Yongliang, and Zhang Jun. An improved tiny-yolov3 pedestrian detection algorithm. Optik, 183:17 – 23, 2019.
[47] Derek J. Phillips, Juan Carlos Aragon, Anjali Roychowdhury, Regina Madigan, Sunil Chintakindi, and Mykel J. Kochenderfer. Real-time prediction of automotive collision risk from monocular video. ArXiv, abs/1902.01293, 2019.
[48] Muhammad Abdul Haseeb. Disnet: A novel method for distance estimation from monocular camera. 2018.
[49] Shadi Saleh, Sinan Khwandah, Ariane Heller, Wolfram Hardt, and Ans Mumtaz. Traffic signs recognition and distance estimation using a monocular camera. 11 2019. [50] Seongkyun Han, Ji-Sang Yoo, and Soon chul Kwon. Real-time vehicle-detection method in bird-view unmanned-aerial-vehicle imagery. Sensors (Basel, Switzerland), 19, 2019.
[51] R. Tong, L. Wang, and B. Ma. Transfer learning for children’s speech recognition. In 2017 International Conference on Asian Language Processing (IALP), pages 36–39, 2017.
[52] J. Ponce, T. L. Berg, M. Everingham, D. A. Forsyth, M. Hebert, S. Lazebnik, M. Marszalek, C. Schmid, B. C. Russell, A. Torralba, C. K. I. Williams, J. Zhang, and A. Zisserman. Dataset Issues in Object Recognition, pages 29–48. Springer Berlin Heidelberg, Berlin, Heidelberg, 2006.
[53] Alina Kuznetsova, Hassan Rom, Neil Alldrin, Jasper Uijlings, Ivan Krasin, Jordi Pont-Tuset, Shahab Kamali, Stefan Popov, Matteo Malloci, Alexander Kolesnikov, and et al. The open images dataset v4. International Journal of Computer Vision, Mar 2020.
[54] Pedro Domingos. A few useful things to know about machine learning. Commun. ACM, 55(10):78–87, October 2012.
[55] Davide Chicco. Ten quick tips for machine learning in computational biology. BioData Mining, 10, 2017.
[56] Pavlo Radiuk. Impact of training set batch size on the performance of convolutional neural networks for diverse datasets. Information Technology and Management Sci-ence, 20, 12 2017.
[57] R. Trichet and F. Bremond. Dataset optimization for real-time pedestrian detection. IEEE Access, 6:7719–7727, 2018.
[58] Emmanuel Maggiori, Yuliya Tarabalka, Guillaume Charpiat, and Pierre Alliez. Can semantic labeling methods generalize to any city? the inria aerial image label-ing benchmark. In IEEE International Geoscience and Remote Senslabel-ing Symposium (IGARSS). IEEE, 2017.
[59] Tsung-Yi Lin, Michael Maire, Serge Belongie, Lubomir Bourdev, Ross Girshick, James Hays, Pietro Perona, Deva Ramanan, C. Lawrence Zitnick, and Piotr Doll´ar. Microsoft coco: Common objects in context, 2014.
[60] Joseph Redmon. Darknet: Open source neural networks in c. http://pjreddie. com/darknet/, 2013–2016.
7.1 Appendix
![Figure 2: CNN Architecture[1]](https://thumb-eu.123doks.com/thumbv2/5dokorg/3950146.73723/14.892.176.720.739.951/figure-cnn-architecture.webp)
![Figure 3: Network structure of SSD model[2]](https://thumb-eu.123doks.com/thumbv2/5dokorg/3950146.73723/16.892.168.745.219.399/figure-network-structure-of-ssd-model.webp)

![Figure 7: Nunamaker’s approach on system development research process[3] A function tree diagram is developed with the purpose to illustrate all the functions which is needed to achieve the goal of this paper (see Figure 18 ).](https://thumb-eu.123doks.com/thumbv2/5dokorg/3950146.73723/22.892.120.785.300.416/nunamaker-approach-development-research-function-developed-illustrate-functions.webp)
![Figure 11: Angle-of-view formula[4]](https://thumb-eu.123doks.com/thumbv2/5dokorg/3950146.73723/26.892.224.674.597.889/figure-angle-of-view-formula.webp)