ACTA UNIVERSITATIS
UPSALIENSIS UPPSALA
2014
Digital Comprehensive Summaries of Uppsala Dissertations
from the Faculty of Medicine
1046
Cathepsin S as a Biomarker of
Low-grade Inflammation, Insulin
Resistance, and Cardiometabolic
Disease Risk
ELISABETH JOBS
ISSN 1651-6206 ISBN 978-91-554-9083-6 urn:nbn:se:uu:diva-234027
Dissertation presented at Uppsala University to be publicly examined in sal IV,
Universitetshuset, Biskopsgatan 3, 751 05 Uppsala, Thursday, 4 December 2014 at 13:00 for the degree of Doctor of Philosophy (Faculty of Medicine). The examination will be conducted in Swedish. Faculty examiner: Professor, MD Göran Bergström (Sahlgrenska University Hospital).
Abstract
Jobs, E. 2014. Cathepsin S as a Biomarker of Low-grade Inflammation, Insulin Resistance, and Cardiometabolic Disease Risk. Digital Comprehensive Summaries of Uppsala
Dissertations from the Faculty of Medicine 1046. 48 pp. Uppsala: Acta Universitatis
Upsaliensis. ISBN 978-91-554-9083-6.
Cathepsin S is a protease important in major histocompatibility complex (MHC) class II antigen presentation and also in degrading the extracellular matrix. Studies, most of them experimental, have shown that cathepsin S is involved in different pathological conditions such as obesity, inflammation, atherosclerosis, diabetes, and cancer.
The overall hypothesis of this report is that high levels of circulating cathepsin S, is a biomarker that reflects pathology induced by inflammation and obesity. The overall aim of this report was to investigate possible associations between circulating cathepsin S, inflammation, glucometabolic disturbance, and its associated diseases in the community. As cathepsin S appears to be a novel risk marker for several pathological conditions, we also wanted to examine the effect of dietary intervention on circulating cathepsin S concentrations.
This thesis is based on data from three community-based cohorts, the Uppsala longitudinal study of adult men (ULSAM), the prospective investigation of the vasculature in Uppsala seniors (PIVUS), and a post-hoc study from the randomized controlled NORDIET trial.
In the first study, we identified a cross-sectional positive association between serum cathepsin S and two markers of cytokine-mediated inflammation, CRP and IL-6. These associations were similar in non-obese individuals. In longitudinal analyses, higher cathepsin S at baseline was associated with higher CRP and IL-6 levels after six years of follow-up. In the second study, we identified a cross-sectional association between increased serum levels of cathepsin S and reduced insulin sensitivity. These associations were similar in non-obese individuals. No significant association was observed between cathepsin S and insulin secretion. In longitudinal analysis, higher cathepsin S levels were associated with an increased risk of developing diabetes during the six-year follow-up. In the third study, we found that higher serum levels of cathepsin S were associated with increased mortality risk. Moreover, in the ULSAM cohort, serum cathepsin S was independently associated with cause-specific mortality from cardiovascular disease and cancer. In the fourth study, we identified that adherence to an ad libitum healthy Nordic diet for 6 weeks slightly decreased the levels of plasma cathepsin S in normal or marginally overweight individuals, relative to the control group. Changes in circulating cathepsin S concentrations were correlated with changes in body weight, LDL-C, and total cholesterol.
Conclusion: This thesis shows that circulating cathepsin S is a biomarker that independently reflects inflammation, insulin resistance, the risk of developing diabetes, and mortality risk. Furthermore, a Nordic diet moderately reduced cathepsin S levels in normal-weight and overweight men and women. This effect may be partially mediated by diet-induced weight loss and possibly by reduced LDL-C concentrations.
Keywords: epidemiology, cathepsin S, inflammation, insulin resistance, diabetes, mortality,
cardiovascular mortality, cancer mortality, healthy Nordic diet.
Elisabeth Jobs, Department of Public Health and Caring Sciences, Box 564, Uppsala University, SE-75122 Uppsala, Sweden.
© Elisabeth Jobs 2014 ISSN 1651-6206 ISBN 978-91-554-9083-6
LIST OF PAPERS
This thesis is based on the following papers, which are referred to in the text by their Roman numerals.
I. Jobs E, Risérus U, Ingelsson E, Helmersson J, Nerpin E, Jobs M,
Sund-ström J, Lind L, Larsson A, Basu S, Ärnlöv J. Serum cathepsin S is as-sociated with serum C-reactive protein and interleukin-6 independently of obesity in elderly men. The Journal of Clinical Endocrinology and Metabolism 2010; 95:4460-4.
II. Jobs E, Risérus U, Ingelsson U, Sundström J, Jobs M, Nerpin E, Iggman
D, Basu S, Larsson A, Lind L, Ärnlöv J. Serum cathepsin S is associated with decreased insulin sensitivity and the development of diabetes type 2 in a community based cohort of elderly men. Diabetes Care 2012; 36:163-5.
III. Jobs E, Ingelsson E, Risérus U, Nerpin E, Jobs M, Sundström J, Basu S,
Larsson A, Lind L, Ärnlöv J. Association between serum cathepsin S and mortality in older adults. JAMA 2011; 14:306:1113-21.
IV. Jobs E, Adamsson V, Larsson A, Jobs M, Nerpin E, Ingelsson E, Ärnlöv
J, Risérus U. Influence of a prudent diet on circulating cathepsin S in humans. Nutrition Journal 2014; 16;13:(1):84.
The papers have been reprinted with permission from the respective publish-ers.
Contents
Introduction ... 9
Cathepsin S ... 9
The role of cathepsin S in disease ... 9
Cathepsin S, obesity, and inflammation ... 10
Hypothesis and aims ... 11
Specific aims: ... 11
Paper I: ... 11
Paper II: ... 11
Paper III: ... 11
Paper IV: ... 12
Subjects and methods ... 13
The ULSAM cohort ... 13
The PIVUS cohort ... 13
The NORDIET trial ... 14
Study participants ... 14
Study I ... 14
Study II ... 15
Study III ... 15
Study IV ... 15
Follow-up and outcome ... 15
Clinical and metabolic investigations ... 16
Ethics ... 19 Statistical analysis ... 19 Study I ... 19 Study II ... 19 Study III ... 20 Study IV ... 20 Results ... 22 Study I ... 23 Study II ... 24 Study III ... 25 Study IV ... 27
Discussion ... 29 Principal findings ... 29 Study I ... 29 Study II ... 29 Study III ... 29 Study IV ... 30 Possible mechanisms ... 30
Strengths and limitations (Papers I, II, III, and IV) ... 33
Clinical implications ... 34
Cathepsin S as a marker of risk-future perspectives ... 34
Conclusions ... 37
Summary in swedish Sammanfattning på svenska ... 38
Acknowledgements in Swedish Tack på svenska ... 40
Abbreviations
BMI Body mass index
CI Confidence interval
Clamp CNS
Euglycemic hyperinsulinemic clamp Central nervous system
CRP C-reactive protein CV Coefficient of variation CVD Cardiovascular disease DBP DXA DNA ECM ECG EIR ELISA HDL-C HOMA HR IFN-γ IL-6 LDL-C MHC ND OGTT OR PIVUS SD SBP TNF-α TGs ULSAM WC
Diastolic blood pressure Dual-energy X-ray absorption Deoxyribonucleic acid Extracellular matrix Electrocardiogram Early insulin response
Enzyme-linked immunosorbent assay High-density lipoprotein cholesterol Homeostasis model assessment Hazard ratio
Interferon gamma Interleukin-6
Low-density lipoprotein cholesterol Major histocompatibility complex Healthy Nordic diet
Oral glucose tolerance test Odds ratio
Prospective investigation of the vasculature in Uppsala seniors
Standard deviation Systolic blood pressure Tumor necrosis factor-alpha Triglycerides
Uppsala longitudinal study of adult men Waist circumference
Introduction
Cathepsins, or lysosomal cysteine proteases, were discovered in the first half of the twentieth century, and they are responsible for a number of important
cellular processes.1 The term cathepsin originates from the Greek word for
digestion, and it reflects that cathepsins are proteases that break down other proteins. There are three different cathepsin families based on the activity of the proteases: the cysteine/papain family, the serine family, and the aspartic family. There are 15 known cathepsins expressed from the human genome,
and 11 of these, including cathepsin S, belong to the cysteine family.2
Cys-teine cathepsins have a broad spectrum of functions in almost all cell types. They act as housekeeping enzymes, but they also have specific and directed
proteolytic functions.3 The activity of cathepsins is optimal in the slightly
acidic, reducing milieu found in lysosomes.1
Cathepsin S
Cathepsin S is a potent protease, and in contrast to the other cathepsins, it is
active and stable at neutral pH.4-6 Cathepsin S activity is regulated by the
endogenous inhibitor cystatin C.7 Cathepsin S is highly expressed in the
spleen and by antigen-presenting cells including B lymphocytes,
macro-phages, dendritic cells, and epithelial cells.8-11 It is also found in various
other tissues such as atherosclerotic lesions12 and adipose tissue.13
The protease activity is used for both intracellular and extracellular
prote-olysis.14 Cathepsin S has an important function in antigen processing and
presentation.15,16 The major histocompatibility complex (MHC) class II
dis-plays antigenic peptides on the cell surface for recognition by CD4+ T cells. For this process, proteolysis by cathepsin S is required, both for degradation of invariant chain complexes to allow subsequent binding of peptides and for
generation of antigen presentation.17 In extracellular matrix (ECM)
remodel-ing, cathepsin S degrades elastin, fibronectin, laminin, and collagens,18-20 to
enable cell migration during, for example, wound healing3 or angiogenesis.21
The role of cathepsin S in disease
Increased cathepsin S activity has been suggested to be involved in the un-derlying pathophysiology of a number of different autoimmune,
inflamma-tory, and neurological diseases.22,23 Cathepsin S has also been linked to
metabolic disturbances such as obesity,24 diabetes,25,26 and dyslipidemia.27
There is experimental data to suggest that there is a close interplay between
cathepsin S and inflammatory activity.16 Higher serum levels of cathepsin S
are observed in patients with cardiovascular disease (CVD) such as athero-sclerotic stenosis, acute or previous myocardial infarction, unstable angina
pectoris,25 or increased plasma low-density lipoprotein cholesterol
(LDL-C).12 Several studies have suggested that cathepsin S activity is increased in
the advancement of atherosclerotic plaques and the weakening of advanced plaques.12,20,25,28-32
In addition, cathepsin S also appears to be involved in the development of
cancer and metastasis.33,34
Cathepsin S, obesity, and inflammation
A few studies have shown that serum cathepsin S levels are elevated in
obese subjects, and that weight loss reduces these levels.24,35 It has also been
shown that cathepsin S is highly expressed in white adipose tissue.13 Obesity
is a well-known contributory factor in several diseases as well as it leads to increased morbidity, caused by a number of disorders such as, for example, insulin resistance, CVD, and cancer. Obesity-related diseases share similar pathophysiological mechanisms, mainly due to the actions of
proinflamma-tory cytokines, which are released from adipose tissue.36
Many studies have suggested a causal interplay between increased
cathepsin S activity and increased inflammatory activity.11,13,37-40 and it has
been demonstrated that increased levels of cathepsin S are associated with higher levels of proinflammatory factors such as C-reactive protein (CRP)
and interleukin-6 (IL-6) in obese women.24
Interestingly, cathepsin S has been suggested to be the mechanistic link between obesity and cardiovascular disease, possibly mediated by
inflamma-tory pathways.31,41
The pathophysiological role of cathepsin S activity is mainly based on experimental studies such as immunohistochemical colocalization experi-ments and studies in cathepsin S-deficient mice. Our understanding of what circulating levels of cathepsin S mean is poor. More interventional and ob-servational data in humans are needed. For example, there are no data from community-based studies.
Furthermore, as cathepsin S appears to be a promising new marker of the risk of developing many pathological conditions, it is important to determine whether it would be possible to decrease circulating levels of cathepsin S— not only by pharmacological treatment, but also by changes in lifestyle such as a healthy diet.
Hypothesis and aims
Based on previous experimental and clinical studies, the overall hypothesis of this thesis is that high levels of circulating cathepsin S could be used as a biomarker that reflects pathology induced by inflammation and obesity. Thus, the overall aim of this work was to investigate possible associations between circulating cathepsin S, inflammation, glucometabolic disturbance, and its associated diseases in the community. As cathepsin S appears to be a promising new risk marker of several pathological conditions, we also wanted to examine the effect of dietary intervention on circulating cathepsin S concentrations.
Specific aims:
Paper I:
To investigate associations between serum levels of cathepsin S and two circulating markers for cytokine-mediated inflammation, CRP and IL-6, in the Uppsala longitudinal study of adult men (ULSAM) cohort, with sub-group analyses in non-obese participants.
Paper II:
To investigate associations between serum levels of cathepsin S in individu-als with impaired insulin sensitivity or defective insulin secretion, and the development of type-2 diabetes, in the ULSAM cohort.
Paper III:
To investigate associations between serum levels of cathepsin S and the risk of total mortality, both in the ULSAM cohort and in the prospective investi-gation of the vasculature in Uppsala seniors (PIVUS) cohort. A secondary aim was to investigate associations between cathepsin S and cause-specific deaths from cardiovascular disease and cancer.
Paper IV:
To investigate the effect of a healthy Nordic diet (ND), eaten ad libitum, on plasma levels of cathepsin S, in a controlled dietary intervention (post-hoc analyses of the NORDIET trial). A secondary aim was to investigate rela-tionships between changes in cathepsin S concentrations and changes in cardiometabolic risk factors (i.e. weight, insulin sensitivity, triglycerides
(TGs), LDL-C,high-density lipoprotein cholesterol (HDL-C), systolic blood
Subjects and methods
Papers I, II, and III were based on data from the Uppsala longitudinal study of adult men (ULSAM). Paper III also included data from the prospective investigation of the vasculature in Uppsala seniors cohort (PIVUS). Paper IV was a post-hoc study, based on data from the randomized controlled NORDIET trial.
The ULSAM cohort
ULSAM is an ongoing longitudinal cohort study, which was initiated be-tween 1970 and 1973. All fifty-year-old men born bebe-tween 1920 and 1924, living in the county of Uppsala, Sweden, were invited to a health survey,
focusing on identification of cardiovascular risk factors.42 Of the 2,841 men
invited, 2,322 (82%) chose to participate. The men were re-investigated at the ages of 60 (2130 invited, 1,860 (87%) participated), 70 (1681 invited, 1,221 (73%) participated), 77 (1398 invited, 839 (60%) participated), 82 (971 invited, 530 (56%) participated), and 88 (613 invited, 354 (58%) par-ticipated).
The screening examination program included a medical questionnaire and interview, sampling of blood and urine, blood pressure and anthropometric measurements, intravenous glucose tolerance test, and electrocardiogram (ECG) recording. Data on hospital discharge diagnosis and cause of death were obtained from national registers.
The PIVUS cohort
All 70-year-old people of the county of Uppsala, Sweden, between 2001 and
2004, were invited to participate in the PIVUS.43 Of the 2,025 subjects
in-vited, 1,016 (50%) chose to participate and 51% of them were women. The main aim of the study was to investigate different measurements of endothe-lial function and arterial compliance. The study also included measurements of cardiac function and structure, evaluation of atherosclerosis by ultrasound and magnetic resonance imaging (MRI), recording of seven-day food intake, detailed electrocardiogram, ECG analysis, measurement of cardiovascular autonomic function, analysis of body composition by dual-energy X-ray absorptiometry (DXA), deoxyribonucleic acid (DNA) analysis, and
meas-urement of lung function, as well as measmeas-urement of a number of
biochemi-cal markers.43
The NORDIET trial
During December 2007, subjects living in Bollnäs, Sweden, were recruited by advertisements in the local newspaper. This randomized controlled die-tary intervention study was conducted between February and May, 2008. The inclusion criteria were healthy (as assessed by a physician) men and women between 25 and 65 years of age, plasma LDL-C ≥ 3.5 mmol/L, body mass index (BMI) ≥ 20 and ≤ 31 kg/m² for women and men, respectively. Subjects with hypertension and those on lipid-lowering drugs were excluded. After screening of 212 subjects, 88 subjects (54 women (63%) and 34 men (37%)) were included in the study, and only two subjects were lost to fol-low-up, providing 86 subjects for analysis.
The subjects were randomly assigned to one of two groups: the Nordic diet group (44 subjects included: 27 women and 17 men) or the control group (42 subjects included: 27women and 15 men). Clinical and laboratory
assess-ments were performed at baseline and after 6 weeks.44
The ND was based on the Nordic nutrition recommendations45 and
con-tained characteristic foods used in Nordic countries including fruit (e.g. ap-ples), berries (e.g. blueberries), legumes, vegetables, low-fat dairy products, and fatty fish (e.g. salmon). The ND also included LDL-C-lowering foods
(e.g. oats, barley, almonds, and psyllium seeds).46,47 The ND was provided
ad libitum. The subjects in the control group were instructed to follow their habitual diet, eaten ad libitum, and to continue their usual physical activi-ties.44
Study participants
We used ULSAM data from the third examination cycle (1991–1995, mean age 71, n = 1,221), in studies I, II, and III. In study III, we also used data from the first examination cycle of the PIVUS cohort (2001–2004, mean age 70 years, n = 1,016, 51% women). In study IV, we used data from the first examination cycle of the NORDIET cohort (2008, mean age 53 years, n = 86, 63% women and 37% men).
Study I
ULSAM: We excluded 230 men for the following reasons: unavailable cathepsin S data (n = 98), unavailable CRP data (n = 24), unavailable
covari-ates (n = 108). The present study sample comprised 991 individuals, and of these, IL-6 data were available for 969 participants.
Follow-up data from the fourth examination cycle (1998–2002, mean age 77) were available for 627 participants regarding analysis of CRP and 608 participants regarding analysis of IL-6.
Study II
ULSAM: We excluded 60 men due to diagnosis of diabetes at baseline, and 256 men for the following reasons: unavailable cathepsin S data (n = 89), unavailable data from the euglycemic hyperinsulinemic clamp (n = 37), and unavailable data for other covariates (n = 130). This left 905 men in the study sample.
Follow-up data on diabetes status at the fourth examination cycle (1998– 2002, mean age 77) were available for 597 participants.
Study III
ULSAM: We excluded 212 men due to missing data on cathepsin S (n = 98) or other covariates (n = 114), leaving 1,009 participants in the study sample. Median follow-up was 12.6 years (with end of follow-up in 2006); 413 par-ticipants had died.
PIVUS: We excluded 29 individuals due to missing data on cathepsin S (n = 13) or other covariates (n = 16), leaving 987 participants in the study sample (baseline period: 2001–2004). Of these, 489 participants (50%) were women. Median follow-up was 7.9 years (with end of follow-up in 2010); 100 participants had died.
Study IV
NORDIET: Two subjects (one in each group) had dropped out,44 leaving 86
subjects with data on cathepsin S. After randomization, the two groups were almost identical with regard to baseline characteristics, with the exception of a statistically significant difference in cathepsins S levels between groups.
Follow-up and outcome
In study III, the Swedish cause-of-death register was used to define total mortality, cardiovascular mortality (death from ischemic heart disease or cerebrovascular disease; International Classification of Diseases, Ninth Re-vision [ICD-9] codes 410-414, 430-438 or International Statistical
Classifi-cation of Diseases, 10th Revision [ICD-10] codes I20-I25, I60-I69/G45), and cancer mortality (ICD-9 codes 140-239 and ICD-10 codes C00-D48). Data on cause-specific mortality was not available in the PIVUS cohort.
Clinical and metabolic investigations
The measurements in ULSAM, PIVUS, and NORDIET were performed under standardized conditions and have been described previously in
detail.42-44 The investigations in the ULSAM and PIVUS studies were
per-formed using the same questionnaires regarding socioeconomic status,
medi-cal history, and use of medications.43,48 In the NORDIET trial, a case report
form for each subject was completed by a nurse, including medication-related information. Medication was not allowed if they were treating some
of the risk factors that were included in the study. Smoking was allowed.44
Blood samples
Blood samples were collected in the morning after overnight fasting. Venous blood samples were drawn at baseline and were stored at –70°C until analy-sis (freezer time: ULSAM, 14.6 years (range 12.9–16.7 years); and PIVUS, 5.5 years (range 3.9–7.2 years).
In NORDIET trial, blood samples were collected from January to May, 2008. They were analyzed gradually, depending on the different aims in the studies.
Cathepsin S
In all studies, serum cathepsin S was measured by enzyme-linked immu-nosorbent assay (ELISA) (human cathepsin S (total); DY1183; R&D Sys-tems, Minneapolis, MN). The intra-assay coefficient of variation (CV) was 7%.
Inflammatory markers
ULSAM: High-sensitivity CRP measurements were performed with latex-enhanced reagent (Dade Behring, Deerfield, IL) using a Behring BN ProSpec analyzer (Dade Behring) and IL-6 was analyzed by an ELISA kit
(IL-6 HS; R&D Systems) as previously described.49 The intra-assay CV of
the CRP method was 1.4% at both 1.23 mg/L and 5.49 mg/L, and the CV for the IL-6 method was 7%.
PIVUS: CRP was measured in human serum by an ultra-sensitive parti-cle-enhanced immunoturbidimetric assay (Orion Diagnostica, Espoo, Finland) on a Konelab 20 autoanalyser (Thermo Clinical Labsystems, Espoo, Finland). The inter-assay CV was 3.2%.
NORDIET: CRP was measured by an immunological particle-enhanced reaction developed by Roche Diagnostics, using the Cobas® 6000 analyzer.
Cholesterol and triglycerides
ULSAM and PIVUS: Cholesterol and triglyceride concentrations were ana-lyzed in serum and in the isolated lipoprotein fractions by routine analysis at the central laboratory of Uppsala University Hospital.
NORDIET: Total cholesterol, TGs, and HDL-C plasma concentrations were measured using a Roche Diagnostics Cobas® 6000 and plasma LDL-C
was calculated by the Friedewald formula.50
Glucose
ULSAM: Plasma glucose and samples from oral glucose tolerance test (OGTT) were measured by the glucose dehydrogenase method Gluc-DH (Merck, Darmstadt, Germany). The intra-individual CV for fasting plasma glucose was 3.2%.
PIVUS: Blood glucose was analyzed by routine analysis at the central laboratory of Uppsala University Hospital.
NORDIET: Plasma glucose was measured by UV test, an enzymatic hexokinase reference method developed by Roche Diagnostics using the Cobas® 6000 analyzer.
Blood pressure
ULSAM: Blood pressure was measured with a calibrated mercury sphyg-momanometer, to the nearest even mmHg after at least 10 minutes of rest, and the average of two recordings was used.
PIVUS: Blood pressure was measured three times after at least 30 min of rest using a calibrated mercury sphygmomanometer, and the mean was used for analysis.
NORDIET: Blood pressure was measured manually in a sitting position after 5 minutes of rest. Two measurements were performed with an interval of 2 minutes, and the average value was calculated.
Hypertension was defined as use of anti-hypertensive medication or having an SBP of ≥ 140 mmHg or DBP of ≥ 90 mmHg.
Anthropometric assessments
Height was measured to the nearest whole cm, without any shoes. Weight was measured to the nearest 0.1 kg. BMI was calculated as body weight (kg) divided by height (m) squared. Waist circumference (WC) was measured in the supine position. The waist was measured midway between the lowest rib and the iliac crest.
Physical activity
ULSAM and PIVUS: Physical activity was reported on a standardized ques-tionnaire. Leisure-time physical activity was assessed using the following questions: (1) Do you spend most of your time reading, watching television,
going to the cinema, or engaging in other, mostly sedentary activities? (2) Do you often go walking or cycling for pleasure? (3) Do you engage in any active recreational sports or heavy gardening for at least 3 hours every week? (4) Do you regularly engage in hard physical training or competitive sport? The highest positive physical activity response level was used for each participant. Education level was stratified as low (elementary school, 6–7 years), medium (high school), or high (college studies). Smoking status was based on interview reports performed by a nurse.
Outcomes
ULSAM: Previous CVD at baseline was defined as a history of ischemic heart disease or cerebrovascular disease, Q or QS complexes, or left bundle-branch block on baseline ECG. Diabetes mellitus was diagnosed as fasting plasma glucose ≥ 7.0 mmol/L (≥ 126 mg/dL), 2-h post glucose level > 11.1 mmol/L (> 200 mg/dL), or by the use of oral hypoglycemic agents or insulin.
PIVUS: Diabetes mellitus was defined as fasting blood glucose ≥ 6.1 mmol/L (≥ 110 mg/dL) or self-reported diagnosis of diabetes.
The euglycemic-hyperinsulinemic clamp technique (Clamp)
ULSAM: The Clamp technique according to de Fronzo51 was used, with a
slight modification to suppress hepatic glucose production,52 for estimation
of in vivo sensitivity to insulin. Insulin (Actrapid Human; Novo, Copenha-gen, Denmark) was infused in a primary dose for the first 10 min and then as
a continuous infusion (56 mU/min per body surface area in m2, for 2 hours to
maintain steady-state hyperinsulinemia). The target plasma glucose level was 5.1 mmol/L, maintained by measuring plasma glucose every 5 minutes. The glucose infusion rate during the last hour was used as a measure of insu-lin sensitivity (M-value) and is given in mg/kg body weight/min.
Homeostasis model assessment-insulin resistance (HOMA-IR)
PIVUS and NORDIET: HOMA-IR was calculated as (insulin ×
glu-cose)/22.5.53
Oral glucose tolerance test (OGTT)
ULSAM: OGTT was performed by measuring the concentrations of plasma glucose and insulin immediately before and 120 min after ingestion of 75 g anhydrous dextrose. Beta-cell function was estimated by the early insulin
response (EIR): ([insulin30 min] − [insulin0 min]) / ([glucose30 min] − [glucose0
min]). The OGTT and the Clamp procedure were performed at least 1 week
Ethics
ULSAM, PIVUS, and the NORDIET study were approved by the Ethics Committee of the University of Uppsala. The participants gave written in-formed consent before entering the study. The NORDIET trial was con-ducted in accordance with the CONSORT statement and registered in the Current Controlled Trials database (http://www.controlled-trials.com), inter-national standard randomized controlled trial number (ISRTCTN): 77759305.
Statistical analysis
Study I
Skewed variables (CRP and IL-6) were logarithmically transformed to achieve a normal distribution. Linear regression analyses were used to assess the cross-sectional associations between cathepsin S (independent variable), CRP, and IL-6 (dependent variables in separate models). The following models were used:
- Model A: adjusted for age
- Model B: adjusted for age and BMI
- Model C: adjusted for age, BMI, fasting plasma glucose, diabetes treatment, SBP, DBP, hypertension treatment, serum cholesterol, se-rum HDL-C, previous CVD, smoking, and leisure-time physical ac-tivity.
In our primary analysis, we modeled cathepsin S, CRP, and IL-6 as continu-ous variables, expressed as a 1-standard deviation (SD) increase. We also performed the above analyses in subsamples with non-obese participants, BMI < 30 kg/m² (n = 874), and in normal-weight participants, BMI < 25 kg/m² (n = 375).
We also analyzed the longitudinal association between cathepsin S at baseline and CRP and IL-6 at a re-investigation after six years. In these lin-ear regression analyses, the above three models were used with the addition of age at the re-investigation in all models.
Study II
Logarithmic transformation was performed to achieve a normal distribution of skewed variables (EIR, TGs, cystatin C, CRP, and IL-6). Linear regres-sion analyses were used to assess the cross-sectional associations between cathepsin S (independent variable), insulin sensitivity (dependent variable), and insulin secretion (dependent variable) in separate models. The following primary models were used:
- Model A: adjusted for age
- Model B: adjusted for age, BMI, and WC
- Model C: adjusted for age, CRP, IL-6, and adiponectin - Model D: models A, B, and C combined
We also used a secondary model (model E: model D + TGs, previous CVD, and cystatin C). In our analysis, we modeled cathepsin S, insulin sensitivity, and insulin secretion as continuous variables expressed as a 1-SD increase. We also performed the above analyses in a sub-sample with non-obese par-ticipants, BMI < 30 kg/m² (n = 805).
We used logistic regression analyses to investigate the longitudinal asso-ciation between cathepsin S at baseline and the development of diabetes at a re-investigation after six years. The same multivariable models as defined above (models A–D) were used in these analyses.
Study III
ULSAM: Logarithmic transformation was done to achieve normal distribu-tion for skewed variables (CRP and cystatin C). The associadistribu-tions of serum level of cathepsin S with total, cardiovascular, and cancer mortality were investigated using Cox proportional-hazards regression and three multivari-able models:
- Model A: adjusted for age
- Model B: adjusted for lifestyle factors (age, BMI, smoking status, leisure-time physical activity, and education level)
- Model C: adjusted for cardiovascular risk factors (age, SBP, diabe-tes, smoking status, BMI, total cholesterol, HDL-C, anti-hypertensive treatment, lipid-lowering treatment, and previous CVD)
In our primary analyses, we modeled cathepsin S as a continuous variable (expressed as a 1-unit increase in serum cathepsin S). We also performed threshold models (quintile 5 vs. quintiles 1–4).
PIVUS: We investigated the association between serum cathepsin S and total mortality in the PIVUS cohort using a similar protocol for the statistical analyses.
Study IV
NORDIET: Data are presented as mean ± SD. Per-protocol analysis was used to assess effects of diet on outcome measures. Unpaired t-test was used to assess differences in plasma levels of cathepsin S during follow-up be-tween the two groups, and as a second step, ANCOVA was used to adjust
for sex, weight, and cardiometabolic risk factors. To assess associations be-tween change in cathepsin S and change in cardiometabolic risk factors, linear regression and Pearson’s correlation was used.
A two-sided p-value of < 0.05 was regarded as significant in all analyses in studies I, II, III and IV. The statistical software package STATA 11.0 (Stata Corp., College Station, TX) was used for all analyses.
Results
Baseline characteristics for the ULSAM, PIVUS, and NORDIET cohorts are presented in Table 1A and Table 1B.
Table 1A. Baseline characteristics for the ULSAM and PIVUS cohorts (from study III)
Variable Study cohort
ULSAM (n = 1,009) PIVUS (n = 987)
Female, no. (%) 0 (0) 489 (50) Current smoker, no. (%) 204 (20) 106 (11) Diabetes, no. (%) 103 (10) 86 (9) Previous cardiovascular disease, no. (%) 249 (25) 191 (19) Lipid-lowering treatment, no. (%) 101 (10.0) 157 (16) Anti-hypertensive treatment, no. (%) 361 (36) 306 (31) Leisure-time physical activity
-Sedentary, no. (%) 41 (4) 108 (11) -Moderate, no. (%) 343 (34) 569 (59) -Regular, no. (%) 566 (56) 216 (23) -Athletic, no. (%) 59 (6) 67 (7) Education/Social status -High, no. (%) 147 (15) 244 (25) -Middle, no. (%) 301 (30) 177 (18) -Low, no. (%) 561 (56) 555 (57) Mean ± SD Age, years 71.0 ± 0.7 70 ± 0.2 Body mass index, kg/m2 26.2 ± 3.4 27.0 ± 4.3
Serum cathepsin S, μg/L 18.2 ± 3.8 19.2 ± 5.8 Serum total cholesterol, mmol/L 5.8 ± 1.0 5.4 ± 1.0 Serum HDL-C, mmol/L
Serum LDL-C, mmol/L 1.3 ± 0.3 3.9 ± 0.9 1.5 ± 0.4 3.4 ± 0.9 Fasting plasma glucose, mmol/L 5.8 ± 1.5 5.4 ± 1.6 Systolic blood pressure, mmHg 147±19 150 ± 23 Diastolic blood pressure, mmHg 84 ± 9 79 ± 10 Serum cystatin C, mg/L 1.2 ± 0.3 0.9 ± 0.2
Median (25th–75th percentile)
Serum C-reactive protein, mg/L 1.9 (0.9–3.9) 1.2 (0.6–2.3) Serum IL-6, ng/L 3.5 (2.2–5.8) 4.2 (2.2–14.8) Serum IL-8, ng/L NA 6.4 (4.6–9.3) Serum IL-10, ng/L NA 0.4 (0.4–0.8) Serum IL-1β, ng/L NA 0.6 (0.5–1.4) INF-γ, ng/L NA 1.6 (1.1–2.5) TNF, ng/L NA 3.7 (2.9–4.9)
ULSAM data are from the third examination cycle (1991-1995). PIVUS data are from the first examina-tion cycle (2001-2004). HDL-C: High-density lipoprotein cholesterol; LDL-C: Low-density lipoprotein cholesterol; IL: interleukin; INF-γ: interferon gamma; TNF: tumor necrosis factor.
Table 1B. Baseline characteristics for the NORDIET study after randomization
Characteristics Control group Healthy Nordic diet p-value
Subjects, n 42 44
Age, years 53.4 ± 8.1 52.6 ± 7.8 0.63
Men/women 15/27 17/27 0.83
Body weight, kg 78.0 ± 13.3 76.0 ± 10.5 0.44 Body mass index, (kg/m2) 26.5 ± 3.3 26.3 ± 3.2 0.79
SBP, mmHg 123 ± 14 128 ± 12 0.50
DBP, mmHg 83 ± 9 81 ± 7 0.16
Plasma TGs, mmol/L 1.4 ± 0.8 1.6 ± 0.8 0.32 Plasma cholesterol, mmol/L 6.4 ± 0.7 6.2 ± 0.8 0.36 Plasma LDL-C, mmol/L 4.2 ± 1.0 4.0 ± 0.6 0.33 Plasma HDL-C, mmol/L 1.5 ± 0.5 1.5 ± 0.4 0.28 LDL/HDL ratio 2.8 ± 1.0 2.9 ± 0.8 0.80 Plasma glucose, mmol/L 4.9 ± 0.6 4.9 ± 0.5 0.54 Insulin resistance (HOMA-IR) 1.3 ± 0.6 1.2 ± 0.6 0.47 Cathepsin S, µg/L 18.3 ± 3.0 20.1 ± 4.1 0.02
Data are means ± SD. Data are from the first examination cycle (2008). HDL-C: High-density lipoprotein cholesterol; LDL-C: Low-density lipoprotein cholesterol; HOMA-IR: homeostasis model assessment-insulin resistance; SBP: systolic blood pressure; DBP: diastolic blood pressure; TGs: triglycerides. Dif-ferences between the healthy Nordic diet group and the control group were assessed using unpaired two-tailed t-tests.
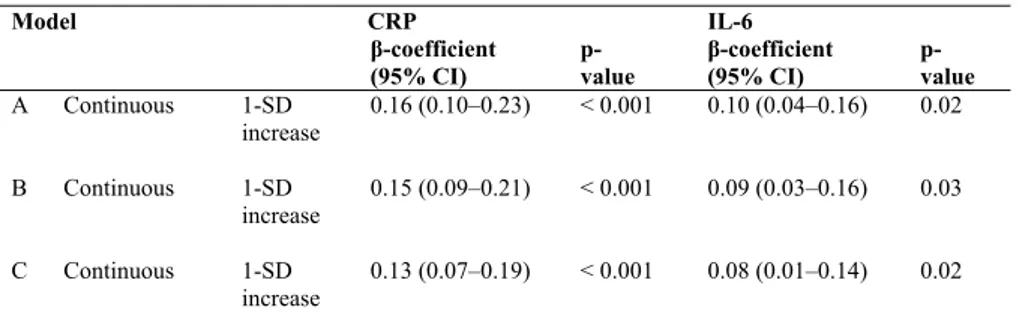
Study I
Cross-sectional association between cathepsin S, CRP, and IL-6 at age 70
A 1-SD higher serum cathepsin S value was significantly associated with a 0.13 - 0.16 SD higher serum CRP level and a 0.08 - 0.10-SD higher serum IL-6 level (models A–C, Table 2).
These associations were similar in non-obese participants (BMI < 30
kg/m2) and in normal-weight individuals (BMI < 25 kg/m2).
Table 2. Cross-sectional associations between cathepsin S, C- reactive protein (CRP), and interleukin 6 (IL-6) at age 70: multivariable regression
Model CRP IL-6 β-coefficient (95% CI) p- value β-coefficient (95% CI) p-value A Continuous 1-SD increase 0.16 (0.10–0.23) < 0.001 0.10 (0.04–0.16) 0.02 B Continuous 1-SD increase 0.15 (0.09–0.21) < 0.001 0.09 (0.03–0.16) 0.03 C Continuous 1-SD increase 0.13 (0.07–0.19) < 0.001 0.08 (0.01–0.14) 0.02
Data are regression coefficients and 95% confidence intervals. Regression coefficients are expressed as standard deviations of cathepsin S, lnCRP, and lnIL-6. Model A was adjusted for age; model B was adjusted for age and BMI; model C was adjusted for age, BMI, fasting glucose, diabetes treatment, sys-tolic blood pressure, diassys-tolic blood pressure, hypertension treatment, total cholesterol, HDL cholesterol, previous cardiovascular disease, smoking, and leisure-time physical activity. CRP data: n = 991. IL-6 data: n = 969.
Longitudinal association between cathepsin S at age 70 and CRP and IL-6 at age 77
A 1-SD higher serum cathepsin S value at age 70 was significantly associ-ated with a 0.11 - 0.13-SD higher serum CRP level (models A–C, Table 3) and a 0.08 - 0.09-SD higher serum IL-6 level at age 77 (models A and B, Table 3).
Table 3. The longitudinal association between cathepsin S at age 70 and C-reactive protein (CRP) and interleukin-6 (IL-6) at age 77: multivariable regression
Model CRP IL- 6 β-coefficient (95% CI) p- value β-coefficient (95% CI) p- value A Continuous 1-SD increase 0.13 (0.05–0.21) 0.001 0.09 (0.01–0.17) 0.02 B Continuous 1-SD Increase 0.12 (0.05–0.20) 0.002 0.08 (0.01–0.16) 0.04 C Continuous 1-SD Increase 0.11 (0.03–0.19) 0.005 0.06 (-0.02–0.14) 0.14
Data are regression coefficients and 95% confidence intervals. Regression coefficients are expressed as standard deviations of cathepsin S, lnCRP, and lnIL-6. Model A was adjusted for age; model B was adjusted for age and BMI; model C was adjusted for age, BMI, fasting glucose, diabetes treatment, sys-tolic blood pressure, diassys-tolic blood pressure, hypertension treatment, cholesterol, HDL-C, previous cardiovascular disease, smoking, and leisure-time physical activity. CRP data: n = 627. IL-6 data: n = 608.
Study II
Cross-sectional association between cathepsin S and insulin sensitivity
In multivariable linear regression models, higher serum cathepsin S was significantly associated with reduced insulin sensitivity (glucose disposal rate, M) in all models (models A–E, Table 4). Moreover, the associations were essentially similar in non-obese individuals (BMI < 30 kg/m²) (Table 4).
Cross-sectional association between cathepsin S and early insulin response
We also investigated cross-sectional association between cathepsin S and EIR, but we did not find any significant association in any of our models (A–E) or in the subgroup with participants with BMI < 30 kg/m² (Table 4).
Table 4. Cross-sectional associations between cathepsin S, insulin sensitivity, and early insulin response
Model Total cohort BMI < 30
Insulin sensitivity (M-value)* β-coefficient (95% CI) p- value β-coefficient (95% CI) p- value Model A -0.13 (-0.19 to -0.06) < 0.001 -0.12 (-0.18 to -0.05) < 0.001 Model B -0.09 (-0.14 to -0.04) < 0.001 -0.10 (-0.15 to -0.04) 0.001 Model C -0.10 (-0.16 to -0.03) 0.001 -0.10 (-0.16 to -0.03) 0.003 Model D -0.09 (-0.14 to -0.04) 0.001 -0.09 (-0.14 to -0.03) 0.002 Model E -0.06 (-0.11 to -0.01) 0.02 -0.06 (-0.11 to -0.00) 0.03 EIR** Model A -0.01 (-0.07 to 0.06) 0.82 -0.01 (-0.08 to 0.05) 0.68 Model B -0.02 (-0.08 to 0.05) 0.58 -0.02 (-0.08 to 0.05) 0.61 Model C -0.01 (-0.08 to 0.05) 0.71 -0.02 (-0.09 to 0.05) 0.55 Model D -0.02 (-0.08 to 0.05) 0.59 -0.02 (-0.09 to 0.05) 0.53 Model E -0.02 (-0.09 to 0.04) 0.48 -0.03 (-0.10 to 0.04) 0.44
Data are regression coefficients per 1-SD increase. Multivariable regression. Model A: age; model B: age, BMI, and waist circumference; model C: age, CRP, IL-6, and adiponectin; model D: models A–C com-bined; model E: Model D + triglycerides, previous cardiovascular disease, and cystatin C.
*Insulin sensitivity, n = 905. BMI < 30, n = 805. **Early insulin response, n = 890. BMI < 30, n = 790.
Longitudinal association between cathepsin S and diabetes incidence
At the follow-up after 6 years (n = 597), 41 participants had developed dia-betes. One-SD increase in cathepsin S at baseline was associated with 41– 48% risk of developing diabetes during follow-up in all multivariable mod-els (modmod-els A–E, Table 5).
Table 5. Serum cathepsin S and the risk of developing diabetes
Model Odds ratio (95% CI) p-
value Model A 1.47 (1.09–1.98) 0.01 Model B 1.46 (1.07–1.97) 0.02 Model C 1.48 (1.09–1.99) 0.01 Model D 1.48 (1.09–2.01) 0.01 Model E 1.41 (1.02–1.93) 0.04
Data are odds ratio per 1-SD increase; model A: age at baseline and age at follow-up; model B: age at baseline, age at follow-up, BMI, and waist circumference model C: age at baseline, age at follow-up, CRP, IL-6, and adiponectin; model D: models A–C combined; model E: model D + triglycerides, previ-ous cardiovascular disease, and cystatin C. Number of events/number at risk: 41/597.
Study III
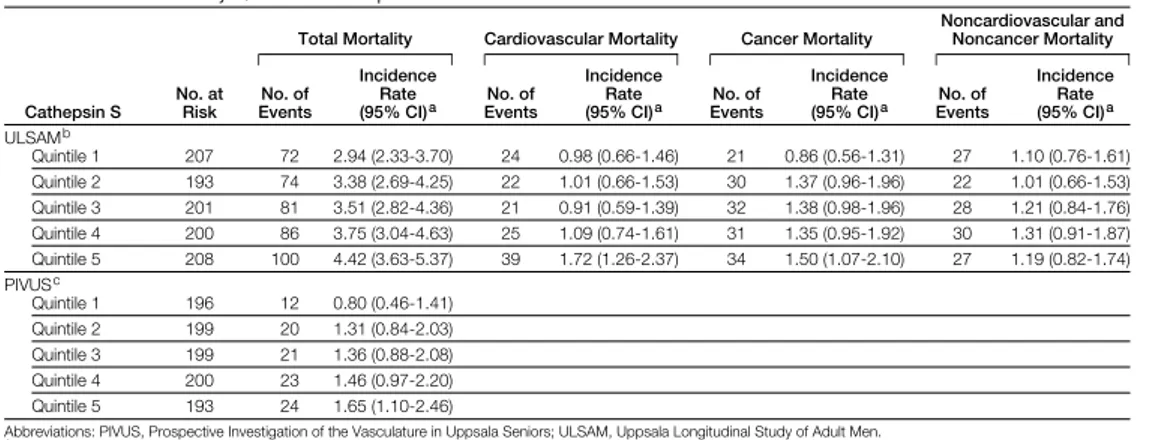
ULSAMIncidence rate for mortality
During up (median 12.6 years; range 0.1–15.3 years; end of follow-up: 2006), 413 participants died (incidence rate: 3.59/100 person years at risk). In total, 131 deaths were due to CVD (incidence rate: 1.14/100 person years at risk) and 148 deaths were due to cancer (incidence rate: 1.29/100 person years at risk).
Cox regression models for total mortality
A 1-unit increase of cathepsin S was associated with 1.04 higher hazard ratio (HR) for total mortality after adjustment for age (model A), lifestyle factors (model B), and established cardiovascular risk factors (model C, Table 6).
In multicategory and threshold models, participants in the highest quintile of cathepsin S, were at higher risk for total mortality compared with partici-pants in quintile 1 through 4, respectively (models A-C, Table 6).
Cox regression models for cardiovascular mortality
In continuous models, a 1-unit increase in cathepsin S was associated with a 5% higher risk of cardiovascular mortality (models A and B, Table 5).
In threshold models, participants in quintile 5 had a 62–82% higher risk of cardiovascular mortality than participants in quintiles 1–4 (models A–C, Table 5).
Cox regression models for cancer mortality
A 1-unit increase in cathepsin S was associated with a 5–6% higher risk of cancer mortality (models A–C, Table 6).
Table 6. Relationship of serum cathepsin S to total, cardiovascular, and cancer mor-tality in the ULSAM cohort: multivariable Cox proportional hazard analysis
Total mortality CVD mortality Cancer mortality
Hazard ratio
(95% CI) p- value Hazard ratio (95% CI) p- value Hazard ratio (95% CI) p- value Continuous
(per unit increase in cathepsin S): Model A 1.04 (1.02–1.07) 0.001 1.05 (1.01–1.10) 0.02 1.06 (1.02–1.10) 0.008 Model B 1.04 (1.02–1.07) 0.001 1.05 (1.00–1.10) 0.03 1.05 (1.01–1.10) 0.01 Model C 1.04 (1.01–1.06) 0.009 1.03 (0.99–1.08) 0.15 1.05 (1.01-1.10) 0.01 Threshold models (Q1–4 vs. Q5): Model A
Q1–Q4* Ref Ref Ref Ref Ref Ref
Q5# 1.38(1.09–1.71) 0.005 1.82(1.25–2.65) 0.002 1.28(0.87–1.87) 0.22
Model B
Q1–Q4* Ref Ref Ref Ref Ref Ref
Q5# 1.33(1.06–1.67) 0.01 1.77(1.22–2.59) 0.003 1.23(0.83–1.81) 0.30
Model C
Q1–Q4* Ref Ref Ref Ref Ref Ref
Q5# 1.31(1.04–1.65) 0.02 1.62(1.11–2.37) 0.01 1.22(0.83–1.81) 0.30
Model A: age-adjusted model; model B: lifestyle model (age, BMI, smoking, leisure-time physical activ-ity, and education level); model C: cardiovascular risk factor model (age, systolic blood pressure, diabe-tes, smoking, BMI, total cholesterol, HDL-C, anti-hypertensive treatment, lipid-lowering treatment, and history of cardiovascular disease), n = 1009.
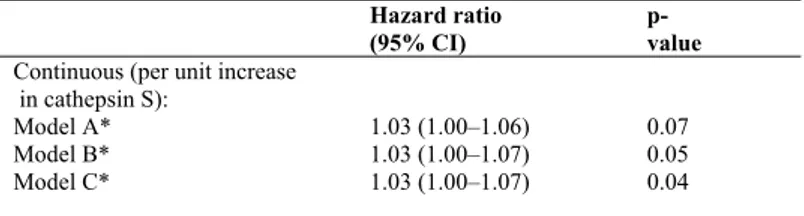
PIVUS
Incidence rate for mortality
During follow-up (median 7.9 years; range 0.3–9.8 years; end of follow-up: 2010), 100 participants died (incidence rate: 1.32/100 person years at risk).
Cox regression models for total mortality
A 1-unit increase in cathepsin S was associated with a 3% higher risk of total mortality in models A–C (Table 7).
Table 7. Relationship of serum cathepsin S to total mortality in the PIVUS cohort: multivariable Cox proportional-hazards analysis
Hazard ratio (95% CI)
p- value
Continuous (per unit increase in cathepsin S):
Model A* 1.03 (1.00–1.06) 0.07 Model B* 1.03 (1.00–1.07) 0.05 Model C* 1.03 (1.00–1.07) 0.04
Model A: age- and sex-adjusted models; model B: lifestyle model (age, sex, BMI, smoking, leisure-time physical activity, and education level); model C: cardiovascular risk factor model (age, sex, systolic blood pressure, diabetes, smoking, BMI, total cholesterol, HDL-C, anti-hypertensive treatment, lipid-lowering treatment, and history of cardiovascular disease).
*Models A and C, n = 987. Model B, n = 950 individuals (due to missing covariates).
Study IV
Effect of diet on cathepsin S
A healthy Nordic diet reduced plasma cathepsin S levels, from 20.1 µg/L (± 4.05 SD) to 19.7 µg/L (± 4.3 SD) whereas the control group changed from 18.2 µg/L (± 2.9 SD) to 19.1 µg/L (± 3.8 SD) (p = 0.03) (Figure 1). Mean difference in change between groups were 1.2 µg/L (±0.3 SD).
These differences remained after adjusting for sex (p = 0.03) and insulin sensitivity (p = 0.03), whereas adjusting for weight change (p = 0.22), LDL-C (p = 0.36), and total cholesterol (p = 0.48) abolished the significant differ-ence between groups. However, adjusting for baseline cathepsin S levels attenuated the difference between groups (p = 0.06).
Figure 1. Differences in serum cathepsin S levels between the control diet and the healthy Nordic diet
from baseline to 6 weeks. Serum levels of cathepsin S were reduced compared to the control diet (p = 0.03).
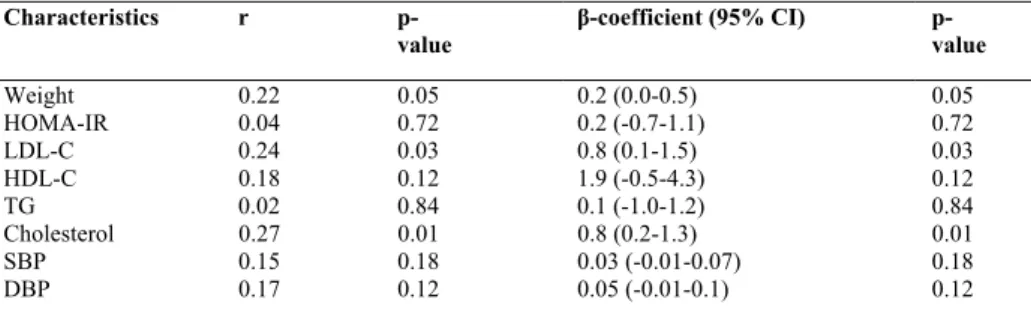
Correlations between changes in cathepsin S and cardiometabolic risk factors
Changes in cathepsin S tended to be correlated with changes in weight (p = 0.05), a result that remained after adjusting for sex (p = 0.04). Furthermore, there were correlations between change in cathepsin S and change in LDL-C (p = 0.03) and total cholesterol (p = 0.01). These associations remained sig-nificant after adjusting for sex (p = 0.03 and p = 0.01, respectively). Change in cathepsin S did not correlate with changes in insulin sensitivity, TG, HDL-C, SBP, or DBP (Table 8).
Table 8. Correlations in the whole sample (n = 86) between change in serum cathepsin S concentrations and changes in weight and cardiometabolic risk factors during 6 weeks
Characteristics r p-
value β-coefficient (95% CI) p- value
Weight 0.22 0.05 0.2 (0.0-0.5) 0.05 HOMA-IR 0.04 0.72 0.2 (-0.7-1.1) 0.72 LDL-C 0.24 0.03 0.8 (0.1-1.5) 0.03 HDL-C 0.18 0.12 1.9 (-0.5-4.3) 0.12 TG 0.02 0.84 0.1 (-1.0-1.2) 0.84 Cholesterol 0.27 0.01 0.8 (0.2-1.3) 0.01 SBP 0.15 0.18 0.03 (-0.01-0.07) 0.18 DBP 0.17 0.12 0.05 (-0.01-0.1) 0.12 Data are correlation coefficients, and regression coefficients with 95% CI. All models were adjusted for sex. HOMA-IR: homeostasis model assessment-insulin resistance; HDL-C: high-density lipoprotein cholesterol; LDL-C: low-density lipoprotein cholesterol; TGs: triglycerides; SBP: systolic blood pressure; DBP: diastolic blood pressure. Pearson’s correlation and linear regression were used.
Discussion
Principal findings
Study I
We identified a positive cross-sectional associations between serum cathep-sin S and two markers of cytokine-mediated inflammation, CRP and IL-6, in a community-based sample of elderly men. These associations were similar in non-obese individuals, even after taking age, BMI, prevalent CVD, life-style factors, and cardiovascular risk factors into account in multivariable analysis. In longitudinal analyses, higher cathepsin S at baseline was associ-ated with higher CRP and IL-6 levels after six years of follow-up.
Study II
We identified a cross-sectional association between increased serum levels of cathepsin S and reduced insulin sensitivity in a community-based sample of elderly men. This association remained significant even after adjustment for age, BMI, WC, CRP, IL-6, adiponectin,TGs, previous CVD, and cystatin C. The associations were similar in non-obese individuals. In contrast, no significant association was observed between cathepsin S and insulin secre-tion. Moreover, in longitudinal analysis, higher cathepsin S levels were asso-ciated with an increased risk of developing diabetes during six years of fol-low-up.
Study III
We identified that higher serum levels of cathepsin S were associated with increased mortality risk, even after adjustment for age, lifestyle factors, and cardiovascular risk, in two independent cohorts of elderly individuals (aged 70 years). Moreover, in the ULSAM cohort, serum cathepsin S was inde-pendently associated with cause-specific mortality from cardiovascular dis-ease and cancer.
Study IV
We identified that adherence to an ad libitum healthy Nordic diet for 6 weeks slightly reduced levels of plasma cathepsin S in normal or marginally overweight individuals, compared with the control group. Changes in circu-lating cathepsin S concentrations were correlated with changes in body weight, LDL-C, and total cholesterol.
Possible mechanisms
The visceral adipose tissue is an endocrine organ that produces many differ-ent biological factors such as inflammatory factors, cytokines, and
hor-mones.54,55 In chronic inflammatory processes, macrophages accumulate and
damage host tissue by releasing proteolytic enzymes—such as cathepsin S,
K, and L—which mediate the pathological degradation of ECM.19,56,57 Of all
the cathepsins, cathepsin S is the most capable of destroying and remodeling
the ECM, as it is able to remain active at neutral pH.14
Several in vivo and in vitro studies have suggested a causal interplay be-tween cathepsin S activity and inflammation. Experimental studies have indicated that increased cathepsin S activity induces inflammatory activity. For example, in animal models cathepsin S inhibitors have reduced
T-cell-driven inflammation in the central nervous system (CNS)58 and reduced
al-veolar inflammation induced by IL-6, TNF-α, and IFN-γ.22,59 Our
longitudi-nal data support the theory that cathepsin S has a proinflammatory role. On the other hand, increased cathepsin S activity has also been suggested to be a consequense of inflammatory activity. Proinflammatory mediators such as IL-6, TNF-α, and IFN-γ have been shown to increase cathepsin S
activity in adipose tissue,13 the lungs,60 atherosclerotic lesions,40 dendritic
cells,38 macrophages,14 and keratinocytes.61
Moreover, treatment with anti-inflammatory agents such as IFN-γ inhibi-tors and anti-inflammatory disease-modifying anti-rheumatic drugs (DMARDs) has been shown to inhibit cathepsin S activity in cell-based and
in vitro assays.37,62
It is possible that cathepsin S activity is both a consequence of and an in-ducer of inflammatory activity, i.e that the interplay between cathepsin S and inflammation is a vicious circle where one factor exacerbates the other. Based on the study results above, it is reasonable to conclude that cathepsin S has a key function in inflammatory regulation, even though the exact mechanism is not completely understood.
Our community-based data adds to previous experimental reports sup-porting the theory of a causal interplay between cathepsin S and inflamma-tory activity, also in humans. This association appears to apply also to nor-mal-weight individuals in the community.
It is therefore possible that cathepsin S is a mechanistic link between obe-sity and its associated diseases. This idea is supported by the fact that weight loss reduces circulating levels of cathepsin S and also inflammatory activ-ity.24,63 Further studies are needed to improve our understanding of this
com-plex interplay between inflammation, obesity, and cathepsin S.
Our data also suggest that cathepsin S activity may be involved in the early phases of type-2 diabetes development in humans. To our knowledge, this has never been reported. There have, however, been a few studies that have found increased levels of circulating cathepsin S in patients with diabe-tes.25,26 For example, children with early-onset and longstanding diabetes
type-1 have increased serum levels of adipokines and cathepsin S,
suggest-ing that adipose tissue inflammation may be involved in type-1 diabetes.26 It
has also been observed in a knockout mouse model that deficiency in
cathepsin S gave protection against type-1 diabetes.64 Even so, more research
in humans is required to establish whether cathepsin S has a causal role in the development of insulin resistance and type-2 diabetes.
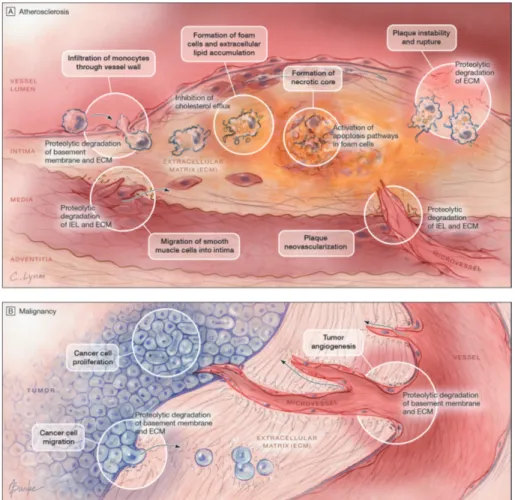
Several authors have suggested that cathepsin S plays a key role in the different stages of the atherosclerotic process, which includes remodeling of the ECM, involvement in lipid metabolism, and aggravation of foam cell
formation.12,65 Cathepsin S activity has been suggested to be involved
through promotion of atherosclerotic plaques and destabilization of ad-vanced plaques. The plaque morphology is changed, with smaller necrotic cores, reduced apoptosis, decreased smooth muscle cell content and collagen deposition, a maintained integrity of the tunica media, and reduced plaque
vulnerability (Figure 2A).12,28-32 In knockout studies in mice, cathepsin K-
and S-deficiency reduces atherosclerosis by up to 60%.28,66
Cathepsin S also appears to have an important role in the progression of cancer via tumor proliferation, angiogenesis, and cell migration (Figure 2B).33,34,67-71
Figure 2A and 2B. Cathepsin S in the progression of atherosclerosis and malig-nancy.
Jobs et al. (2011) Association between serum cathepsin S and mortality in older adults. JAMA 14:306(10):1113-21.
Thus, our community-based data also confirm and extend previous experi-mental research suggesting that cathepsin S activity is involved in the patho-logical processes leading to CVD, cancer, and death.
As cathepsin S appears to be involved in many pathological conditions, and appears to be a promising new risk marker of both cardiometabolic and malignant diseases, it may be a possible target for pharmaceutical interven-tion. However, to date, we are not aware of any studies with non-pharmaceutical connections on ways to reduce circulating cathepsin S levels. The mechanism behind diet-induced reduction of circulating cathepsin S levels is not known, but it may be related to adipose tissue. We found that the reduced levels of cathepsin S seen after intake of a healthy Nordic diet no longer remained significant after adjusting for weight change. The body weight was reduced by 3 kg on average during the Nordic diet compared to
controls, and there was a borderline-significant relation between change in body weight and change in cathepsin S. Unfortunately, the study was not sufficiently powered for us to perform multivariable regression analysis. Future dietary interventions will provide further information on the possible role of weight loss rather than diet per se on reducing cathepsin S. Further-more, subjects on the healthy Nordic diet for 6 weeks had a markedly im-proved cardiovascular risk profile, including lowering of LDL-C, insulin
resistance, and blood pressure.44 Some studies on obese women have shown
that cathepsin S is strongly associated with cardiovascular risk factors, such
as elevated TGs35 and LDL-C.30 It is possible that the reduced cathepsin S
levels in the present study were secondary to the improvement in these car-diovascular risk factors. Our study supports such findings, since adjustment for change in LDL-C and total cholesterol—and also for change in body weight—abolished the significant difference between the groups, and there was an association between change in cathepsin S and changes in total cho-lesterol and LDL-C. Thus, in line with the current dietary recommendations, a healthy Nordic diet appears to be able to modify cathepsin S levels moder-ately, a finding that is of clear interest considering that cathepsin S is closely linked to several risk factors and mortality risk.
Strengths and limitations
(Papers I, II, III, and IV)
The strengths of our investigation included the use of two independent community-based study samples with longitudinal data and the detailed characterization of the study participants. To our knowledge, the ULSAM and PIVUS cohorts are the largest cohorts to have been analyzed concerning circulating levels of cathepsin S. Moreover, the ULSAM cohort is currently the largest cohort that has been evaluated for insulin sensitivity with the gold standard euglycemic clamp method.
Limitations of the studies included the unknown generalizability to women and to other age groups and ethnic groups. Also, multiple statistical analyses were performed in several different subgroups. Yet, the consistency of results across all models and subsamples makes it unlikely that the asso-ciations observed arose by chance.
The strengths of the NORDIET post-hoc study included the randomized controlled design. The fact that all foods were provided for the Nordic diet group ensured high compliance with a very low drop-out rate. Since only Caucasian Swedish subjects were included, generalizability to other ethnic groups and other patient groups remains to be investigated.
Clinical implications
Cathepsin S has been put forward as a promising target for pharmaceutical intervention. The development of selective cathepsin S inhibitors is ongoing,
and at various stages of advancement.11,31,72-75 Cathepsin S and K are already
being evaluated clinically.76 Several studies have shown promising results
concerning treatment of allergies and autoimmune diseases, atherosclerosis, and cancer. For example, an in vitro study showed that cathepsin S inhibition blocks invariant chain proteolysis in B cells and dendritic cells, as well as antigen-induced T cell proliferation, suggesting that the inhibitor can be used
for treatment of allergies or autoimmune diseases.77 Furthermore, it has been
shown in mouse and human studies that cathepsin S inhibition leads to pre-vention or delay of tumor metastasis, through its impact on angiogenesis and
apoptosis.11,73,74,78 Several studies done in atherosclerotic mouse models have
demonstrated that there is a strong atheroprotective activity when cathepsin S inhibitors are used. The size of atherosclerotic plaques was reduced sig-nificantly and there were also sigsig-nificantly smaller numbers of elastin lamina breaks, plaque macrophages, and buried fibrous caps, leading to reduced
arterial remodeling, endothelial cell invasion, and atherogenesis.31,79 A recent
study showed that deletion of the cathepsin S gene induced a robust reduc-tion in blood glucose in an obese mouse model. In vivo testing of glucose tolerance, insulin sensitivity, and glycemic response revealed that cathepsin S suppression reduces hepatic glucose production despite there being no
improvement in insulin sensitivity.80 These findings of a metabolic effect of
cathepsin S are promising results regarding treatment of type-2 diabetes with cathepsin S inhibitors.
Interestingly, it has been shown that Atorvastatin affects cathepsin S lev-els. A recent study showed that Atorvastatin treatment in patients with stable angina pectoris reduced the plasma cathepsin S concentrations and activity, but it did not change plasma cathepsin S mRNA levels. They also found that cathepsin S was associated with improvement in LDL-C subclass profile (a reduced predominant size of LDL-C and an increased percentage of small,
dense LDL-C particles).81
Intervention trials are needed to evaluate whether cathepsin S inhibition is a safe and effective pharmacological strategy for treatment of different dis-eases.
Cathepsin S as a marker of risk-future perspectives
Cathepsin S appears to be a promising new marker of risk of developing many pathological conditions, and also mortality.
Our work with two different cohorts supports this theory, as we found that higher serum levels of cathepsin S were associated with increased mortality,
even after adjustment for age, lifestyle factors, and cardiovascular risk fac-tors. Furthermore, in one cohort cathepsin S was found to be independently associated with cause-specific mortality from cardiovascular disease and cancer. Furthermore, a recent pilot study in patients with colorectal cancer showed that increased tumor expression of cathepsin S was associated with reduced survival. Also, adjuvant chemotherapy was effective mainly in those
patients with tumors that had a high degree of cathepsin S expression.82
Based on these findings, cathepsin S appears to be a biomarker that inde-pendently reflects an increased risk of mortality. By contrast, in a small study of patients with peripheral artery disease, circulating levels of
cathep-sin S were not found to be associated with an increased risk of mortality.83
The question still remains as to whether cathepsin S is a risk marker that can be used in clinical practice. At present, several important questions re-main unanswered, and they need to be addressed to evaluate the usefulness of cathepsin S as a biomarker in clinical practice. Further large-scale studies are needed, with different ages, ethnicities, and gender, to understand the complex interplay between cathepsin S and different pathological conditions. We need to investigate what levels of circulating cathepsin S should be consider normal. The phenotypic characteristics of circulating cathepsin S levels should be determined. We need to provide further mechanistic infor-mation on cathepsin S activity and to be able to explain why higher levels of circulating cathepsin S are a predictor of CVD, diabetes, and cancer.
Cathepsin S must be evaluated systematically regarding its ability to im-prove risk prediction beyond established risk factors. Furthermore, future studies should also identify relevant thresholds for cathepsin S levels in or-der to achieve optimal model discrimination, and to determine whether cathepsin S is a suitable risk factor in selected patient groups only or whether it can be used in primary prevention.
Furthermore, we need to explore and understand the link between genetic markers that are associated with circulating cathepsin S levels and the differ-ent associated diseases. This could give important information concerning identification of additional causal pathways that are involved with cathepsin S activity.
Finally, although we have presented evidence in paper IV that cathepsin S seems to be decreased by a healthy Nordic diet, further studies need to ad-dress whether circulating cathepsin S is a modifiable risk factor with regard to type of intervention, e.g. different diets, role of energy intake as opposed to composition of diet, physical activity, and pharmacological agents. Future invention trials are needed to determine whether cathepsin S inhibition is a safe and effective pharmacological approach, whether measurement of se-rum cathepsin S is a relevant way of identifying individuals who might bene-fit from cathepsin S inhibition, and whether cathepsin S is an appropriate biomarker for assessment of the efficacy of the treatment. Future studies
must also investigate whether it is possible to reduce serum cathepsin S with non-pharmaceutical treatments.
Our understanding of cathepsin S activity has improved during the last few years, but there much research still has to be done before cathepsin S can leave the laboratory and reach patients. It is a promising biomarker that may prove to be clinically relevant, but a large number of studies will be necessary before this can become a reality.
Conclusions
A number of studies have observed that cathepsin S is associated with dis-eases such as obesity, insulin resistance, CVD, and cancer. Inflammation is a common denominator of all these diseases. Increased cathepsin S activity with ECM degradation is associated with inflammation. In vivo and in vitro experimental data have suggested that increased cathepsin S activity may have harmful effects, and from studies with human cohorts, our results sup-port and extend these findings. Based on our work, it appears that circulating levels of cathepsin S may be a promising biomarker that independently re-flects inflammation, insulin resistance, the risk of developing diabetes, and an increased risk of mortality—and even cause-specific mortality from CVD and cancer.
Finally, a healthy Nordic diet was able to moderately reduce cathepsin S levels in normal-weight and overweight men and women. This effect may be partly mediated by diet-induced weight loss and possibly by reduced LDL-C concentrations.
Study I
The association between cathepsin S and inflammation is also present in normal-weight individuals in the community.
Study II
Increased cathepsin S levels are associated with the early phase of glucome-tabolic disease prior to the development of diabetes.
Study III
Higher serum levels of cathepsin S were found to be associated with an in-creased risk of mortality in 2 independent community-based cohorts.
Study IV
A healthy Nordic diet moderately reduced cathepsin S levels in normal-weight and overnormal-weight men and women.
Summary in swedish
Sammanfattning på svenska
I stora delar av världen ökar övervikt och fetma lavinartat. Fetma är nära sammankopplat med hjärtkärlsjukdomar, diabetes och cancer, och för tidig död, men än idag vet vi inte vad som är orsaken till detta. Fettvävnaden ut-söndrar olika ämnen, som man tror kan vara en del av länken mellan fetma och sjukdomar. Cathepsin S är ett ämne i kroppen som får immunförsvaret att fungera och sårskador att läka. Trots cathepsin S viktiga funktioner, så verkar det även ha negativa egenskaper. Studier har visat att det finns ökade mängder cathepsin S vid olika sjukdomstillstånd, såsom inflammation, hjärt-kärlsjukdomar, diabetes, cancer och fetma. Cathepsin S har föreslagits vara länken mellan fetma och hjärtkärlsjukdomar.
I våra studier har vi visat att ökade blodnivåer av cathepsin S kan visa på sjukdomstillstånd i kroppen, såsom inflammation, insulinresistens, risk att utveckla diabetes och ökad risk att dö i förtid. Intressant nog visade våra studier även att detta gäller hos normalviktiga individer.
Idag pågår det forskning kring att ta fram läkemedel som kan hämma cathepsin S. Det har visat goda resultat i att hämma åderförkalkning samt cancerspridning. Ingen tidigare forskning har gjorts för att se om det är möj-ligt att sänka cathepsin S nivåer i blodet med exempelvis livsstilsförändring. Vår studie visade att intag av en hälsosam nordisk kost under sex veckor sänker halten av cathepsin S i blodet. Eftersom försökspersonerna gick ner i vikt, samt även förbättrade sina blodfetter, kan vi dock inte utesluta att sänk-ningen av cathepsin S orsakades av detta och inte kosten i sig.
Studie I
Vi hittade ett samband mellan högre cathepsin S nivåer i blodet och ökad inflammation även hos normalviktiga individer.
Studie II
Ökade cathepsin S nivåer är kopplat till insulinresistens även hos individer utan diabetes. Dessutom är cathepsin S en riskfaktor för att utveckla diabe-tes.
Studie III
Individer med förhöjda serumnivåer av cathepsin S är har en ökad risk för en för tidig död.
Studie IV
En hälsosam Nordisk diet ger en måttlig sänkning av cathepsin S nivåer i serum, hos både normalviktiga och överviktiga män och kvinnor.