I
N T E R N A T I O N E L L AH
A N D E L S H Ö G S K O L A NHÖGSKOLAN I JÖNKÖPING
Företagsvärdering
En fallstudie av Unibet
Magisteruppsats inom Finansiering
i ämnet företagsekonomi
Författare:
Bertilsson Jonas
Davidsson Marcus
Handledare:
Wramsby Gunnar
J
Ö N K Ö P I N GI
N T E R N A T I O N A LB
U S I N E S SS
C H O O LJönköping University
Corporate Valuation
A case study of Unibet
Master thesis in Finance,
within the subject of Business Administration
Author:
Bertilsson Jonas
Davidsson Marcus
Tutor:
Wramsby Gunnar
Magisteruppsats inom Företagsekonomi
Titel: Företagsvärdering: En fallstudie av Unibet
Författare: Jonas Bertilsson & Marcus Davidsson
Handledare: Gunnar Wramsby Datum: 2005-05-27
Ämnesord Företagsvärdering, Unibet, fallstudie, spelföretag
Sammanfattning
Problem: Vadslagning och spel på internet har suddat ut vikten av nationella gränser, vilket har lett till ett mer diversifierat perpektiv av företaget. Detta har sannolikt även resulterat i att allt färre modeller för företagsvärdering kan anses vara lämpliga. I denna magisterexamen ville vi fördjupa and utveckla ämnet företagsvärdering med avseende på den Internetbaserade spelindustrin. En fördjupad studie av vadslagningsföretaget Unibet kan anses uppfylla detta ändamål.
Syfte: Syftet med uppsatsen är att identifiera faktorer i den strategiska, SWOT och finansiella analysen som ligger till grund för kassaflödesvärderingsmodellen och företagsvärdet
Metod: Vi har valt att göra en ”case study” för att samla in empiri till uppsatsen.
Slutsatser: En kasssaflödes-värdering utifrån olika utfall utfördes. Med de gjorda antagadena i det realistiska utfallet nåddes ett värde på 85 miljoner GBP, vilket var betydligt mycket lägre än det publicerade värdet. Vi anser att det beror på att den ökande konkurrensen på spelmarknaden och de strikt kontrollerade marknaderna kommer att göra det svårt för Unibet att bibehålla den starka tillväxten i framtiden. Dessa antaganden har baserats på informationen från den strategiska analysen, SWOT analysen och utvecklingen av finansiella nyckeltal.
Master Thesis in Business and Administration
Title: Corporate Valuation: A case study of Unibet
Author: Jonas Bertilsson & Marcus Davidsson
Tutor: Gunnar Wramsby Date: 2005-05-27
Subject terms: Corporate valuation, case study, Unibet, bookmaking
Abstract
Problem: The online betting industry has erased the importance of national borders and opened up the world, which has lead to a more diversified perspective of the company but also to a more limited range of appropriate corporate valuation models that could be ap-plied. In this master thesis we wanted to broaden and develop the topic of corporate valua-tion with regard to the on-line gambling industry. In order to do that, a case study of the on-line betting firm Unibet and its core betting activities has been carried out.
Purpose: The study aims to identify factors in the strategic, SWOT and financial analysis that will be used in the cash flow valuation model in order to derive the company value Method: A case study has been chosen to collect empirical data to our study.
Conclusion: A cash flow valuation in different scenarios was carried out. With the as-sumptions made in the “probable” scenario a value of approximately GBP 85 million was reached, which was significantly lower than the listed value. This is mainly due to the fact that we believe that the increased competition on the gambling market and the strict regu-lated markets will make it difficult for Unibet to maintain its strong growth in sales in the future. The assumptions have been based on the information gained from the strategic analysis, the SWOT analysis and the development in financial ratios.
Acknowledgements
We gratefully acknowledge the help provided by Professor Gunnar Wramsby in the writing of this master thesis. Valuable comments throughout the whole working process have been given.
Table of Contents
1
Introduction ... 6
1.1 Thesis Introduction ... 6
1.2 Unibet– A Brief Overview ... 7
1.3 Background ... 8
1.4 Problem... 9
1.5 Purpose... 11
1.6 Perspective and Limitations ... 11
2
Theory ... 12
2.1 The fundamentals of Bookmaking: Probability and Payout ... 12
2.2 Valuation and Fundamental Analysis ... 14
2.3 Strategic Analysis... 15
2.3.1 Specific Firm Analysis... 16
2.3.2 Knowledge Assets and Competitive Analysis ... 17
2.3.3 Industry Analysis... 18
2.3.4 Environmental Macro Analysis... 19
2.3.5 SWOT Analysis... 21
2.4 Financial Analysis... 21
2.4.1 Financial Ratio Analysis... 21
2.4.2 Cost of Capital ... 23
2.5 Cash-flow Valuation ... 24
2.5.1 Shareholder Value Analysis (SVA) ... 25
3
Methodology ... 27
3.1 Empirical Process of the Thesis ... 27
3.2 Methodology Literature and Chosen Method ... 27
3.3 Quality of Research... 28
3.4 Literature Search... 29
4
Empirical Findings and Analysis... 30
4.1 Strategic Analysis... 30
4.1.1 Specific Firm Analysis... 30
4.1.2 Knowledge Assets and Competitive Analysis ... 31
4.1.3 Industry Analysis... 34
4.1.4 Environmental Macro Analysis... 35
4.1.5 SWOT Analysis... 36
4.2 Financial Analysis... 38
4.2.1 Financial ratio analysis ... 42
4.2.2 Cost of Capital ... 42
4.3 Cash flow Valuation... 42
5
Conclusions... 46
5.1 Discussion of the results ... 46
5.2 Suggestions to further studies ... 47
References ... 48
Figures
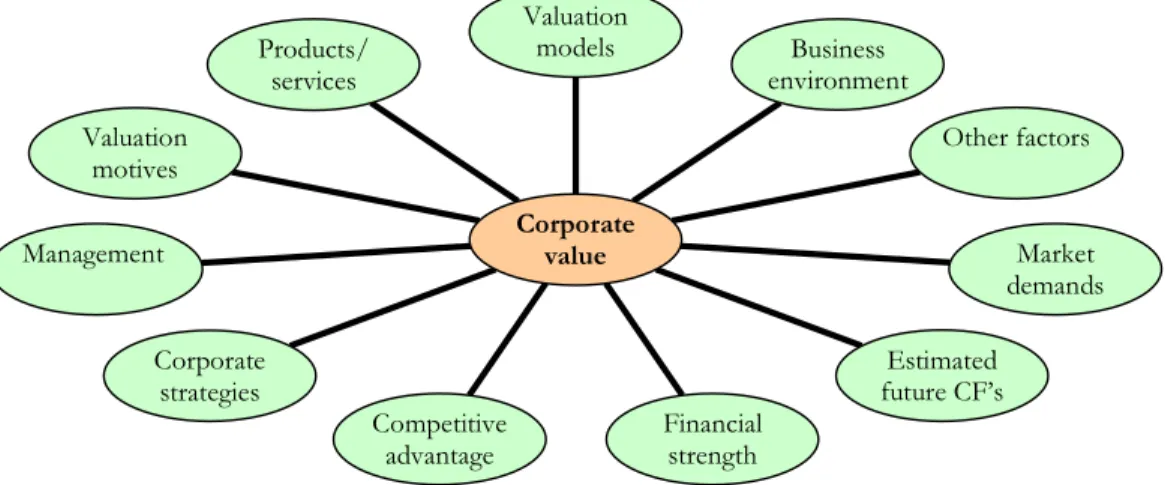
Figure 1.1 Examples of factors affecting the corporate value ... 6
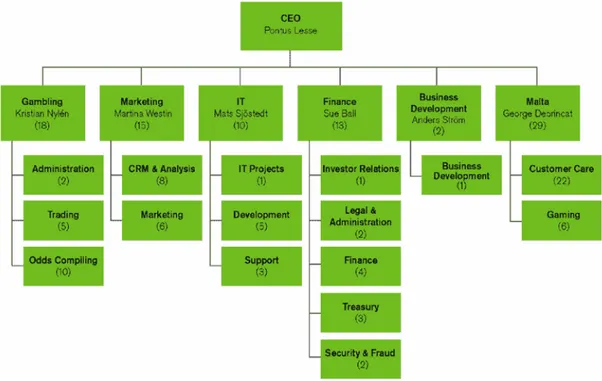
Figure 1.2 Organizational structure Unibet ... 7
Figure 1.3 Firm Uncertainties ... 16
Figure 1.4 The five force model ... 18
Figure 1.5 Development in ROA during 2001-2003 ... 39
Figure 1.6 Development in sales during 2001-2003... 39
Figure 1.7 Asset turnover during 2001-2003... 40
Tables Table 2.1 Constructing a riskless portfolio ... 12
Table 2.2 Constructing a “one sided” riskless portfolio... 12
Table 2.3 Constructing a “two sided” riskless portfolio ... 13
Table 2.4 Competition among bookmakers... 13
Table 2.5 Constructing a riskless portfolio under competition ... 14
Table 2.6 Strenghts, Weaknesses, Opportunities and Threats ... 21
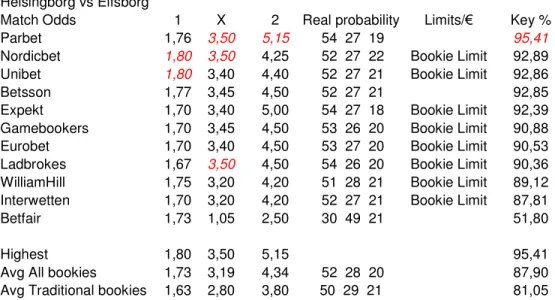
Table 2.7 Unibet`s odds benchmarked 1 ... 32
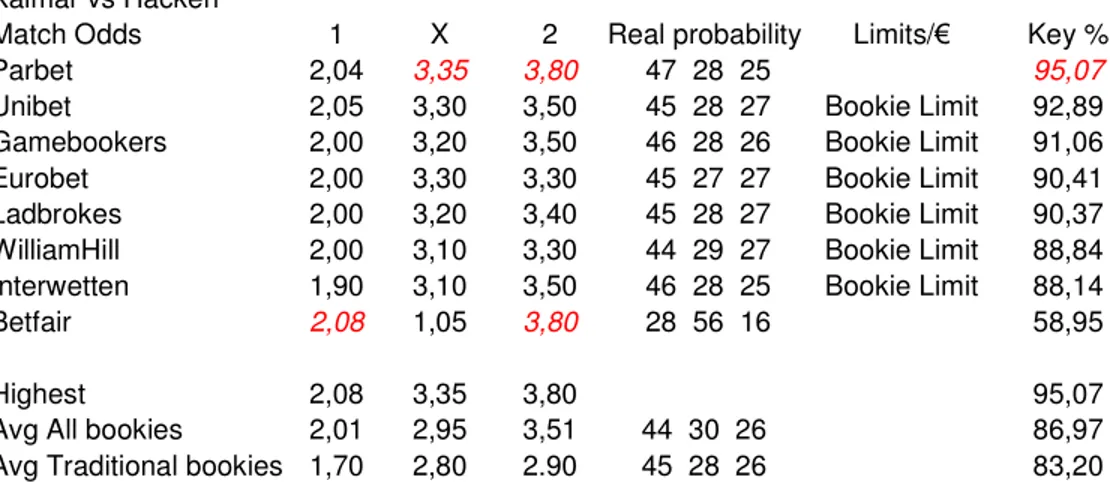
Table 2.8 Unibet`s odds benchmarked 2 ... 33
Table 2.9 Unibet`s odds benchmarked 3 ... 33
Table 2.10 Unibet`s financial ratios ... 38
Table 2.11 Comparisons of industry betas ... 41
Table 2.12 Discount rate ... 41
Table 2.13 CF’s optimistic scenario ... 42
Table 2.14 CF’s probable scenario ... 43
Table 2.15 CF’s pessimistic scenario... 44
Table 2.16 CF’s adjusted probable scenario... 45
Appendix Appendix 3.1 More basics bookmaking definitions... 51
Appendix 3.2 Valued Bets Unibet ... 54
Appendix 3.3 Safe Bets ... 56
1
Introduction
This chapter will start with an introduction of the thesis. Then a brief overview of Unibet will be given. Further we will describe the background for the thesis, the subject and present reasons why we have chosen the specific subject. This is followed by the problem statement and the purpose of our study. This chapter will end with a description of the thesis’s perspective and limitations.
1.1
Thesis Introduction
The increased use of Internet has lead to a more diversified and international market. One example of an industry that quickly understood the flexibility of the Internet and the poten-tial of an unlimited market is the bookmaker industry. This thesis will deal with corporate valuation through a case study of Unibet representing the online betting industry. Unibet was brought to our attention in 2004 when they were the first online betting firms to be listed on the Stockholm Stock Exchange. The thesis will deal with evaluating the com-pany’s competitive advantages, market position and financial position. Frykman & Tolleryd (2003) explain that the base for corporate valuation is not only to rely on analysing the profit, present and historical balance sheet. In order to gain insight of the company’s core value several different topics need to be evaluated, for instance the future financial per-formance, the internal resources, market position and the company’s knowledge resources. The empirical study will be the base for our conclusions and contribution to academic the-ory. There exists a lack of a complete framework that incorporates all different aspects when it comes to corporate valuation. There are several models that analyze different as-pects of the corporation. In order to get the whole picture of the company and the factors that influences the value investors have to apply multiple models and draw conclusions based upon them. Two of the most difficult tasks are to correctly identify the importance of each of the variables and to successfully make future predictions about the company and its future earnings.
Figure 1:1 Example of factors affecting the corporate value based on the model by Scharfstein (1991) Products/ services Valuation motives Management Corporate strategies Competitive advantage Financial strength Estimated future CF’s Market demands Other factors Business environment Valuation models Corporate value
The base for this thesis is a fundamental value approach. Fundamental value means the value of an equity investment that is held over a long time period. The opposite is value that is created in the short term through speculative trading. The relationship between fi-nancial statements, fifi-nancial forecasts and share prices are far from straightforward. Eco-nomic theory usually assumes that the investors are rational, wealth-maximizing individuals and that the stock market is efficient and reflects fundamental values. The problem is that there is no guarantee that stock market prices actually reflect fundamental values due to the fact that investors also are also driven by sentiments and expectations (Barker, 2001).
1.2
Unibet– A Brief Overview
The company was founded in 1997 by Anders Ström. The company is one of the largest on-line gambling operators in the Nordic market with over 275 000 customers worldwide. Unibet is focused on the Nordic region which accounts for 75% of the customer base. The rest 25% of the customers are diversified into more than 100 different countries. Unibet offers a comprehensive range of online gambling products such as sport betting, live bet-ting and casino gambling through their website. 1998 the company was granted a licence for betting operations in UK. The same year Unibet established an office in London and started its betting operations taking bets over the telephone. In 1999 a Swedish and an English website was launched. In 2000 the company was granted a licence for betting op-erations in Malta. In 2001 the second version of Unibet’s website was launched that was translated into 12 languages. Moreover, in 2003 the company had a turnover of GBP 144 million (1.85 billion SEK) and a profit after tax of GBP 2.9 million (37.3 million SEK). In June 8, 2004 Unibet was noted on the Stockholm Stock Exchange. They were the first pub-licity traded online betting company on the Swedish market (Unibet, 2005).
The business concept of Unibet is to “provide reliable on-line gambling and to build value by delivering entertaining gambling products and excellent service”. The strategy is to maintain its position in the Nordic region as well as expanding its operation within and outside the rest of Europe. Unibet Group plc is divided into different business units: Uni-bet Ltd (UK), Firstclear Ltd (UK), UniUni-bet Holding Ltd (Malta) and UniUni-bet Software (Swe-den). Unibet Holding Ltd also has one sub branch Unibet International Ltd (Malta) (Uni-bet, 2005).
Unibet’s sport betting offers a comprehensive range of odds on a variety of international and local sport events, 24 hours a day, seven days a week. The customer will find odds on around 500 different events and around 25 different sports. The most popular sports are football, ice hockey and tennis, which together compromise around 80 per cent of Unibet’s sport books. The live element is very important for Unibet. This means that the customer can place a bet on a particular game or event and then watch the game live on the televi-sion. The company chose and prioritises events that have a large exposure in the media. The most attractive are events broadcasted live on the terrestrial 1
channels. The firm’s ca-sino consists of 17 different products. This includes online table games like Roulette, Black Jack, Caribbean Stud, Baccarat and Texas Hold’em but also online slot machines. Casino games are not subject to seasonality variation as sport betting is. The activity on online ca-sino games is relative stable over the year (Unibet, 2005).
1.3
Background
The importance of understanding cultures and traditions increases when markets are get-ting more and more international. This is also true when it come to corporate goals. In dif-ferent countries there exist difdif-ferent philosophies when it comes to corporate and investor relationships. It is hard to find one universal rule that is not influenced by cultural deter-mined norms. One example of this is the tradition of shareholder and corporate wealth maximization (Eiteman, Stonehill & Moffet, 2004).
The Anglo-American2 markets are characterized by the philosophy that the firms’ main fo-cus is on maximizing the shareholders wealth; the shareholders wealth maximization (SWM) model. The shareholders wealth is measured by the sum of capital gains3 and divi-dends. The firm should also try to minimize the risk faced by the shareholder for a given rate of return. This perspective is essential when it comes to attracting international capital from outside investors. During the 1990s economic expansion and bull market4
a flaw in the SWM model was exposed. Instead of focusing on long-term value maximization several corporations focused on short-term value maximization. This development had been driven by the excessive use of stock options to motivate top managers (Eiteman et al 2004). According to Fama & Jensen (1983) shareholders can motivate managers to accept the prescriptions of the SWM model which is described in the study of Agency theory. According to Eiteman et al (2004) continental European and Japanese markets on the other hand are characterized by the philosophy that the firms’ main objective is to maxi-mize the corporate wealth, the corporate wealth maximization (CWM) model. In this
1 TV broadcasted by radio waves the opposite is satellite broadcasting.
2 Anglo-America includes United States, United Kingdom, Canada, Australia and New Zeeland.
3 The profit you realize from selling the stock, the difference between the selling price and the purchase price 4 The prices of stocks increases on average and the confident and expectations of the market is getting higher
model the shareholders have the same priority as other corporate interest groups like the management, suppliers, creditors and local community. The goal for the company is to earn as much as possible in the long run and to increases the corporate wealth for the benefits of all interest groups. The definition of corporate wealth is much broader than the defini-tion of financial wealth. Corporate wealth also includes the market posidefini-tion of the firm and the knowledge and skills of the employees when it comes to production, technology, mar-keting and administration of the corporation. The CWM model avoids the shortcoming of the SWM model when it comes to short-term value maximization. However it has it owns flaw. Managers are focused on pleasing a number of different corporate interest groups. The problem is that it does not exist a clear structure of the tradeoffs when it comes to pleasing on different interest groups and how it affect the long term value of the company. This has influenced us to write a thesis that covers a more broaden perspective on corpo-rate valuation. One example of increased internationalization is the way online bookmakers erases the importance of national boarders and opened up the world which leads to a more diversified view of the company but also to a more limited range of appropriate corporate valuation models that could be applied. The wider perspective and more diversified view of corporate valuation is supported by our choice of a non traditional firm, a bookmaker firm, which leads to more challenges when it comes to corporate valuation. Moreover, argu-ments for that valuation of betting and gambling companies can be a problem for investors have been discussed (SVD, 2004).
The business environment is characterized by complexity, which leads to that business valuation in practice can be considered to be products of subjective estimates. Most theo-ries and models have to draw boundatheo-ries and make simplifying assumptions of reality in order to work properly. The correct or true value of the business is in the end the per-ceived fair value of the buyer (Blass, 2001).
1.4
Problem
Mergers, acquisitions and corporate takeovers have increased. If the focus of management is not on value maximization the chance of replacement is large or that the company will be a target of a takeover. This leads to that the most important task for management is to maximize the corporate or shareholder wealth, in order to do that management has to un-derstand how value is created and measured. This is when corporate valuation comes in to play (Frykman & Tolleryd, 2003).
Increased internationalization through online commerce in the world leads to that corpora-tions are exposed to larger diversity than before. Philosophies and tradicorpora-tions when it comes to corporate and investor relationships differ between countries. This makes the quest of finding the most optimal valuation techniques and estimating the “fair” value of the com-pany even more complex.
Another reason of why the pursuit of finding a universal value of a company can be diffi-cult is related to people’s motives. A seller wants a high value while a buyer wants a low value naturally. Corporate valuations models are also limited to constraints by the number of parameters the models take into consideration. The most “objective” value of a com-pany can be found as a result of implementing numerous appropriate models. The nature of the business field, in this case betting operations, provides an extra challenge
A large portion of companys assets can be considered to be intangible5. This statement is true in two different ways. First when it comes to the goodwill created on the balance sheet through an external acquisition of company at a price above the market value of its assets. Secondly through a firms knowledge assets which works as a foundation for the firms competitive advantage. These intangible assets make the process of accurately accessing the corporate value complex and in some sense arbitrary. This leads to that corporate valuation is not an exact science. Intangible assets are impossible to accurately quantify but highly important to evaluate and identify
The aim of the thesis is not to try to outsmart the market, which can be considered impos-sible if the markets are efficient, but rather identifying the factors and assumptions made in order to derive the corporate value. In our opinion there does not exist a complete frame-work for estimating the value of a more non traditional firm like an international book-maker firm. Therefore this thesis will hopefully contribute to the development of, to some extent, a wider framework regarding the valuation of online betting companies.
In the first part of the thesis important models and literature in the field of corporate valua-tion will be reviewed. This is done in order to successfully implement them on the chosen company. Briefly the basic of bookmaking will also be discuss to insure that the reader un-derstand the way that the firm generate its profits which is important for the value of the company. In the second part of the thesis will analyse our chosen company Unibet. To an-swer the questions below an extensive analysis has to be done of, for example, the online bookmaking business, corporate valuation models, the competitiveness of Unibet’s odds, market position and financial strengths.
The questions that will be answered are:
• Why is Unibet successful and what is their competitive advantage? • What are the characteristics of the online gaming industry?
• What are Unibet’s strengths, weaknesses, opportunities and threats? • What is Unibet’s financial position?
• What is the value of Unibet and what assumptions are made to support this value? • What value scenarios can be created by adjusting these assumptions?
According to Barker (2001) a good understanding of valuation methods requires two things: First is an analytical review of appropriate valuation models, identifying the relation-ship between them and exposing the assumptions that each of them makes. The second is-sue is an evaluation of the data that are available for the use in the valuation models. There-fore an important relationship between the choice of valuation models and the availability of the data exists. The author explains that financial performance is very hard to measure objectively. The amount of profit a company makes is opened to subjective measurements. In view of this subjectivity, the relationship between financial statements, forecasts of financial performance and share prices are far from straightforward.
1.5
Purpose
The study aims to identify factors in the strategic, SWOT and financial analysis that will be used in the cash flow valuation model in order to derive the company value.
1.6
Limitations
Limitations are necessary and important in order to hopefully keep a high quality through-out the entire thesis. The thesis strategic analysis is focused more on evaluating Unibet’s betting business regarding odds and not so much on the newly opened online poker busi-ness or other casino games such as roulette and slot machines. They will be reviewed, summarized and analyzed but not with the same depth. This is done for two main reasons. The first reason is that casino games, especially online poker, are rather new and that the financial analysis part of the thesis is only dealing with figures for the period 2001-2003. The second reason is that online casino games are rather hard to benchmark and evaluate in order to determine if the company is offering products that are competitive. In the po-tential future value scenarios they will of course be included and adjusted for due to the fact that they might play an important roll for the future value of the company.
The thesis is based on the view of an external investor trying to estimate the company value. Furthermore, our perspective is based on an independent and critical standpoint. The structure of the thesis supports the separation of our thoughts from the already pub-lished literature in order to facilitate for the reader. Fundamental analysis rather than tech-nical analysis will be considered as the base for this thesis. The limitation is made due to the fact that technical analysis can not be considered to be apart of corporate valuation and it is some what controversial. It is questionable if it is possible to predict future stock price by using trends and pattern from the past.
2
Theory
Some examples of questions that are related to corporate valuation that will be discussed in this theoretical section of our thesis are: What are the basics of bookmaking? What is fundamental analysis? How is a SWOT analysis done? What is financial analysis? How is a discounted cash flow valuation done?
2.1
The fundamental of Bookmaking: Probability and Payout
The understanding of basic probability and quotes are essential for the understanding of how the bookmaking industry is making money. In the end this affects the corporate value. Wikipedia (2005) states that a bookmaker is an organisation or a person that gambles when it comes to different events and outcomes. The payout depends on the outcome and the odds of the bet. Manduchi (2004) describes a bookmaker as a person that is offering quotes on a football game as presented below to the left. Each quote represents the payout from investing 1 unit of money if the event on which the bet is conditional realized. It is as-sumed that the investor don’t have information regarding probability for the outcome. How can the quote “Away team wins” be calculated to construct a risk less portfolio?
Table 2:1 Constructing a riskless portfolio (Manduchi, 2004)
The bookmaker should make sure that the
∑
ofeach payout =∑
of the totalbet, in order to make the portfolio riskless. This can be done by constructing a portfolio that pays for example 1.66 under each event. The quote “Away team wins” must then be equal or smaller than 1.66/ 0.19= 8.97Now assume the bookmaker is offering quotes on an ice hockey game as presented below to the left In this case he has attached probability Ph, Pd and Pa to each event. “One side” safe bets means that the customer cannot choose which side of the bet to take. “Two sides” safe bets means that the customer can choose which side of the bet to take. How can the bookmaker make sure that the customers:
- Cannot place “One side” safe bets; where “two side” bets are possible? - Cannot place “One side” safe bets nor “two side” safe bets?
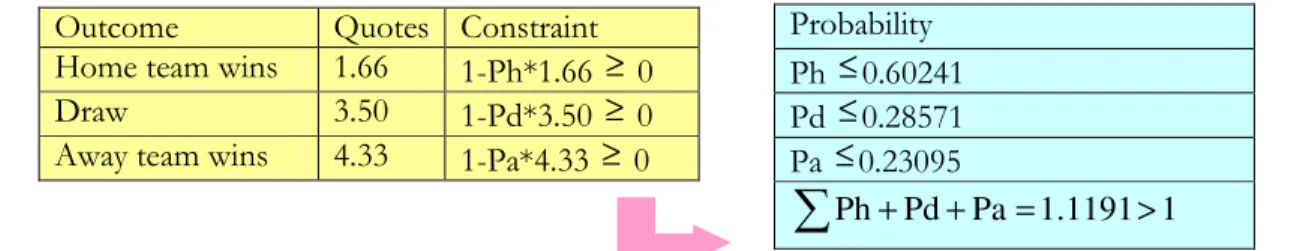
Table 2:2 Constructing a “One sided” riskless portfolio (Manduchi, 2004)
Outcome Quotes
Home team wins 1.66
Draw 3.50
Away team wins ?
bet payout
*B1 =1.66 B1=1
*B2 =1.66 B2= 1.66/3.50=0.47
*B3 =1.66 B3=1.66-(1+0.47)=0.185
∑
(B1+B2+B3)=1.66Outcome Quotes Constraint Home team wins 1.66 1-Ph*1.66 ≥ 0
Draw 3.50 1-Pd*3.50 ≥ 0
Away team wins 4.33 1-Pa*4.33 ≥ 0
Probability Ph ≤ 0.60241 Pd ≤ 0.28571 Pa ≤ 0.23095
1) The bookmaker should make sure that
∑
Ph+Pd+Pa>1, in order to make sure that no one can place any profitable “one side bets”, profitable “two side” bets are possible 2) The bookmaker should make sure that∑
Ph+Pd+Pa=1, in order to determine that no one can place any profitable “one side bets” or “two side bets”In the example above the customer can not place any “one side bets” however “two side” bets are possible due to the fact that
∑
Ph+Pd+Pa=1.1191>1The customer could then switch place with the Bookmaker and offer him the same quotes. The customer could then construct a portfolio that pays for example 1.66 under each event. The bookmaker will bet a total of 1.85 but he will only receive 1.66 back. The bookmaker will then not be able to place a profitable safe bet
Table 2:3 Constructing a “two sided” riskless portfolio (Manduchi, 2004)
The customer could also bet on combinations of the different events. If the customer now wants to bet on an event let say “home team loses”. Then a portfolio can be constructed with a fixed payout regardless of the events “Draw” or “Away team wins”. The customer can bet Y SKR on “Draw” and 1-Y SKR on “Away team wins”. This would give:
Y*3.50= (1-Y)*1.66 Y=0.553 1-Y=0.447
The customer can bet on the event “Home team loses” by betting 0.553 SKR on “Draw” and 0.447 SKR on “Away team wins”. We will face an implied quote equal to 0.553*3.5=0.447*4.33=1.9355 if the home team loses.
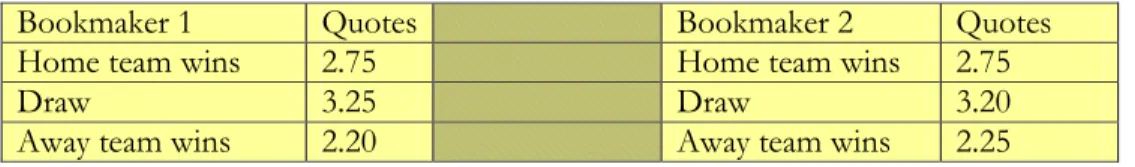
Now assume that the customer who wants to place a bet is faced with two different quotes from two different bookmakers on the market. Which of the bookmakers will the customer choose?
Table 2:4 Competition among bookmakers (Manduchi, 2004)
The customer will choose the best quotes from either bookmaker. That means the quote from bookmaker 1 or 2 in the event of “Home team wins”, the quote from bookmaker 1 in the event of “Draw” and the quote from bookmaker 2 in the event of “Draw” Competi-tion among bookmakers are good for the customers but bad for the bookmakers them self’s, the customers will always chose the worst quote from the bookmakers viewpoint. The bookmaker can avoid this problem by increasing the margin for the implied probabili-ties to reduce the chance of customers playing profitable safe bets. A portfolio that pays for
Outcome Quotes Bet payout
Home team wins 1.66 *B1 =1.66 B1=1
Draw 3.50 *B2 =1.66 B2= 1.66/3.50=0.47
Away team wins 4.33 *B3 =1.66 B3=1.66/ 4.33=0.38
66 . 1 85 . 1 B3) B2 (B1+ + = >
∑
Bookmaker 1 Quotes Bookmaker 2 Quotes
Home team wins 2.75 Home team wins 2.75
Draw 3.25 Draw 3.20
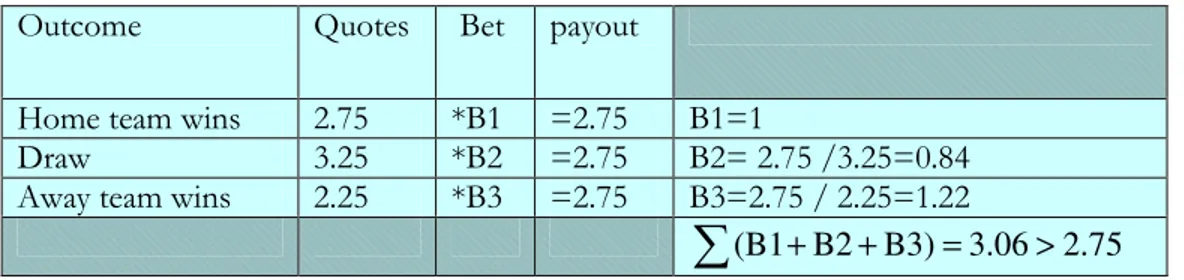
example 2.75 under each event could be constructed. The customer will bet a total of 3.06 and only receive 2.75 back.
∑
(B1+B2+B3)=3.06>2.75. In this case, even if they can chose the best quotes on the market the customers will not be able to place a profitable safe bet.Table 2:5 Constructing a riskless portfolio under competition (Manduchi, 2004)
2.2
Valuation and Fundamental Analysis
Corporate valuation is important when it comes to buying and selling businesses. There also exist other situations when business valuation is crucial for example when it comes to mergers, business strategy evaluations, IPO’s6
, MBO’s7
, stock valuation and capital invest-ments. Corporate valuation can be used by different actors for example managers, individ-ual investors, bankers, analysts and stockholders. Managers have to be aware of the value that the company possesses in order to evaluate different strategies and the effect it has on the corporate value. Creditors use corporate valuation techniques to estimate the risk for a certain company that they are considering loaning money to (Nilsson, Isaksson, Marti-kainen, 2002).
Frykman & Tolleryd (2003) state that when it comes to business valuation the analysis should be differentiated between corporate and equity valuation. The equity value of an en-terprise is equal to the value of the shareholders claims in the company. The equity valua-tion does not include the debt of the company. The corporate value on the other hand consists of the market value of both the company’s debt and equity. Nilsson et al (2002) states that there exist two types of general models when it comes to business valuation: Fundamental and technical analysis. Fundamental analysis is concerned with the valuation of the company or it stocks based on the company’s current financial situation and the ex-pectations of future earnings. There are various ways of doing this as can be seen later. Technical analysis is trying to predict the future development of a stock based on the his-torical development. However, technical analysis will not be discussed any further in this thesis.
Nilsson et al (2002) explain that fundamental analysis can be done on all companies due to the fact that the basic information needed is available in the company’s quarterly or annual rapports. They also state that fundamental analysis that will be the foundation for the prognoses and valuation can be divided into three subgroups: strategic analysis, accounting analysis and financial analysis.
6 Initial public offering, a corporation's first offer to sell stock to the public 7 Management-buy-out, the management purchased the corporation
Outcome Quotes Bet payout
Home team wins 2.75 *B1 =2.75 B1=1
Draw 3.25 *B2 =2.75 B2= 2.75 /3.25=0.84
Away team wins 2.25 *B3 =2.75 B3=2.75 / 2.25=1.22
75 . 2 06 . 3 B3) B2 (B1+ + = >
∑
Further they explain that the purpose of the strategic analysis is to identify factors that in-fluence the profit of the company and to evaluate the risk that the company faces. The stra-tegic analysis is based on a qualitative study and includes a strastra-tegic evaluation and an as-sessment of the company’s business environment. The strategic analysis is the first step in the fundamental analysis.
The aim of the accounting analysis is to measure and report the link between the com-pany’s business activities and accounting procedure. The goal is to determine the quality of the reported numbers, its link to reality and if there is any room for a more flexible inter-pretation. Financial analysis is concerned with the interpretation of the financial numbers to be able to draw conclusions the company’s historical, current and estimated future de-velopment. The main tools are financial ratio and cash-flow analysis (Nilsson et al, 2002). Financial ratios help the external viewer to asses the company’s financial strength and weaknesses. Cash-flow analysis is used to evaluate the company’s liquidity and financial flexibility.
These three steps of the fundamental analysis form the foundation for the business valua-tion. There exist numerous methods when it comes to corporate valuavalua-tion. They can be di-vided into two main categories asset valuation and profit valuation. Asset valuation is con-cerned with the valuation of the company’s debt and assets. Profit valuation is interested in determining the value based on current and future financial estimates (Nilsson et al, 2002).
2.3
Strategic Analysis
The strategic analysis can be said to fulfil two purposes. First to identify and draw conclu-sions about which factors that is affecting the profit of the company both in a negative and positive sense. The second purpose is to identify and evaluate the risk factors that are con-nected to the business of the company. The strategic analysis can be divided into: Specific firm-, competitive-, industry- and environmental-analysis. The SWOT analysis is then used to summarize these findings. The strategic analysis is one of the most important steps in the fundamental analysis due to the fact that it lays the foundation for the corporate value and it is not based on assumptions. Strategic analysis is to most parts qualitative in nature describing the factors that affects the company’s profit and risk. The information from the strategic analysis guides the researcher when it comes to focusing on the important aspects and choosing appropriate financial ratio measurements. The profitability of a firm is de-termined by the structure of the industry but also by the strategic decision taken by the firm (Nilsson et al, 2002).
By identifying the factors that affect the company’s profit and risk a researcher can estimate if the company can maintain its current profitability. One factor can be changes in ex-change rates that might have a large affect on the company’s profit and risk. Future poten-tial profits for a company are determined by the strategic decisions of the company: Which industry the company has chosen to focus on and where the company has decided to posi-tion itself within this industry. Profitability is later quantified and measured in the financial analysis. The focus of competitive companies is on profit maximization, achieving a profit-ability that exceeds the cost of capital for the company. A monopoly company on the other hand can always be profitable due to the lack of competitors. To estimate the company’s future revenues the researcher has to assess the industry profitability through an industry analysis (Hult, 1998).
2.3.1 Specific Firm Analysis
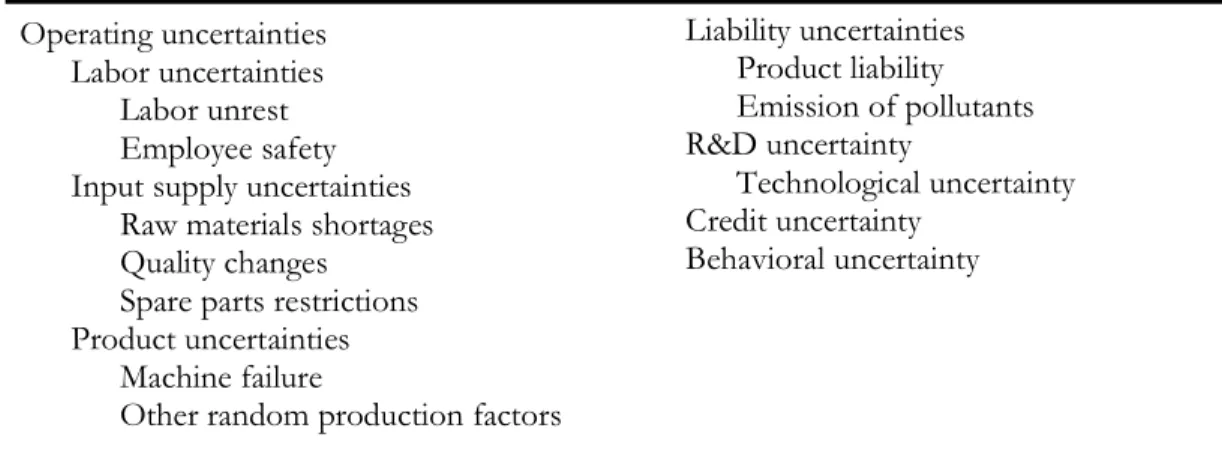
According to Miller (1992) there is uncertainty related to a specific firm. The primary risk categories are presented below and includes operating-, liability-, R&D-, credit- and behav-ioral- uncertainties. Operating uncertainty includes three subcategories: labor-, firm-specific input- and production uncertainty. Labor uncertainty includes changes in employee pro-ductivity due, for example, to labor unrest or strikes. Providing employees with a safe working environment which reduces the personal risk to workers as well as the threat of in-jury related lawsuits directed at the firm. Uncertainty related to specialized labor or other inputs is often firm specific rather than having an effect on the industry in general.
The author further describes that input supply uncertainty is related to the shortage of raw materials and changes in quality of input. Input supply uncertainty is likely to be greater when a single supplier or organized group provides critical inputs to the firm. Williamson (1975) states that negotiation between a firm and a specialized supplier is a bargaining process. The firm should strive to internalize the supplier function to reduce the possibility of opportunistic behavior by suppliers. Product uncertainty includes variations in output due to machine failure. Other random factors such as accidents that disturb the production process are also included in this category. Liability uncertainty is associated with harmful effects due to production or consumption of a company’s products. A product liability is related to unanticipated negative effects associated with the use of a product that can result in legal actions against the company.
R&D uncertainty is related to the uncertainty surrounding the time frame for completing the project, the nature of its output, how it will be valued by the market and technological uncertainty. Technological uncertainty is related to innovation and not knowing when ac-tual or potential rivals will introduce innovations. Innovations affecting a company’s prod-ucts or production process pose a threat because they can offset the current pattern of competition and coordination. Credit uncertainty can be linked to the debt default of cli-ents. This can be a direct cause of variation in the firm’s income streams. Behavioral uncer-tainty is related to the unceruncer-tainty that is associated with the agency relationship within the firm. Fama & Jensen (1983) showed that managers often have incentives to increase their personal wealth at the expenses of the firm’s owners.
Operating uncertainties Labor uncertainties
Labor unrest Employee safety Input supply uncertainties
Raw materials shortages Quality changes
Spare parts restrictions Product uncertainties
Machine failure
Other random production factors
Figure 1:3 Firm Uncertainties (Miller, 1992)
Liability uncertainties Product liability Emission of pollutants R&D uncertainty Technological uncertainty Credit uncertainty Behavioral uncertainty
2.3.2 Knowledge Assets and Competitive Analysis
Eiteman et al (2004) explain that analysts and investors look far beyond the fundamental performances in order to determine the corporate value. Most investors are not as inter-ested in past performances as demonstrated by numbers. The investor is interinter-ested in the prospects for the future and the estimated return on the investment. Investors are looking for managers that will carry out what they are promising. They want clearly defined strate-gies, transparency, measurable results, measurable values and openness. Therefore man-agement should put effort in communicating the company’s vision for the future. Investors are also looking for if the company has a competitive advantage in the form of knowledge assets. Knowledge assets are the company’s intangible assets. There are at least ten catego-ries of knowledge assets:
Nilsson et al, 2002 explain that competitive analysis is used to evaluate the company’s comparative advantage, its competitors and the strategies chosen by the company. A com-pany can create a competitive advantage using for example three different strategies: Cost minimization, differentiation and focusing. The cost minimization strategy is focused on maintaining low cost. Today almost all companies are required to be aware and manage their costs in order to insure the survival and prosperity of the firm. The differentiation strategy is used to ensure the costumers a product or a service that is not offered by other companies. The strategy usually means an opportunity for the company to implement a higher price which reduces the need of low cost production. The focused strategy means that the company is concerned with its sales on a specific customer segment or a specific market. This strategy is popular in industries that are characterized by a high degree of competition.
According to Barney (1995) a sustained competitive advantage cannot be created simply by evaluating environmental opportunities and threats. Creating sustained competitive advan-tages depends on the unique resources and capabilities that a firm possesses to compete in its environment. To discover these resources and capabilities, managers must look inside the firm for valuable, rare and costly-to-imitate resources and the exploit these resources through the organization. A firm’s resources include all financial, physical, human and or-ganizational assets used by the firm. Some questions to answers are: Do our products have value? How easy can our products be imitated? Is the company organized to exploit its re-sources and capabilities? The value of a firm’s rere-sources and capabilities are not constants they are dynamic. They might have added value in the past but changes in for example cus-tomer tastes, industry structures or technology can render them and make them less valu-able in the future.
-Innovation -Technology
-Quality -Brand value
-Customer care -Employee relations
-Management skills -Environmental and community awareness -Alliances - R&D
2.3.3 Industry Analysis
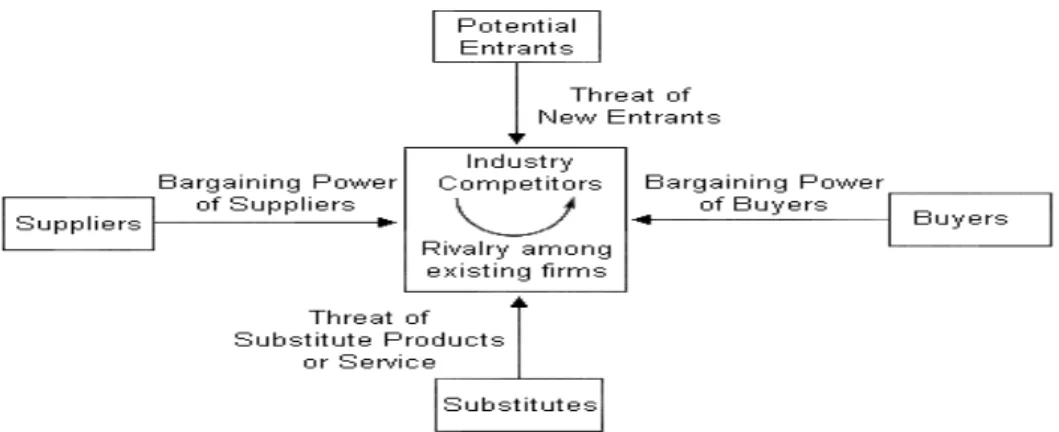
According to Porter (1979) the industry analysis is used to determine the industry’s struc-ture and factors that affect the profitability. The profitability of an industry is determined by five factors; the five force model is illustrated below: The degree of competition be-tween existing companies, the threat of new competitors, the threat of new substitute products, the bargaining power of the customer and the bargaining power of the suppliers. The profitability of an industry can also be affected by market demand. Miller (1992) ex-plains that the industry market demand is related to the current and estimated future de-mand for an industry’s products/services. An unexpected change in dede-mand for an indus-try’s output can have devastating effects. Such a change can be caused by for example a change in consumer tastes, the availability of substitute products and scarcity of comple-mentary products such as for example replacements parts for automobiles. The market demand for a company’s products/ services is one the most important factors for doing business.
Figure 1:4 The five forces model (Porter, 1979)
The total profit within an industry is theoretically speaking a function of the highest price the customer is willing to pay for the company’s products or services. Furthermore, the price of the company’s product and service is determined by the amount of competition in the industry. Highly competitive industries will probable result in low prices which in turn will decrease the profitability. The degree of competition between companies can be de-termined by five factors. The first factor is the growth rate of the industry, for example if the industry is growing the companies do not have to take market shares from each other. The second factor is the degree of concentration, if there are many small players a price war is likely to burst out. Instead, if there are a few large companies the price can to some extent be coordinated and be more stabile (Porter, 1979).
Moreover, a third factor is the degree of differentiated products; if the companies have similar products the only way to compete is by lowering the price. A fourth factor is the degree of economics of scale in the industry, if a company has economics of scale the cost per produced unit decreases and the company will be more likely to compete by lowering its prices. The final factor can be overcapacity; if the supply is bigger than the demand then it is likely that companies will lower their prices in order to sell more products. Mergers and acquisitions are done in order increase the market shares and lower the risk of over produc-tion.
Furthermore, it can be stated that the threat of new competitors is determined by two forces. The first force is the first mover advantage; companies that are first on a market can create competitive advantages which lead to a reduction of the number of new competi-tors. Examples of competitive advantages can be industry standards, contracts with exclu-sive suppliers and distribution channels. Moreover, Porter (1979) also states that the sec-ond factor is legal obstacles, for example patents and laws that limit the number of market participants and licenses. Legal obstacles are considered to be less stabile due to the fact that laws and regulations can change, and patents have a time limit. The threat of new sub-stitute products includes products that are fulfilling the same function and need. When the price of substitute products is low then the probability of a price war will increase and the profitability will be reduced. The last two factors that influence an industry’s profitability are customer bargaining power and supplier bargaining power.
Customer bargaining power is related to the customer’s ability to lower prices, negotiate for higher quality of the products or negotiate for more services for the same price. Two fac-tors are determining the power of the customers related to the industry: The price sensitiv-ity and the bargaining power of the customer. Price sensitivsensitiv-ity is also determined by the quote between the cost of the products and the total cost of the customer purchases. If a customer makes a large purchase with a high cost he/she is more likely to have a high price sensitivity compared to if the cost of buying the product is low. Price sensitivity will on the other hand be low if the quality of the finished product is to a large extent related to the quality of the input commodity. Customer bargaining power is determined by the num-ber of buyers in relation to the numnum-ber of sellers, the volume of the purchase, numnum-ber of substitution products and the cost associated with the switch between these products (Por-ter, 1979).
The supplier’s bargaining power is what is left after the customer’s bargaining power. The suppliers can use its bargaining power on the company with threats of increased prices, de-creased product quality and dede-creased supply of components. Powerful suppliers can in this way reduce the profitability of an industry. Suppliers usually have high bargaining power if the product is an important component for the buyer (Porter, 1979).
2.3.4 Environmental Macro Analysis
Parrish (2005) explains that all businesses and organizations operate in an international and changing environment. Today business activities are subject to forces in the external busi-ness environment that are beyond their control. It is important to understand and identify these uncontrollable factors that surround the corporation. There are several frameworks and checklists for evaluating these factors for example PEST8, DEPICTS9 and ICEDRIPS10
.
The most complete view is obtained if these frameworks are considered together. The number of macroeconomic variables is in reality virtually unlimited. The Pareto11
principle states that eighty percent of the result flows from twenty percent of their causes. Even
8 Political, Economic, Sociological and Technological factors
9Demographics, Economics, Politics, Infrastructure, Competition, Technology and Social
10Innovation, Competition; Economics, Demographics, Regulation, Infrastructure, Partners and Social trend 11 Vilfredo Pareto, 1848-1923, an Italian economist who discovered the Pareto principle that eighty percent of
though the percentages may not always be exact, there is often a trend that the result is caused by a small amount of variables. The firm must prioritize, monitor and evaluate those factors that are relevant and affect its industry. At least ten different categories of en-vironmental factors can influence a corporation and its ability to do business:
• Political uncertainty • Economics factors
• Sociological and cultural factors • Technology factors • Demographics • Infrastructure • Competition • Regulation • Partners • National uncertainty
Bunn & Mustafaoglu (1978) explain that the first category of factors is related to the cal uncertainty associated with changes in the political regime. What is the country’s politi-cal direction? How stable is the politipoliti-cal environment? What are the current tax rates? The second category is economics factors such as inflation, interest rates, stability of exchange rates, public spending, economic growth rate, labour costs, unemployment rate, skill level of the work force and the nations current position is the business cycle.
The third category is sociological and cultural factors such as: religion, attitudes toward for-eign companies, spoken languages, entrepreneurial spirits and social trends for instance the acceptance of new technology, the uses of leisure time and changing beliefs. The fourth category is technology factors, for example recent technology development, technology know how in the country, technology’s impact on products, cost and value chain structures and technological diffusion (Parrish, 2005).
The fifth category is demographics: statistics regarding age, gender, geography, social classes and changes in these. The sixth category is infrastructure, such as telecommunica-tion networks, transportatelecommunica-tion, public services and social structures. The seventh category is competition: What are the national competitors for the firm? Does is exists any substitute products? The eight category is regulation. Current laws, regulations, agreements and con-ventions are all belonging to the eight category. The ninth category is partners: Is there any opportunity to enter any strategic alliances with other companies or organizations? What countries are they trading with? The final category is national uncertainty, for example wars, revolutions, riots, terrorism, hurricanes and earthquakes (Parrish, 2005).
2.3.5 SWOT Analysis
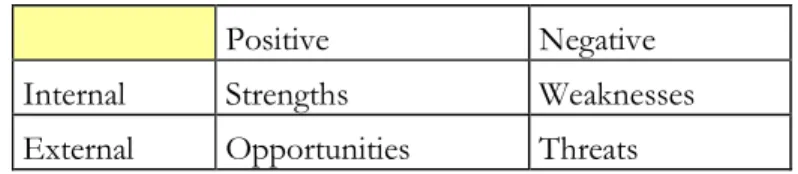
According to Dyson (2003) SWOT analysis stands for strength, weaknesses, opportunities and threats. The aim of the SWOT analysis is to identify the strengths and weaknesses of an organization and the opportunities and threats in the environment. After having identi-fied these forces, strategies are developed to build on the strengths, eliminate the weak-nesses and exploit opportunities and counter threats.
Positive Negative
Internal Strengths Weaknesses
External Opportunities Threats
Table 2:6 Strengths, Weaknesses, Opportunities and Threats (Dyson, 2003)
A firm’s strengths are its resources and capabilities that can be used as a basis for develop-ing a competitive advantage. Examples of such strengths are: Patents, strong brand names, good reputation among customers etc. The absence of certain strengths may be viewed as weaknesses, for example the lack of patent protection, a weak brand and a high cost struc-ture. Examples of opportunities could be: an unfulfilled customer need, new technology, loosening of regulation, removal of trade barriers. Changes in the external environment could also present threats to the firm such as in form of shifts in consumer tastes away from the firm’s products, new regulation and increased trade barriers (Strategic manage-ment, 2005).
2.4
Financial Analysis
2.4.1 Financial Ratio AnalysisAccording to Donohue (2005) financial ratios are useful indicators of a firm’s performance and financial situation. Most ratios can be calculated from the information provided by the financial statements. When financial ratios are used there are a few things to keep in mind. First, a reference point is needed for the ratio to be useful. This reference point can be his-torical values, forecasts or ratios of a similar firm. Second, ratios used alone do not provide meaningful results. They should be used together to more accurately describe the firms situation. Third, ratios are subject to the limitation of accounting methods. Different ac-counting choices may result in different ratio values.
And finally, year-end values may not be representative. Account balances may change due to seasonal factors and may distort the value of the ratio. Therefore an average value should be used when it is possible. Financial ratios can be divided into different categories: Liquidity ratios, solvency ratios, profitability ratios, asset turnover ratios, market value ra-tios and growth rara-tios.
Liquidity ratios provide information about the firm’s ability to meet is short-term financial obligations. If a firm has sufficient cash flows to pay bills it can avoid experiencing financial
distress. Some useful measurements of liquidity are current ratio12 and quick ratio13 (Ross, Westerfield & Jaffe, 2002).
Current ratio = current assets/ current liabilities
Quick ratio = current assets- inventory/ current liabilities
Solidity ratios provide information about the firm’s ability to meet long-term financial obli-gations. The company’s leverage plays an important role here. How much of the company is financed with debt. A high degree of debt leads to a high probability of financial distress. However debt provides a significant tax advantage because interest payments are tax de-ductible. Some useful measurements of leverage are debt-to-asset ratio14
, debt-to equity ra-tio 15
and equity-to-asset ratio 16
(Brealy & Myers, 2003). Debt-to-asset ratio = total debt/ total assets Debt-to-equity ratio = total debt/ total equity Equity-to-asset ratio = total equity/ total assets
A profitability ratio is the classification of ratios that measures the success of the firm to generate profits. Some examples are gross profit margin ratio, returns on assets ratio and return on equity ratio. The gross profit margin considers the firms cost of goods sold but does not include other costs. Return on assets is measuring how efficient a firm`s assets are being used to generate profits. By using DuPont system of financial control you can link different financial ratios together to calculate return on assets. Return on equity measures the profit earned for each dollar invested in the firm’s stock (Donohue, 2005).
Gross profit margin ratio= EBIT17
/ Total operating revenues Return on assets (ROA) ratio = Net income / Total Assets Return on equity (ROE) ratio= Net income/ Shareholder Equity
Asset turnover ratios indicate how efficiently the firm utilizes its assets. Examples of assets turnover ratios are: total assets turnover, receivable turnover and inventory turnover. Total assets turnover measures how effectively a firm is using all its assets. Receivable turnover is an indicator of how quickly the firm collects its account receivables. The ratio is often reported in number of days before they are collected (Donohue, 2005). An inventory turnover is the cost of goods sold in a time period divided by the average inventory level. Because inventory is always stated in terms of historical cost, inventory turnover has to be calculated as cost of goods sold instead of sales (Ross et al 2002).
Total assets turnover = Total revenue/ Total assets
Receivable turnover = Total operating revenue / account receivables Inventory turnover = Cost of goods sold/ average inventory
Dividend policy ratios indicate the current dividends policy of the firm. They can also be used as prospects for future growth. However a high dividend yield does not necessarily 12 In Swedish balanslikviditet 13 In Swedish kassalikviditet 14 In Swedish skuldandel 15 In Swedish skuldsättningsgrad 16 In Swedish soliditet
translates into a high future return. The three most used dividend ratios are dividend yield, payout ratio and retention ratio. Dividend yields are related to the markets perceptions of the future growth for the firm. A firm with high growth prospects will generally have a lower dividend yield (Brealy & Myers, 2003).
Dividend Yield = Dividend per share/ Share price Payout ratio = Dividend per share/ Earnings per share. Retention ratio = Retained earnings/ net income
Retained earnings = Net income - dividends
Market value ratios are used to access the value of a firm. The market value of a common stock of a firm is the market price multiplied by the number of shares outstanding. The market price gives guesses about the true value of the assets of a firm. In an efficient stock market, market prices reflect all relevant facts about the firm revealing the true value of the firm. Three used market value ratios is Price-to-earnings (P/E) ratio and market-to-book (M/B) ratio and Tobin’s Q. The Tobin’s Q differs from m/b ratios due to the fact that it uses the market value of debt and equity and the replacement cost of all assets. Firms with a high Tobin’s Q tend to be those firms with attractive investment opportunities or with significant competitive advantage (Ross et al, 2002).
P/E ratio = market price per share/ earnings per share M/B ratio = market price per share/ book value per share Tobin’s Q = market value assets/ assets replacement value
Growth ratios are very helpful for financial analysts to determine corporate growth. The sustainable growth rate is the maximum rate a firm can maintain by using internal equity only without increasing its financial leverage. Sustainable growth ratio can be calculated as:
Sustainable growth rate = return on equity * Retention ratio
2.4.2 Cost of capital
Eun & Resnick (2003) state that a firm with both debt and equity in its capital structures has a financing cost that is equal to the weighted average cost of capital (WACC). The cost of capital is the expected return to both the equity and the debt holders in the company. WACC is used to measure a firms cost of capital which is the minimum rate of return an investment project must generate in order to increase the company value. If a firm has no debt and only equity then the WACC would be equal to the cost of equity. If a firm has only debt and no equity the firm’s WACC would be equal to the cost of debt. The WACC model looks as follows:
WACC= (E/ (E+ D))*re+ (D/ (E+ D))*rd*(1-t) E/ (E+ D) Equity-to-asset ratio
D/ (E+ D) Debt-to-asset ratio re Cost of equity
rd Cost of debt
McClure (2005) explains that in order to use the WACC model the cost of equity and the cost of debt need to be estimated. The cost of debt is the current market rate that the company is paying on its debt. Interest rates are tax deductible so the net cost of debt is the interest paid less the tax savings resulting from the tax deductible interest payment.
rd (after corporate tax)= rd*(1-t)
Stulz (2003) states that the capital asset pricing model, CAPM, can be used to estimate the company’s cost of equity. The CAPM describes the relationship between risk and expected return. The model was developed by Lintner, Mossin and Sharpe in the 1960’s and has been influenced by Harry Markowitz`s work in portfolio theory. Eun & Resnick (2003) ex-plain that the main difficulty in computing the financial cost of a firm is related to the esti-mated cost of equity (re). The cost of equity is the expected return on the firms stock that the investors require. CAPM states the expected return on a firm’s stock is equals to the risk free rate of return plus a risk premium. The CAPM model looks as follows:
E (re)= rf + B*(E (rm)-rf) E (re) The expected cost of equity
rf The risk-free interest rate18
B The historical volatility of the asset compared to the market portfolio E (rm) The expected return of all assets in the market portfolio
Scleifer & Wishny (1997) state that asset pricing models like CAPM and APT19
provide us with benchmarks to tell us if the returns of an investment is more or less than sufficient given the investments risk exposure. However the power of these benchmarks is rather weak. The long term expected returns of stocks are more complex than the asset pricing models predicts. The market portfolio in the CAPM is stated to include every single capital asset in the economic system and therefore the model can not in reality be accurately tested.
2.5
Cash-flow Valuation
Cash flow models have been more popular since the 1980´s in order to calculate the com-pany’s value with estimated future cash flows. There are several ways to implement the method and there is no standard. Cash flow (CF) is generated by the firm during an opera-tional year. It is a revenue measure which only registers actual inflows and outflows (Hult, 1998). Discounted cash flow (DCF) is the dominating method in USA. According to the DCF model investments adds value if it generates a return on investment above the return that can be earned on investments of similar risk. For internet firms the DCF is regarded as the most accurate method (Copeland, 2000).
18 90 days US Treasury Bills (T-bills) must be considered close to risk free 19 Arbitrage Pricing Model
2.5.1 Shareholder Value Analysis (SVA)
The SVA20 model requires a detailed historical analysis, preferable 3-10 years back in time, of income and balance sheet statements that affect the company’s cash flow (Hult, 1998). This is done in order to understand absolute and relative trends concerning the company. It is important to study how different items in the income statement and balance sheet fluctuate over time and try to understand reasons behind larger changes.
The need for SVA is based on the belief that reported income is not the best measure of a firm’s economic value, since firm specific risk and macroeconomic risk is overlooked. The disadvantage with SVA is that it is hard to gain detailed information about actual cash flows without access to a firm’s internal accounting information.
Cash flow by using SVA is calculated as: Cash flow from operations:
Sales
- Costs from operations - Depreciation expense = EBIT
+/- Taxes = NOPLAT
+ Depreciation expense = Gross Cash flow
EBIT is earnings before interest and taxes.
Working capital: operating current assets – non interest bearing current liabilities. SVA can be divided into four steps (Hult, 1998):
1. Future operating income is estimated. Thereafter future cash flows that are available for shareholders are calculated, e.g. the free cash flow. These cash flows are discounted to pre-sent value. The weighted average capital cost is used as the discount rate.
2. By the end of the forecasted time period the firm has a residual value. The residual value is calculated by the value after taxes (NOPLAT), which should by divided by the chosen discount rate (Copeland, 2000). The residual value is discounted during the valuation pe-riod by using present value.
3. The market value is added by eventual financial assets.
4. From this value (3) the market value of the firm’s liabilities are deducted.
This method is more appropriate for medium sized operating firms rather than firms with heavy assets. In SVA only paid taxes are considered whereas in DCF taxes are adjusted. Moreover, in SVA and with the calculation of cash flows from investments, goodwill is
20 The SVA model is considered to be an alternative view of the traditional DCF model. Cash flow investing activities: +/- Working Capital
+/- Net investments in assets = Gross Investment
treated in the same way as other assets, which is not considered by the traditional DCF model (Hult, 1998).
The DCF model requires complete information about the company in order to make a valuation. The model also takes into consideration effects of different risks. When using DCF the firm’s value in the long run is considered; while for instance the p/e-model usu-ally has a shorter valuation period. DCF has been criticized for making favourable free cash flow calculations in order to increase the stock value (Levin, 1998).
Gärtner & Olbert (1995) explains that Free cash flow (FCF) can be calculated as: Cash flow from operations
- Cash flow to investments + Goodwill
= Free cash flow
All future cash flows are divided into a forecasted time period and a period thereafter to eternity. Thus, the residual value is built on the principle of going concern (Hult, 1998). The present value of cash flows of the latter period is the residual value. The value should reflect a normal year of the forecasted period. Moreover, the size of the residual value is determined by the assumptions of growth during the period. It is important that growth is calculated as an average of the period (Brealy & Myers, 2003). The residual value can be calculated as:
Residual value = Income after taxes / Discount rate.
3
Methodology
In this chapter the empirical process of the thesis will be presented and discussed. We will discuss why we have chosen a case study of Unibet as a method and relate it to current methodology literature. We will also discuss the research quality of our thesis and how data, information and literature have been collected.
3.1
Empirical Process of the Thesis
Based on the Guidelines Regarding Master Thesis (2005), an independent study and use of scientific theory and methods to create and communicate knowledge about corporate valuation that is relevant for the academic discipline of finance will be conducted. Fur-thermore, we will develop our ability to grasp as well as critically, yet constructively, exam-ine academically produced knowledge that is related and significant to our chosen subject, corporate valuation. A company that is appropriate for our need has been selected.
The department of trade and industry (2005) explains that a small company has not more than fifty employees, medium sizes company no more than 250 and a large company has more than 250 employees. The focus on a medium size company with about 95 employees has been chosen for two reasons: To reduce the risk of having too little information to work, with but also reduce the risk of encounter advanced accounting techniques. This is due to the fact that the aim of the thesis is on corporate valuation and not on correctly as-sessing a translation of a corporation’s financial position that for example involves transfer pricing and other accounting methods which aim is not to facilitate the process of estimat-ing the “correct” value.
A fundamental analysis of Unibet is done which in this case for example involves a com-parative study of Unibet’s odds and a DCF simulation with different scenarios regarding Unibet’s future. Appropriate valuation models is selected and based on the company’s strategies, business environment and financial position. The models is applied in order to estimate a value for the company. The above studies will work as a foundation for the es-timated unified analysis of the company that will be presented in the conclusions.
3.2
Methodology Literature and Chosen Method
Saunders, Lewis & Thornhill (2003) explain that there are two types of data, primary and secondary data. Primary data is collected and created for a specific purpose, while the sec-ondary data has been collected for other purposes. Annual report and statistics are consid-ered to be secondary data. Primary data is collected through interviews and surveys. Within business and management, secondary data is used mostly in case studies and survey-type research. Secondary data can include both quantitative and qualitative data that can be used in descriptive and explanatory research.
Also the literature sources can be divided into subgroups: primary, secondary and tertiary. Primary literature is reports, thesis, emails and publications. A Primary literature source is the first occurrence of a piece of work. Secondary literature is aimed for a wider audience. Secondary literature is books, newspapers, journals and Internet. Tertiary literature is ency-clopaedias, dictionaries and catalogues. Tertiary literature or search tools are design to help to locate primary and secondary literature (Saunders et al, 2003).