J
Ö N K Ö P I N GI
N T E R N A T I O N A LB
U S I N E S SS
C H O O L JÖ N KÖ P I N G U N IVER SITYM o t i v a t i o n s f o r L e v e r a g e d B u y o u t s
S y n e r g y, A g e n c y a n d H u b r i s
Master Thesis within International Financial Analysis
Author: Pingjing Bo
Tutor: Agostino Manduchi Sofia Wixe
i
Master Thesis within International Financial Analysis
Title: Motivations for leveraged buyouts: synergy, agency and hubris Author: PingJing Bo
Tutor: Agostino Manduchi Sofia Wixe
Date: August 2013
Key words: Leveraged buyouts, event study, synergy, hubris and agency hypotheses
Abstract
A leveraged buyout (LBO) is a highly leveraged acquisition method with the purpose of taking a firm private. By using an event study, this paper investigates the main motiva-tion of leveraged buyouts (LBOs) in the light of the synergy, agency and hubris hypoth-eses. The synergy hypothesis states that financial improvements are achieved after merging two companies. The agency hypothesis states that at the expenses of share-holders’ profits, the managers in the bidding firms pay prices higher than the market prices to the target firms. The hubris hypothesis states that there are systematical over-payments made by the bidding firms. Using the LBOs deals between the years 2000 and 2012 in the USA, it is found that the dominating motivation for LBOs is the synergy hypothesis, with evidence of a co-existence of the agency hypothesis.
ii
Table of Contents
1.
Introduction ... 1
1.1 Limitations ... 2
2.
Theoretical Framework ... 3
2.1 Leveraged Buyouts and Takeovers ... 3
2.2 Synergy, Agency and Hubris Motives ... 3
2.2.1 Synergy Hypothesis ... 3
2.2.2 Agency Hypothesis ... 4
2.2.3 Hubris Hypothesis ... 5
3.
Data and Methodology ... 6
3.1 Data ... 6
3.2 Methodology ... 7
3.2.1 Event Study ... 7
3.2.2 Bidding Gain, Target Gain and Total Gain ... 10
3.2.3 Linear Regressions ... 11
3.3 Empirical Hypotheses ... 11
4.
Empirical Results and Interpretations ... 13
4.1 Abnormal Returns ... 13
4.1.1 Target Firms ... 14
4.1.2 Bidding Firms ... 14
4.2 Testing the hypotheses ... 16
4.2.1 Descriptive Statistics of Target Gain, Bidding Gain, and Total Gain ... 16
4.2.2 Results for Linear Regressions ... 16
5.
Conclusion ... 18
6.
References ... 19
iii
List of Tables
Table 1: Data information ... 6
Table 2: Empirical hypotheses for synergy, agency and hubris ... 12
Table 3: Sum of abnormal returns from -10-day to +10-day ... 15
Table 4: Descriptive statistics of target gain, bidding gain, and total gain ... 16
Table 5: Robust standard error for regression results of target, bidding and total gain .. 17
Table 6: Names of companies and the rumor dates of LBOs ... 22
Table 7: Estimators of intercepts and slope coefficients in the market model ... 23
Table 8: Unit root tests for market model estimations ... 24
Table 9: Diagnostic tests for market model estimations ... 26
Table 10: Heteroskedasticity tests for estimated regressions ... 27
Table 11: Abnormal returns ... 28
Table 12: t-statistical values and t-critical values for abnormal returns ... 29
List of Figures Figure 1: Abnormal returns for target firms ... 14
1
1. Introduction
In the corporate sector, a takeover is a change in the controlling interest of a corporation. Synergy, agency and hubris hypotheses are considered as the three major motivations for takeovers. The synergy hypothesis suggests that economic gains occur after merging the resources of two firms. The agency hypothesis suggests that managers in acquiring firms attempt to chase self-interests during takeovers, and this usually harms their shareholders' profits. The hubris hypothesis suggests that the managers in bidding firms are making systematical mistakes in evaluating the values of target firms in takeovers. Some previous scholars agree that the main motivation for takeovers is the synergy, and the agency hypothesis is the main motivation for value-reduction acquisitions (Berkovitch & Narayanan, 1993; Nguyen, Yung & Sun, 2013). Other researchers find that the predominant explanation for foreign acquisitions is the synergy hypothesis, with a co-existence of the hubris hypothesis (Seth, Song & Pettit, 2000; Porter & Singh, 2010).
Based on previous researchers’ approaches, the main motivation of leveraged buyouts (LBOs) under synergy, agency and hubris hypotheses are identified in this paper.
A LBO is an example of a hostile takeover. It is a highly leveraged acquisition organiza-tional form, which aims to take a firm private by purchasing its shares, and allocating them to a concentrated organizational membership. The term highly leveraged refers to high debts and equities. According to earlier studies, most of the possible motivations of LBO’s fall into one of these following categories: improving the performance of organ-izational management, increasing tax shields, and reducing political costs (Jensen, 1989; Kaplan & Strömberg, 2008). Managers of incumbent firms participate in most LBOs, due to the fact that the managers in incumbent firms hold the monitoring rights. This gives them opportunities to adopt active investors’ monitoring strategies, so they can pursue self-interest regardless of other shareholders (Edgerton, 2012). Jensen (1989) gives definition on what is the active investors in 1989. He states that the active inves-tors actually monitor management. They can get involved in dismissing management, and in the companies’ strategic direction (Jensen, 1989). Usually, after a successful lev-eraged buyout, acquirers pay a price above the market value to the target shareholders.
2
Due to this higher payment, shareholders in pre-LBO receive extra gains, thus they can usually earn extra premiums which are higher than their market prices (Fox &Marcus, 1992; Guo, Hotchkiss & Song, 2011). Departing from all these motivations of LBOs, a different approach is taken in this paper to investigate the main motivation of LBOs in line with the hypotheses of synergy, agency and hubris.
The main method applied to approach the empirical question in this paper is the event study. Based on it, I firstly estimate the abnormal returns for bidding firms and target firms through employing the market model for LBOs deals from 2000 to 2012 in the USA. In general, there are a number of deals in this period, however, most of the bid-ding and target companies are not listed, or most of the bidbid-ding firms are listed only af-ter the completion of one LBO. Therefore, there are19 deals that can be taken into ac-count for the estimations.
Secondly, based on the results of abnormal returns, bidding gain, target gain, and total gain can be constructed. The gain refers to the profit the firm makes in relation to the LBO. Subsequently, tests can be developed to identify the main motivation of LBOs in the light of the three hypotheses: synergy, agency, and hubris. The correlations among them are used to determine the dominating motivation. Bidding gain, target gain and to-tal gain are expected to positively correlate with each other in the synergy hypothesis. In the agency hypothesis, target gain is expected to negatively correlate with both total gain and bidding gain, whereas total gain and bidding gain are expected to be positively correlated. In the hubris hypothesis, no correlation between bidding and total gain, no correlation between target gain and total gain, but negative correlation between target gain and bidding gain are expected.
1.1
Limitations
In order to investigate the dominating motivation in LBOs, cross-section regressions are constructed. However, due to the presence of heteroskedasticity, the conclusions this paper draws based on the results must be taken with caution.
3
2. Theoretical Framework
In this section, I review the relations between LBOs and takeovers. After distinguishing the differences and similarities, the relations between LBOs and the three hypotheses are discussed.
2.1 Leveraged Buyouts and Takeovers
The general term of takeover is the transfer of control rights from one group of share-holders to another. The term “takeover” can generally refer to a friendly takeover, a hos-tile takeover, and a reverse takeover. The general purposes of a takeover are: acquisi-tion, proxy contests and going private (Hillier et al. 2010). A takeover with acquisition purpose refers to the bidding firms buying the common stock shares of the target firms. A takeover with proxy contests purpose occurs when the bidding firms attempt to per-suade shareholders in the target firms to use their proxy votes to gain controlling seats on the direct board. Lastly, a takeover with going private purpose refers to a small group of investors purchasing the equity shares of a public firm, and the public firm delists from the stock exchange market after the completion of the takeover.
LBOs are usually referred to as hostile takeovers with the purpose of taking a firm pri-vate. Unlike a merger, which requires the voting approvals from the target firms’ share-holders and the target firms’ board, a hostile takeover can give the bidding firms the control rights of voting without the approval of management groups in the target firms (Jarrell, 2002).
2.2 Synergy, Agency and Hubris Motives
Within this section, the descriptions of synergy, agency, and hubris motives takeovers, as well as the relations between LBOs and them are given.
2.2.1 Synergy Hypothesis
As stated by Penrose (2009), a firm's long-run profits and its productive opportunities are closely associated. Under this statement of firm growth, the synergy hypothesis is proposed (Seth et al., 2000). According to this hypothesis, mergers and acquisitions are conducted with the purpose of increasing market power, accelerating operational effi-ciency and increasing the financial gains (Singh & Montgomery, 1987; Seth, 1990; Chatterjee, 1992). Indeed, there are evidences that these improvements can also be
4
found in post-LBO firms. These evidences include the increasing in cash flows, operat-ing profits, and net cash flow of investments. Also, the capital expenditures and income taxes decreases (Billett, Jiang & Lie, 2010). Besides the improvements in operational efficiency, synergy motives increase the target firms’ gains as well. Due to the increas-ing gains, target firms become more competitive in the market (Berkovitch & Nara-yanan, 1993). The above suggests that takeovers under the synergy hypothesis only take place when the shareholders from both bidding and target firms profits, thus, bidders as well as target firms will yield positive gains, and a positive total gain.
Therefore, the total gain is positively correlated with both bidding gain and target gain, while target gain and bidding gain is positively correlated to each other (Berkovitch & Narayanan, 1993; Seth et al., 2000; Medla, Rottke & Shiereck, 2012).
2.2.2 Agency Hypothesis
The agency hypothesis states that in takeovers managers in bidding firms sacrifice their shareholders’ profits in order to pursue their own interest (Berkovitch & Narayanan, 1993). Managers are most likely to seek higher assets growth rates, rather than in profit growth rates, since the managerial compensation is related to the assets under their con-trols (Byrd & Hickman, 1992). This evidence is also supported by Seth et al. (2000) and Nguyen et al. (2012) who found that managers make higher bids in takeovers at the ex-pense of their shareholders' profits in order to maximize their own utility; or to diversify their human capital risks. The human capital risks refers to events and employees be-haviors that affect firms’ operational performances and financial results. Chava, Kumer and Warga (2010) illustrate that with the purpose of enhancing the dependence of the firms on managers’ own skills, managers will disregard the consequences of firms’ val-ue reduction when takeovers take place. In the case of LBOs, these problems still ap-pear. Holthausan and Larcker (1996) criticized that studies which support the improve-ments of economic gains in post-LBOs that do not take into consideration time effects. They claim that there are changes in managerial and leveraged equity ownerships as time changes. In addition, due to improved incentive systems, despite the high profits, managers are also under the threat of losing jobs in the event of poor performances (Clacher, Hillier & McColgan, 2010), hence managers may take actions to keep the jobs by hurting other shareholders’ interest (Tirole, 2006). For instance, they may choose
5
low return projects with lower risks, which eventually will reduce the values of firms. Due to the reductions in firms’ values, gains for shareholders will also decline.
Therefore, the total gain is negatively correlated with target gain whereas the total gain is positively correlated with bidding (Seth et al., 2000) gain, while target gain and bid-ding gain is negatively correlated to each other (Porter & Singh, 2010).
2.2.3 Hubris Hypothesis
Unlike the synergy hypothesis, the hubris hypothesis is proposed under the assumption that managers are making systematic bidding mistakes. Roll (1986) claims that if all bidders are aware of systematic bidding mistakes of overpaying, there would be no suc-cess bids. But if bidders are infected by hubris, the bid values would be above the target firms’ market values. This conclusion is also approved by many researchers (Berkvoitch & Narayanan, 1993; Aktas, Bodt & Roll, 2009), who indicate that the increase in the target firms’ gain is accompanied by a decrease in the bidding firms’ gain, so that the total gains would be zero. In LBOs, shareholders from target firms gain profits in pre-LBOs, as evidence provided by Palepu (1990) and Han, Suk, and Sung (1998) shows, gains of pre-buyout investors wealth can be contributed by the systematic overpayment of the post-buyout investors, whereas the return for the debt and equity investors in LBOs are likely to be substantially low. The term systematic overpayment refers to the situation when the post-buyout investors automatically pay an extra amount to the pre-buyout investors.
Therefore, there is no correlation between total gain and target gain, and no correlation between total gain and bidding gain, while the bidding gain and target gain is negatively correlated (Seth et al., 2000; Porter & Singh, 2010).
6
3. Data and Methodology
This section shows the descriptions of data applied in this paper as well as the proce-dures of conducting an event study.
3.1 Data
The stock prices for bidding and target firms cannot be obtained unless they are listed. Since in this paper, the event study is conducted using stock prices, only listed firms are compatible with this approach. The deals of LBOs as well as the information of them are obtained from Amadeus. It is a database containing financial information for public and private companies. The stock prices for firms in LBOs are available in Thomsom Reuters, which can be downloaded directly. The market indexes for each firm are down-loaded from Yahoo finance. The number of shares outstanding for firms are collected from the companies’ quarterly annual reports for both bidders and targets. In Table 1, I provide a more detailed description on the data information.
Table 1: Data information
Data Information Country of Bidding and Target Firms USA
Year From 2000 to 2012
Status of Target Firms Listed
Status of Bidding Firms Listed
Number of LBOs 19 LBOsa
Variables and Data Sources
Variables Data Source
Names of Target Firms Amadeus (Bureau van Dijk)
Name of Bidding Firms Amadeus (Bureau van Dijk)
Stock Prices of Bidding Firms Datastream (Thomsom Reuters) Stock Prices of Target Firms Datastream (Thomsom Reuters)
Market Index Yahoo Finance
Shares Outstanding of Bidding and Target Firms Quarterly Annual Reports a. there are 4 targets with 2 bidders. In the regression estimations, the weighted
aver-age gain is applied, thus 19 deals are adopted.
According to Amadeus, there are 23 LBOs from the 2000 to 2012 in the USA, within these deals, the targets and bidders are listed companies. The names of these companies are given in the Table 6 (see Appendix). Additionally, two points are needed to be
men-7
tioned about data collecting. Firstly, in this paper, I only focus on how the target gain, bidding gain and total gain are affected and correlated triggered by the rumors of LBOs. A brief explanation on the term ‘rumors of LBOs’ is presented in the following section. Thus, I disregard whether the LBOs are completed or not. Secondly, among the 23 LBOs deals, there are 4 targets that have 2 bidders (the names for these targets are given in Table 6). In these cases, the weighted average gain for the 2 bidders in each of these 4 cases is taken into account instead of individual bidding gain. For instance, if a target has two bidders, then the two bidders are considered to be one bidder by using the method of weighted average gain. The formula for calculating weighted average gain is presented in Equation 9 (see Appendix). Therefore, when conducting the regression es-timations, there are 19 deals.
3.2 Methodology
This section exhibits the procedures of abnormal returns. Based on the results of ab-normal returns, the linear correlations of bidding gain, target gain, and total gain are constructed.
3.2.1 Event Study
Event study is a method to analyze the effects of a specific economic event on the value of firms by using financial market data. Based on the idea of market rationality, the se-curity prices immediately reflect the impact of a given event (Mackinlay, 1997). The null hypothesis of the event study is: H1: the given events (in this case, the rumors of
LBOs) have no impact on the stock returns. Unlike the direct measurement of
produc-tivity after the occurrence of an economic event, event study uses security prices over a relatively short time period. After Fama et al. (1969) studied how stock prices were af-fected by the announcement of increasing the share numbers in a public company in 1969, the event study has become the leading methodology in determining how the se-curity returns are affected by an event (Boehmer, Musumeci & Poulsen, 1991). The procedures of an event study are (Mackinlay, 1997, p.14-15):
Determining of the “event window”: the very first step is to state the event of interest, and the periods over the firms’ security prices evolved in this event should be identified;
8
Selection criteria: after identifying the event window, the selection criteria of inclusive a given firm should be clarified;
Abnormal return: event study requires the measurement of abnormal returns, which equals to “the actual ex post return of security over the event window
minus the normal return of the firm over the event window”, accordingly, it is
the difference between the actual security return and the expected return of that security. The expected return can be referred as the market return;
Modeling the normal return: normally, there are two alternatives to model the normal return, ‘constant mean return model’ and ‘market model’;
Definition of the estimation window: after adopting the ideal model, the estima-tion window needs to be defined, using the former period of the event window for the estimation window is the most common way when to define the estima-tion window;
Estimation results: the last step is to estimate the model and interpret the esti-mation results.
Among these procedures, the market model is a statistical model which relies on the as-sumption that there is a linear relationship between the return on any security and the re-turn of the market portfolio (Mackinlay, 1997), the formation of market model is pre-sented as follows:
Equation 1:
𝑅𝜏′ = 𝛼 + 𝛽𝑅𝑚𝜏′+ 𝐴𝑅𝜏′
In Equation 1,for each estimated firm, 𝑅𝜏′is the actual return in time period 𝜏′which can be calculated by using the stock prices: 𝑅𝜏 =𝑃𝜏−𝑃𝜏−1
𝑃𝜏−1 .𝑅𝑚𝜏′is the return of market portfo-lio for each firm. The return of market portfoportfo-lio refers to the market return. 𝐴𝑅𝜏′is the abnormal return which is the excess return earned by the investors which are triggered by an event or an announcement. It can be referred to the disturbance term of the market model. α, β are the intercept and slope coefficient. It should be noted that in this paper, the market model is a time series regression model, after estimating the market model, the parameters estimated for each firm can be obtained.
9
The estimated market model is shown in Equation 2.
Equation 2:
𝑅𝜏′ = 𝛼̂ + 𝛽̂𝑅𝑚𝜏′+ 𝐴𝑅𝜏′
The estimators of α and β, the 𝛼̂ and 𝛽̂ for the estimation window (τ’) can be obtained after estimating the estimated market model (Equation 2). Then, by re-arranging Equa-tion 1, the abnormal returns for each firm in the event window (τ) can be calculated on an out of sample basis by substituting estimators estimated from Equations 2 into Equa-tion 3.
Equation 3:
𝐴𝑅𝜏 = 𝑅𝜏 − 𝛼̂ − 𝛽̂𝑅𝑚𝜏
After conducting the abnormal returns, the null hypothesis of event study (H1) can be
tested. It can be rejected if the statistical value is larger than the critical value. The t-statistics value for each abnormal return in target and bidding firms are calculated as: abnormal return divided by standard deviation of abnormal return.
As Seth et al. (2000), and Kolari and Pynnönen (2010) conduct their analyses based on a day event window, I choose to follow the previous researchers’ steps. Thus, a 21-day event window is conducted. The event date within the event window for each LBO is the rumor date. This is the date on which the deal was first mentioned, as far as Amadeus researchers can ascertain1. The event window is comprised of the stock prices -10 days (10 days before) and +10 days (10 days after) of the rumor dates for both the bidding firms and the target firms. For each rumor, the 252 trading-day period prior to the event window is used as the estimation window.
There are two reasons for choosing the rumor date as the event date instead of the an-nouncement date and the completion date. Firstly, as mentioned previously, firms
1In the following texts, the rumor date is set as the event date. It refers to the date when the LBO was first
10
come private after the successes of LBOs, therefore the target firms are delisted after completions of LBOs. Consequently, it would be impossible to find the stock prices, es-pecially, the stock prices 10 days after the completion dates. Secondly, for some LBOs deals, the announcement dates and completion dates are on the same days, which lead to the results of no data available for the 10 days after the announcement dates.
3.2.2 Bidding Gain, Target Gain and Total Gain
After estimating the abnormal returns of stock prices of bidding and target firms for each LBO deals. For each bidding firm and target firm, the gains for them after 21 trad-ing days can be calculated through Equation 6 and Equation 7 (Seth et al., 2000):
Equation 6: 𝑇𝑎𝑟𝑔𝑒𝑡 𝐺𝑎𝑖𝑛𝑡= 𝑆−11𝑡𝑎𝑟𝑔𝑒𝑡 𝑓𝑖𝑟𝑚∗ 𝑃−11𝑡𝑎𝑟𝑔𝑒𝑡 𝑓𝑖𝑟𝑚∗ ∑ 𝐴𝑅𝑖𝜏 10 𝜏=−10 Equation 7: 𝐵𝑖𝑑𝑑𝑖𝑛𝑔 𝐺𝑎𝑖𝑛𝑡 = 𝑆−11𝑏𝑖𝑑𝑑𝑖𝑛𝑔 𝑓𝑖𝑟𝑚∗ 𝑃−11𝑏𝑖𝑑𝑑𝑖𝑛𝑔 𝑓𝑖𝑟𝑚∗ ∑10 𝐴𝑅𝑖𝜏 𝜏=−10
The total gain for each LBO deal equals to the sum of gain to targets and bidders in the event window (see Equation 6 and 7), and Equation 8 shows the formation of the total gain.
Equation 8:
𝑇𝑜𝑡𝑎𝑙 𝐺𝑎𝑖𝑛𝑡 = 𝑇𝑎𝑟𝑔𝑒𝑡 𝐺𝑎𝑖𝑛𝑡+ 𝐵𝑖𝑑𝑑𝑖𝑛𝑔 𝐺𝑎𝑖𝑛𝑡
Where in all these equations presented in this section, t is the event window (t= -10, -9, -8,..., 8, 9, 10). S is the number of shares outstanding, and P is the stock price. ∑10 𝐴𝑅𝑖𝑡
𝑡=−10 is the sum of abnormal return for the target firms and bidding firms in the event window. The idea behind the constructions of Equation 6 and Equation 7 is to set the stock market values (share price * number of shares outstanding) for bidding and target firms on the -11-day as the benchmark. So that the gains for bidders and the tar-gets triggered by the rumors of LBOs can be estimated. The estimation approach is to
11
multiply the stock market values on the -11-day and the sum of the abnormal returns in the interval of the event window (see Equation 6 and Equation 7).
3.2.3 Linear Regressions
Following the method developed by Berkovitch and Narayanan (1993), and the extend-ed method constructextend-ed by Seth et al. (2000), and Porter and Singh (2010), simple linear regression models based on the event study are established in order to investigate the main motivation of LBOs. The idea behind the setting up of the linear regression mod-els is to examine the correlations among bidding gain, target gain and total gain. These regressions are developed based on the 19 LBOs deals. The gains are obtained from Section 3.2.2. The estimated regressions are estimated by applying Eviews 7, and the linear regressions are formed as Regression1, Regression2, and Regression3. These re-gressions are estimated by using cross-section data, where cross-section data are data on one or more variables collected at the same point in time (Gujarati & Porter, 2009). In these cases, the point of time is one day prior to the event window, and the cross-section variables are the total gain, bidding gain and the target gain for target firms and bidding firms in 19 LBOs deals.
𝑇𝑎𝑟𝑔𝑒𝑡 𝐺𝑎𝑖𝑛i = 𝛼1+ 𝛽1∗ 𝐵𝑖𝑑𝑑𝑖𝑛𝑔 𝐺𝑎𝑖𝑛𝑖+ 𝜃 Regression 1 𝑇𝑎𝑟𝑔𝑒𝑡 𝐺𝑎𝑖𝑛i = 𝛼2+ 𝛽2∗ 𝑇𝑜𝑡𝑎𝑙 𝐺𝑎𝑖𝑛𝑖 + 𝛿 Regression 2
𝐵𝑖𝑑𝑑𝑖𝑛𝑔 𝐺𝑎𝑖𝑛𝑖 = 𝛼3+ 𝛽3∗ 𝑇𝑜𝑡𝑎𝑙 𝐺𝑎𝑖𝑛𝑖 + 𝛾 Regression 3 Where in these regressions, 𝛼𝑛 is the intercept, 𝛽𝑛 is the slope coefficient and n=1,2,3. θ, δ, γ are the disturbance terms.
3.3 Empirical Hypotheses
To investigate the motivation of LBOs, the empirical hypotheses are divided into two approaches. One is by estimating the mean level of total gain, bidding gain and target gain in the Descriptive Statistics, another is by estimating the correlations of total gain, bidding gain and target gain in the Linear Regressions.
According to the hypotheses developed by Berkovitch and Narayanan (1993), the fol-lowing relationships among total gain, bidding gain and target gain are studied, where Table 2 demonstrates these relationships:
12
Table 2: Empirical hypotheses for synergy, agency and hubris
Total Gain Target Gain Bidding Gain
Synergy Hypothesis Increase Increase Increase Agency Hypothesis Decrease Increase Decrease
Hubris Hypothesis Zero Increase Decrease
Source: Berkovitch and Narayanan (1993)
From Table 2, the following empirical hypotheses based on the descriptive statistics and linear regressions are developed to investigate the main motivation of LBOs (Seth et al., 2000; Porter & Singh, 2010).
Under the synergy hypothesis, firms are expected to achieve the financial improvements after the takeovers. Therefore, the synergy hypothesis predicts an increasing gain in both target firms and bidding firms, thus an increasing in total gains. In the case of LBOs, if the LBOs are primarily motivated by synergy, then H2: There will be a
posi-tive total gain on average in LBOs; a non-negaposi-tive gain on average to bidders; and a positive gain on average to targets. There will be a positive correlation between the to-tal gain and the bidding gain; a positive correlation between the toto-tal gain and the tar-get gain; and a positive correlation between the bidding gain and the tartar-get gain.
Under the agency hypothesis, at the expenses shareholders’ profits, managers in bidding firms pay higher than the market prices to the target firms in order to chase self-interests. Therefore, the agency hypothesis predicts an increasing gain in target firms, and a de-creasing gain in bidding firms, where there is a dede-creasing in the total gain. In the case of LBOs, if the LBOs are primarily motivated by agency, the H3: There will be negative
total gain on average in LBOs; a negative gain on average to bidders; and a positive gain on average to targets. There will be a positive correlation between the total gain and the bidding gain; a negative correlation between the total gain and the target gain; and a negative correlation between the bidding gain and the target gain.
Under the hubris hypothesis, managers in bidding firms are unaware of the overpay-ments. Once the bidding mistakes are recognized, there would be no success bids. Therefore, the hubris hypothesis predicts an increasing gain for target firms, and a de-creasing gain in bidding firms, thus a zero total gain in combination. In the case of LBOs, if the LBOs are primarily motivated by hubris, then H4: There will be zero total
13
gain on average in LBOs; a negative gain on average to bidders; and a positive gain on average to targets. There will be no correlation between the total gain and the bidding gain; no correlation between the total gain and the target gain; and a negative correla-tion between the bidding gain and the target gain.
4. Empirical Results and Interpretations
In this section, the results of the empirical analyses of the event study, the results for the descriptive statistics and the results for the linear regression analyses are given.
4.1 Abnormal Returns
Following the steps constructed in Section 3.2.1, before estimating the abnormal re-turns, it is necessary to obtain the estimators in Equation 2. The estimators of intercepts and slope coefficients for each firm are presented in Table7 (see Appendix).Since the equation is estimated in time series form, tests results on stationarities as well as diag-nostic tests are given in Table 8 and Table 9 (see Appendix).
As can be observed, all the estimators of slope coefficients are statistically significant at the 1% level, except one insignificant case. By using the estimated intercepts and the slope coefficients, the abnormal returns for the bidding firms and the target firms within the event window can be obtained through Equation 3. The statistical results of abnor-mal returns are presented in Table 11 (see Appendix). The statistical as well as the t-critical values are presented in Table 12 (see Appendix).
As can be observed in Table 12, except one case, all the abnormal returns for the target firms are statistically significant either on the event date or on one day prior and one day after the event date, since most t-statistical values on the event date are greater than the t-critical values. These significance results can reject the null hypothesis of event study (H1). Thus, we can conclude that the given events, the rumors of LBOs do have impact on the stock prices for most of the target firms. While not all the abnormal returns for the bidding firms on event date, or on one day prior and one day after the event date are statistically significant, since some t-statistical values are smaller than the t-critical val-ues. Therefore, we can conclude that for those insignificant results, the given events, the rumors of LBOs have no impact on the stock prices for the bidding firms. Graphical
in-14
terpretations on abnormal returns for the bidding firms and the target firms are illustrat-ed in the following sections.
4.1.1 Target Firms
Figure 1 illustrates the abnormal returns for target firms. Within this figure, all the col-umns represent the abnormal returns for each target firm. On the horizontal axis, the “0”stands for the rumor date. It can be seen that there were strong responses of the ab-normal returns for almost all firms one day before and one day after the release of ru-mors of LBOs. It can also be observed that some targets’ abnormal returns started to ad-just about 7 days, 5days and 2 days before the rumors. After releasing the rumors, most of the prices decreased to its original levels.
Figure 1: Abnormal returns for target firms
4.1.2 Bidding Firms
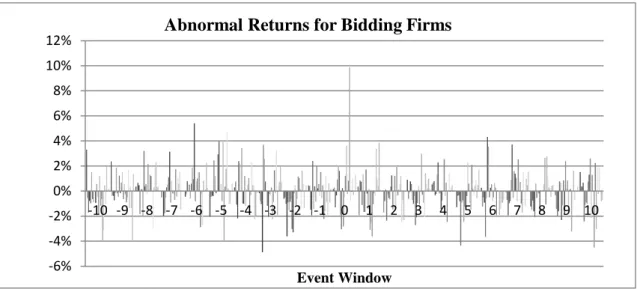
Figure 2shows the abnormal returns for the bidding firms. Within this figure, all the columns represent the abnormal returns for each bidding firm. There was no substantial increase in the bidders abnormal returns except one case in the event date for one of the bidding firm. Additionally, significantly increasing or decreasing trend can be observed, most of these fluctuates moved randomly.
-10% -5% 0% 5% 10% 15% 20% 25% 30% -10 -9 -8 -7 -6 -5 -4 -3 -2 -1 0 1 2 3 4 5 6 7 8 9 10 Event Window
15
Figure 2: Abnormal returns for bidding firms
Before moving to the next section, for the purposes of estimating the Regression 1, Re-gression 2, and ReRe-gression 3, it is necessary to show the results of sum of abnormal re-turns from -10-day to +10-day for the targets and the bidders, namely, the results of ∑10 𝐴𝑅𝑖𝑡
𝑡=−10 for bidding firms and target firms (shown in Table 3). Subsequently, the bidding gain, the target gain and the total gain can be obtained by plugging the results shown in Table 3 into Equation 6, Equation 7, and Equation 8.
Table 3: Sum of abnormal returns from -10-day to +10-day
Sum of Abnormal Returns from -10-day to +10-day LBOs Deals Target Firms (∑10𝑡=−10𝐴𝑅𝑖𝑡) Bidding Firms (∑10𝑡=−10𝐴𝑅𝑖𝑡) LBO 1 0.0911 0.0433 LBO 2 0.0911 -0.1036 LBO 3 0.0870 -0.1136 LBO 4 0.1206 -0.2036 LBO 5 0.4279 -0.0888 LBO 6 0.1265 0.0876 LBO 7 0.1755 0.0449 LBO 8 0.1603 -0.0547 LBO 9 -0.0975 0.0362 LBO 10 -0.0975 0.0131 LBO 11 0.1251 0.0033 LBO 12 0.1251 -0.0084 LBO 13 0.1303 0.0607 LBO 14 -0.0239 0.0197 LBO 15 0.2957 -0.0203 LBO 16 0.0808 -0.0467 -6% -4% -2% 0% 2% 4% 6% 8% 10% 12% -10 -9 -8 -7 -6 -5 -4 -3 -2 -1 0 1 2 3 4 5 6 7 8 9 10 Event Window
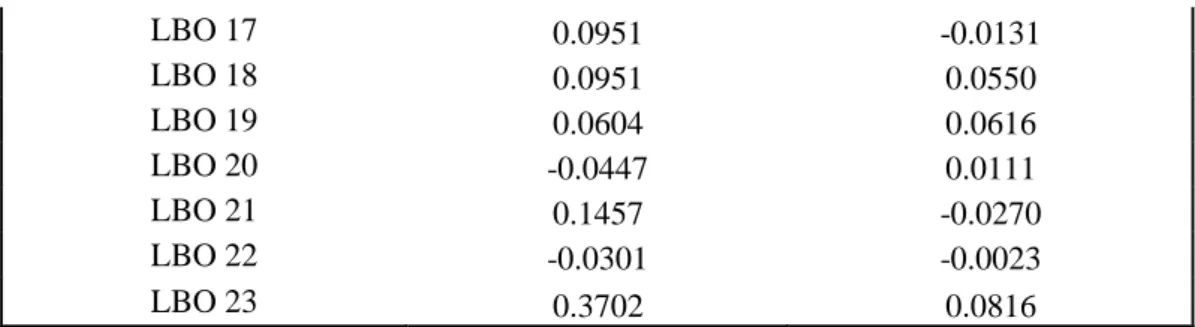
16 LBO 17 0.0951 -0.0131 LBO 18 0.0951 0.0550 LBO 19 0.0604 0.0616 LBO 20 -0.0447 0.0111 LBO 21 0.1457 -0.0270 LBO 22 -0.0301 -0.0023 LBO 23 0.3702 0.0816
4.2 Testing the hypotheses
Given the results of total gain, bidding gain, and target gain for each bidder and target in the 19 LBOs, by using the regressions constructed in Section 3.2.3, the hypotheses (H2, H3, and H4) constructed in Section 3.3 are estimated within this section. As mentioned previously, the hypotheses are tested both through the descriptive statistics results and the linear regressions’ results, thus, within this section, the results of statistical descrip-tion, and the regressions’ results are presented.
4.2.1 Descriptive Statistics of Target Gain, Bidding Gain, and Total Gain
The descriptive statistics for target gain, bidding gain, and total gain for the 23 LBOs are shown in Table 4. It can be noticed that the mean target gain is 946.8641 million USD; the mean bidding gain is 95.2136 million USD; and the mean of total gain is 1042.0778 million USD. These results seem to be in line with the synergy hypothesis (H2), if the LBOs are primarily motivated by synergy hypothesis, then there will be ap-positive total gain on average in LBOs, a non-negative gain on average to bidders; and a positive gain on average to targets.
Table 4: Descriptive statistics of target gain, bidding gain, and total gain
Descriptive Statistics of Target Gain, Bidding Gain, and Total Gain for Bidding and Target Firms
Sample Mean Median Minimum Maximum Skewness
No. of Obs. Target Gain (million USD) 946.8641 464.5433 -936.0616 4108.9121 1.1953 19 Bidding Gain (million USD) 95.2136 -0.1818 -2341.1892 4313.6471 1.8928 19 Total Gain (million USD) 1042.0778 463.4165 -1793.2673 7017.5631 1.3756 19
4.2.2 Results for Linear Regressions
Since the estimated regressions are cross-section data regressions, the result of White’s test for heteroskedasticity is presented in Table 10 (see Appendix). As can be noticed
17
that there exists heteroskedasticity in Regression 2 and Regression 3. Due to the pres-ence of heteroskedasticity, all estimations are conducted with the Robust Standard
Er-ror.
The estimation results for Regression 1 in Table 5 show the results of the correlation be-tween bidding gain and target gain, for the 19 LBOs deals. The correlation bebe-tween bidding gain and target gain is positive but the estimated coefficient is not statistically significant with the t-statistic value of 1.2838.
The estimation results for Regression 2 in Table 5 present the results of the correlation between total gain and target gain, for the 19 LBOs deals. The total gain and target gain is positively correlated and statistically significant at the 1% significance level: the es-timator of β2 is 0.5496. This correlation is consistent with the synergy hypothesis (H2). The estimation results for Regression 3 in Table 5 show the results of the regression for total gain and bidding gain, for the entire sample of 19 LBOs deals. The correlation be-tween total gain and bidding gain is positive and statistically significant: the estimator of β3 is 0.4504. The estimation results are consistent with the synergy and the agency hypotheses (H2 and H3).
Table 5: Robust standard error for regression results of target, bidding and total gain
Robust Standard Error for Regression Results of Target, Bidding and Total Gain Estimated regression αn βn Std. Error of βn t-statistic R-Squared No. of Obs. Regression 1 914658669 0.3382 0.2635 1.2838 0.0883 19 Regression 2 374185333 0.5496 0.08868 3.5199*** 0.6931 19 Regression 3 374185333 0.4504 0.1561 2.8851*** 0.6028 19
***Significance at 1% level (t-critical=2.508)
To sum up the results in Table 4 and Table 5, the synergy is the main motivation of LBOs, while the agency hypothesis is co-existing with the synergy hypothesis. And these conclusions are consistent with the assumptions made by Berkovitch and Nara-yanan (1993), and Seth et al. (2000) on takeovers, and cross-border acquisitions that the synergy is the main motivation, with the co-existence of agency hypothesis.
18
5. Conclusion
By studying the estimated results of abnormal returns for the target firms and the bid-ding firms, I constructed tests to evaluate the main motivation of LBOs in the light of synergy, agency and hubris hypotheses. In this paper, the deals of 19 LBOs are collect-ed from 2000 to 2012 in the USA.
To identify the main motivation of LBOs, the descriptive statistics and the correlations among bidding gain, target gain, and total gain have been applied. The synergy hypoth-esis expects that bidding gain, target gain and total gain are all positively correlated with each other. The agency hypothesis expects that bidding gain and target gain are nega-tively correlated, the total gain and bidding gain are expected to have a positive correla-tion, and the total gain and target gain is expected to have no correlation. The hubris hypothesis expects that there is no correlation between bidding gain and total gain as well as no correlation between target gain and total gain, the bidding gain and target gain are expected to be negatively correlated. It is found that the average total gain, av-erage bidding gain and the avav-erage target gain are positive which support the synergy hypothesis. The correlation between total gain and target gain is positive, indicating that the synergy hypothesis is dominating in the motivations of LBOs, while there is some evidence that agency motivations also exist in the motivations of LBOs.
However, due to the data limitations, only a small number of LBOs could be collected. Increasing the sample size in future estimations can provide more reliable results and conclusions.
19
6. References
Aktas, N., Bodt, E.D., & Roll, R. (2009). Learning, hubris and corporate serial acquisi-tions. Journal of Corporate Finance, 15(5), p.543-561.
Anderson, R.I., Medla, H., Rottke, N.B., & Schiereck, D. (2012). Real estate merger motives: an analytical review of the literature. Journal of Real Estate literature, 20(1), p.37-47.
Berkovitch E. & Narayanan, M.P. (1993). Motives for takeovers: an empirical investi-gation. The Journal of Financial and Quantitative Analysis, 28(3), 347-362.
Billett, M.T., Jiang, Z., & Lie, E. (2010). The effects of change-in-control covenant on takeovers: evidence from leveraged buyouts. Journal of Corporate Finance, 16(1), p.1-15.
Boehmer, E., Masumeci, J., & Poulsen, A. (1991). Event study methodology under con-ditions of event-induced variance. Journal of Financial Economics, 30(2), 253-272. Byrd, J.W., & Hickman, K.A. (1992). Do outside directors monitor managers: evidence from tender offer bids. Journal of Financial Economics, 32(2), 195-221.
Chatterjee, S. (1992). Sources of value in takeovers: synergy or restructuring---implications for target and bidder firms. Strategic Management Journal, 13(4), 267-286.
Chava, S., Kumer, P., & Warga, A. (2010). Managerial agency and bond covenants.
Re-view of Financial Studies, 23(3), p.1120-1148.
Clacher, I., Hillier, D., & McColgan, P. (2010). Agency theory: incomplete contracting and ownership structure. In H.K. Baker & R. Anderson (Eds.), Corporate governance:
a synthesis of theory, research, and practice (p.141-156). USA: John Wiley & Sons Inc.
Clark, S. (2010). Insider trading and financial economics: where do we go from here?
Stanford Journal of Law, Business & Finance, 16(1), p.43-99.
Corrado, C.J. (2011). Event studies: a methodology review. Accounting and Finance,
51(1), 207-234.
Duso, T., Gugler, K., & Yurtoglu, B. (2010). Is the event study methodology useful for merger analysis? A comparison of stock market and accounting data. International
Re-view of Law and Economics, 30(2), p.186-192.
Edgerton, J. (2012). Agency problems in public firms: evidence from corporate jets in leveraged buyouts. The Journal of Finance, 67(6), p.2187-2213.
Elton, E.J., Gruber, M.J., Brown, S.J, & Goetzmann, W.N. (2011). Modern portfolio
theory and investment analysis. United States: John Wiley & Sons.
Fama, E.F., Fisher, L., Jensen, M.C., & Roll, R. (1969).The adjustment of stock prices to new information. International Economic Review, 10.
20
Fox, I., & Marcus, A. (1992).The causes and consequences of leveraged management buyouts. The Academy of Management Review, 17(1), 62-85.
Gilson, S.C. (1989). Management turnover and financial distress. Journal of Financial
Economics, 25(2), 241-262.
Gujarati, D.N., & Porter, D.C. (2009). Basic econometrics. New York: McGraw-Hill. Guo, S., Hotchkiss, E.S., & Song, W. (2011). Do buyouts (still) create value? The
Jour-nal of Finance, 66(2), p.479-517.
Harder, S. (2010). The efficient market hypothesis and its application to stock markets. Germany: GRIN Verlag.
Hillier, D.J, Ross, S.A., Westerfirld, R.W., Jaffe, J., & Jordan, B.D. (2010). Corporate
Finance. New York: McGraw-Hill Irwin.
IHS EViews (2011). EViews (Version 7.0) [Computer software] USA: HIS Inc.
Jarrell, G.A. (2002). Takeovers and leveraged buyouts. Retrieved 2013-05-01, from http://www.econlib.org/library/Enc1/TakeoversandLeveragedBuyouts.html
Jensen, M.C. (1989). Active investors, LBOs and the privatization of bankruptcy.
Jour-nal of Applied Corporate Finance, 2(1), p.35-44.
Jensen, M.C. (1989). Eclipse of the public corporation. Harvard Business Review, 1-29. Kaplan, S.N., & Strömberg, P. (2008). Leverage buyouts and private equity. The
Na-tional Bureau of Economic Research, No. 14207.
Kolari, J.W., & Pynnönen, S. (2010). Event study testing with cross-sectional correla-tion of abnormal returns. Review of Financial Studies, 23(11), p.3996-4025.
Lau, B., & Proimos. (2010). The underperformance of equity-financed bidders.
Interna-tional Journal of Managerial Finance, 6(1), p.4-23.
Mackinlay, A.C. (1997). Event studies in economics and finance. Journal of Economic
Literature, 35(1), 13-39.
Mehran, H., & Peristiani, S. (2010). Financial visibility and the decision to go private.
Review of Financial Studies, 23(2), p.519-547.
Nguyen, H.T., Yung, K., & Sun, Q. (2012). Motivations for mergers and Acquisitions: ex-post market evidence from the US. Journal of Business Finance & Accounting, 39(9-10), p.1357-1375.
Palepu, K.G. (1990). Consequences of leveraged buyouts. Journal of Financial
Eco-nomics, 27(1), 247-262.
Penrose, E. (Ed). (2009). The theory of the growth of the firm. New York: Oxford Uni-versity Press.
Porter, J., & Singh, H. (2010). What factors drive takeovers in Australia? International
21
Roll, R. (1986). The hubris hypothesis of corporate takeovers. The Journal of Business,
59(2), 197-216.
Seth, A. (1990). Sources of value creation in acquisition: an empirical investigation.
Strategic Management Journal, 11(6), 431-446.
Seth, A. (1990). Value creation in acquisition: a re-examination of performance issues.
Strategic Management Journal, 11(2), 99-115.
Seth, A.S., Song, K.P., & Pettit, R. (2000). Synergy, managerialism or hubris? An em-pirical examination of motives for foreign acquisition of U.S. firms. Journal of
Interna-tional Business Studies, 31(3), 387-405.
Shleifer, A., & Vishny, R. (1986). Greenmail, white knights, and shareholders’ interest.
The RAND Journal of Economics, 17(3), 293-309.
Singh, H., & Montgomery, C.A. (1987). Corporate acquisition strategies and economic performance. Strategic Management Journal, 8(4), 377-386.
Tirole, J. (Ed). (2006). The theory of corporate finance. United Kingdom: Princeton University Press.
22
7. Appendix
Within this section, I firstly demonstrate the names of bidding firms and target firms. Then the estimators, the unit root tests and the diagnostic tests for the market model. Thirdly, the results of average abnormal returns, cumulative average abnormal returns are presented. Fourthly, the formula for calculating weighted average gain is given. Fifthly, I give the results of White’s test for heteroskedasticity on the cross-section re-gressions. Lastly, the results of abnormal returns, t-statistic and t-critical values for ab-normal returns are showed.
The null hypothesis for unit root is: H0: there is no unit root. It can be rejected with P-value exceeds the 5% significance level.
There are two diagnostic tests proceeded: Breusch-Godfrey autocorrelation test (null hypothesis: there is no serial correlation of any order), Breusch-Pagan-Godfrey het-eroskedasticity test (null hypothesis: there is homoscedasticity).
Table 6: Names of companies and the rumor dates of LBOs
Names and the Rumor dates for Target Firms and Bidding Firms of 23 LBOs Deals LBOs
Deals Rumor Dates Targets Bidders
LBO 1 2012-12-03 DELL INC. BLACKSTONE GROUP LP.
LBO 2 2012-12-03 DELL INC. KKR & CO. LP.
LBO 3 2005-10-05 SOURCECORP INC. APOLLO MANAGEMENT LP.
LBO 4 2005-09-22 LINENS' N THIGHS INC. APOLLO MANAGEMENT LP.
LBO 5 2011-07-27 EMDEON INC. BLACKSTONE GROUP LP.
LBO 6 2006-07-24 HCA INC. KKR & CO. LP.
LBO 7 2007-01-29 LAUREATE EDUCATION
INC. KKR & CO. LP.
LBO 8 2007-02-26 TXU CORPORATION KKR & CO. LP.
LBO 9 2012-07-31 LABORATORY
CORPORATION KKR & CO. LP. LBO 10 2012-07-31 LABORATORY
CORPORATION BLACKSTONE
LBO 11 2012-08-22 KAR AUCTION SERVICES INC.
APOLLO MANAGEMENT LP.
LBO 12 2012-08-22 KAR AUCTION SERVICES
INC. KKR & CO. LP.
LBO 13 2012-05-16 ALLSCRIPTS HEALTHCARE
23
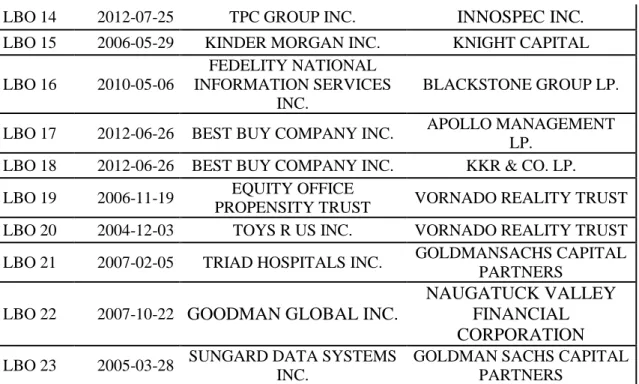
LBO 14 2012-07-25 TPC GROUP INC. INNOSPEC INC.
LBO 15 2006-05-29 KINDER MORGAN INC. KNIGHT CAPITAL LBO 16 2010-05-06
FEDELITY NATIONAL INFORMATION SERVICES
INC.
BLACKSTONE GROUP LP. LBO 17 2012-06-26 BEST BUY COMPANY INC. APOLLO MANAGEMENT
LP. LBO 18 2012-06-26 BEST BUY COMPANY INC. KKR & CO. LP. LBO 19 2006-11-19 EQUITY OFFICE
PROPENSITY TRUST VORNADO REALITY TRUST LBO 20 2004-12-03 TOYS R US INC. VORNADO REALITY TRUST LBO 21 2007-02-05 TRIAD HOSPITALS INC. GOLDMANSACHS CAPITAL
PARTNERS LBO 22 2007-10-22 GOODMAN GLOBAL INC.
NAUGATUCK VALLEY FINANCIAL CORPORATION LBO 23 2005-03-28 SUNGARD DATA SYSTEMS
INC.
GOLDMAN SACHS CAPITAL PARTNERS
Table 7: Estimators of intercepts and slope coefficients in the market model
Estimators of Intercepts and Slope Coefficients for the Market Models (252 observations for each firm)
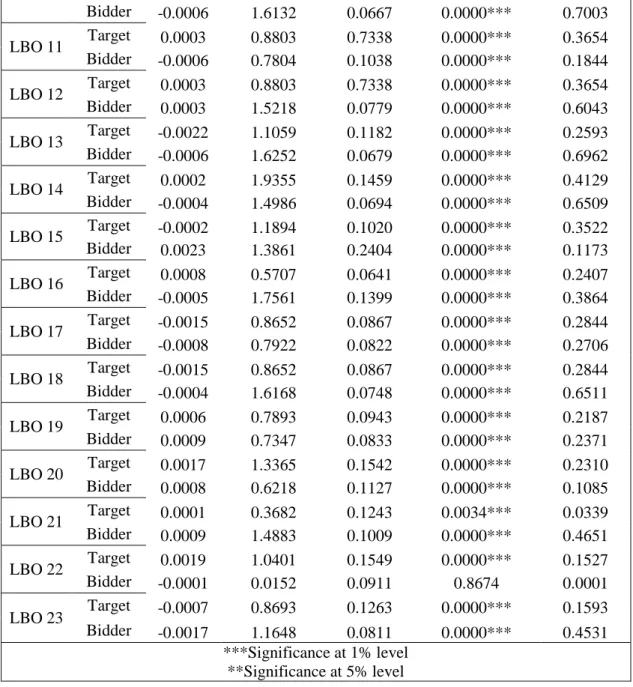
α̂ 𝛽̂ Standard Deviation p-value for 𝛽̂ R-Squared LBO 1 Target -0.0017 0.3801 0.1130 0.0009*** 0.0433 Bidder -0.0002 1.0682 0.1076 0.0000*** 0.2829 LBO 2 Target -0.0017 0.3801 0.1130 0.0009*** 0.0433 Bidder 0.0005 0.6790 0.0723 0.0000*** 0.2605 LBO 3 Target -0.0003 0.5191 0.2068 0.0127** 0.0246 Bidder 0.0014 0.8569 0.1155 0.0000*** 0.1803 LBO 4 Target -0.0007 1.4837 0.1907 0.0000*** 0.1949 Bidder 0.0012 0.6584 0.1155 0.0000*** 0.1149 LBO 5 Target -0.0002 0.6960 0.1035 0.0000*** 0.1532 Bidder 0.0009 1.3408 0.1079 0.0000*** 0.3818 LBO 6 Target -0.0006 0.4415 0.0947 0.0000*** 0.0799 Bidder -0.0005 0.2815 0.0866 0.0013*** 0.0405 LBO 7 Target -0.0002 0.4185 0.1317 0.0017*** 0.0388 Bidder 0.0003 0.7279 0.1000 0.0000*** 0.1748 LBO 8 Target 0.0001 0.9815 0.1567 0.0000*** 0.1355 Bidder 0.0005 0.8329 0.1040 0.0000*** 0.2042 LBO 9 Target 0.0004 0.7567 0.0426 0.0000*** 0.5583 Bidder 0.0003 1.5824 0.0754 0.0000*** 0.6379 LBO 10 Target 0.0004 0.7567 0.0426 0.0000*** 0.5583
24 Bidder -0.0006 1.6132 0.0667 0.0000*** 0.7003 LBO 11 Target 0.0003 0.8803 0.7338 0.0000*** 0.3654 Bidder -0.0006 0.7804 0.1038 0.0000*** 0.1844 LBO 12 Target 0.0003 0.8803 0.7338 0.0000*** 0.3654 Bidder 0.0003 1.5218 0.0779 0.0000*** 0.6043 LBO 13 Target -0.0022 1.1059 0.1182 0.0000*** 0.2593 Bidder -0.0006 1.6252 0.0679 0.0000*** 0.6962 LBO 14 Target 0.0002 1.9355 0.1459 0.0000*** 0.4129 Bidder -0.0004 1.4986 0.0694 0.0000*** 0.6509 LBO 15 Target -0.0002 1.1894 0.1020 0.0000*** 0.3522 Bidder 0.0023 1.3861 0.2404 0.0000*** 0.1173 LBO 16 Target 0.0008 0.5707 0.0641 0.0000*** 0.2407 Bidder -0.0005 1.7561 0.1399 0.0000*** 0.3864 LBO 17 Target -0.0015 0.8652 0.0867 0.0000*** 0.2844 Bidder -0.0008 0.7922 0.0822 0.0000*** 0.2706 LBO 18 Target -0.0015 0.8652 0.0867 0.0000*** 0.2844 Bidder -0.0004 1.6168 0.0748 0.0000*** 0.6511 LBO 19 Target 0.0006 0.7893 0.0943 0.0000*** 0.2187 Bidder 0.0009 0.7347 0.0833 0.0000*** 0.2371 LBO 20 Target 0.0017 1.3365 0.1542 0.0000*** 0.2310 Bidder 0.0008 0.6218 0.1127 0.0000*** 0.1085 LBO 21 Target 0.0001 0.3682 0.1243 0.0034*** 0.0339 Bidder 0.0009 1.4883 0.1009 0.0000*** 0.4651 LBO 22 Target 0.0019 1.0401 0.1549 0.0000*** 0.1527 Bidder -0.0001 0.0152 0.0911 0.8674 0.0001 LBO 23 Target -0.0007 0.8693 0.1263 0.0000*** 0.1593 Bidder -0.0017 1.1648 0.0811 0.0000*** 0.4531 ***Significance at 1% level **Significance at 5% level
Table 8: Unit root tests for market model estimations
Unit root tests for market modelsa
unit root tests: Levin, Lin& Chu t*
Statistic Prob. LBO 1 Target -29.2952 0.0000 Bidder -28.1403 0.0000 LBO 2 Target -29.2952 0.0000 Bidder -29.8452 0.0000 LBO 3 Target -31.2997 0.0000 Bidder -31.4831 0.0000 LBO 4 Target -27.577 0.0000
25 Bidder -31.2543 0.0000 LBO 5 Target -27.0344 0.0000 Bidder -26.1497 0.0000 LBO 6 Target 27.1902 0.0000 Bidder -27.217 0.0000 LBO 7 Target -27.5015 0.0000 Bidder -20.0748 0.0000 LBO 8 Target -21.7949 0.0000 Bidder -19.8504 0.0000 LBO 9 Target -22.357 0.0000 Bidder -23.6574 0.0000 LBO 10 Target -22.357 0.0000 Bidder -19.7701 0.0000 LBO 11 Target -25.1034 0.0000 Bidder -26.4267 0.0000 LBO 12 Target -25.1034 0.0000 Bidder -21.2008 0.0000 LBO 13 Target -20.0883 0.0000 Bidder -12.328 0.0000 LBO 14 Target -25.8418 0.0000 Bidder -22.7948 0.0000 LBO 15 Target -27.7351 0.0000 Bidder -28.2855 0.0000 LBO 16 Target -27.093 0.0000 Bidder -22.8763 0.0000 LBO 17 Target -25.5165 0.0000 Bidder -16.7018 0.0000 LBO 18 Target -25.5165 0.0000 Bidder -25.2761 0.0000 LBO 19 Target -24.4542 0.0000 Bidder -24.3923 0.0000 LBO 20 Target -26.6837 0.0000 Bidder -26.7393 0.0000 LBO 21 Target -20.4347 0.0000 Bidder -21.9978 0.0000 LBO 22 Target -22.9519 0.0000 Bidder -30.6341 0.0000 LBO 23 Target -26.0076 0.0000 Bidder -24.3259 0.0000
26
Table 9: Diagnostic tests for market model estimations
Diagnostic tests for Market Models
Breusch-Godfrey Serial Cor-relation LM Test Prob.
Chi-Square(2) Heteroskedasticity Test: Breusch-Pagan-Godfrey Prob. Chi-Square(1) LBO 1 Target 0.1371 0.6591 Bidder 0.6442 0.0614 LBO 2 Target 0.1371 0.6591 Bidder 0.0170* 0.0321 LBO 3 Target 0.0352* 0.0101* Bidder 0.5600 0.3188 LBO 4 Target 0.5391 0.9177 Bidder 0.1121 0.5258 LBO 5 Target 0.9348 0.1838 Bidder 0.3155 0.0065* LBO 6 Target 0.2802 0.5109 Bidder 0.9120 0.2552 LBO 7 Target 0.0258* 0.3034 Bidder 0.4137 0.6309 LBO 8 Target 0.0788 0.0507 Bidder 0.3224 0.7227 LBO 9 Target 0.2330 0.3065 Bidder 0.5469 0.0095 LBO 10 Target 0.2330 0.3065 Bidder 0.3143 0.1505 LBO 11 Target 0.6943 0.6702 Bidder 0.1014 0.8477 LBO 12 Target 0.6943 0.6702 Bidder 0.7525 0.8115 LBO 13 Target 0.0476* 0.6946 Bidder 0.9100 0.4429 LBO 14 Target 0.5800 0.0017* Bidder 0.1371 0.0782 LBO 15 Target 0.8339 0.1505 Bidder 0.8290 0.0089* LBO 16 Target 0.2697 0.7140 Bidder 0.0078* 0.2761 LBO 17 Target 0.1357 0.7236 Bidder 0.7802 0.6580 LBO 18 Target 0.1357 0.7236 Bidder 0.4988 0.2077
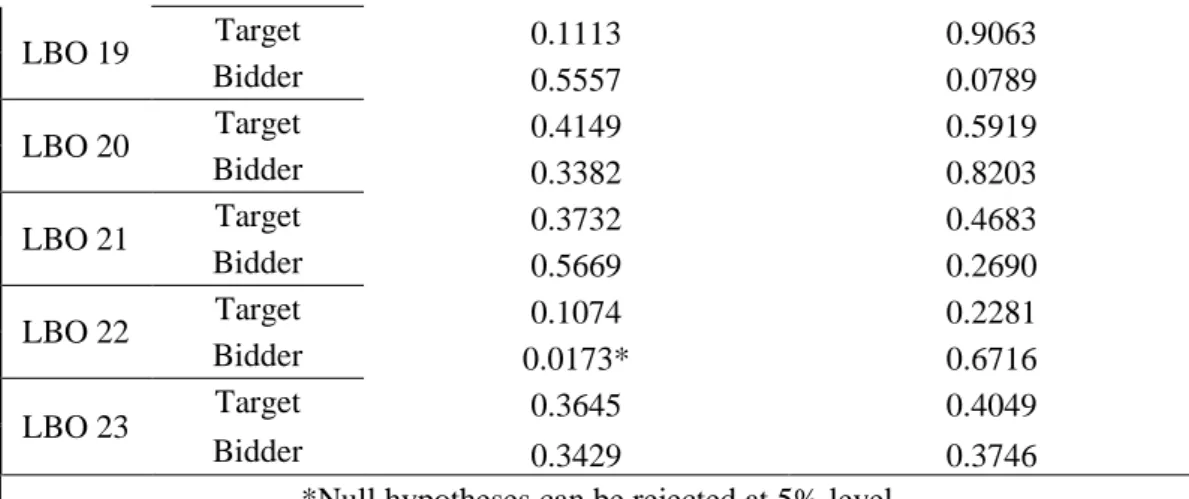
27 LBO 19 Target 0.1113 0.9063 Bidder 0.5557 0.0789 LBO 20 Target 0.4149 0.5919 Bidder 0.3382 0.8203 LBO 21 Target 0.3732 0.4683 Bidder 0.5669 0.2690 LBO 22 Target 0.1074 0.2281 Bidder 0.0173* 0.6716 LBO 23 Target 0.3645 0.4049 Bidder 0.3429 0.3746
*Null hypotheses can be rejected at 5% level
Equation 9: Weighted Average Gain
𝐺𝑎𝑖𝑛𝑏𝑖𝑑𝑑𝑒𝑟 1∗ 𝑋𝑏𝑖𝑑𝑑𝑒𝑟 1
(𝑋𝑏𝑖𝑑𝑑𝑒𝑟 1+ 𝑋𝑏𝑖𝑑𝑑𝑒𝑟 2)+ 𝐺𝑎𝑖𝑛𝑏𝑖𝑑𝑑𝑒𝑟 2 ∗
𝑋𝑏𝑖𝑑𝑑𝑒𝑟 2 (𝑋𝑏𝑖𝑑𝑑𝑒𝑟 1+ 𝑋𝑏𝑖𝑑𝑑𝑒𝑟 2) Where Gain is the bidding gain on the -11-day. X equals to the stock price times the number of shares outstanding on the -11-day
Table 10: Heteroskedasticity tests for estimated regressions
Heteroskedasticity Test Results: White’s test Estimated regression prob. Chi-square (2)
Regression 1 0.7268
Regression 2 0.0026*
Regression 3 0.0026*
28 E v e n t W in d o w L B O 1 L B O 2 L B O 3 L B O 4 L B O 5 L B O 6 L B O 7 L B O 8 L B O 9 L B O 1 0 L B O 1 1 L B O 1 2 L B O 1 3 L B O 1 4 L B O 1 5 L B O 1 6 L B O 1 7 L B O 1 8 L B O 1 9 L B O 2 0 L B O 2 1 L B O 2 2 L B O 2 3 -1 0 -0 ,0 7 3 6 -0 ,0 7 3 6 -0 ,0 0 6 2 -0 ,0 0 8 9 -0 ,0 1 0 5 0 ,0 1 0 9 0 ,0 0 0 2 0 ,0 0 7 0 -0 ,0 2 7 3 -0 ,0 2 7 3 0 ,0 1 3 9 0 ,0 1 3 9 -0 ,0 2 1 2 -0 ,0 1 1 1 0 ,0 1 6 3 0 ,0 0 6 4 0 ,0 1 7 8 0 ,0 1 7 8 -0 ,0 0 4 5 -0 ,0 1 5 8 -0 ,0 1 0 1 -0 ,0 0 5 1 0 ,0 0 3 5 -9 0 ,0 2 4 2 0 ,0 2 4 2 -0 ,0 1 3 9 0 ,0 0 6 4 0 ,0 0 4 9 -0 ,0 1 2 3 0 ,0 0 4 6 0 ,0 0 3 6 0 ,0 0 7 9 0 ,0 0 7 9 -0 ,0 0 9 6 -0 ,0 0 9 6 0 ,0 0 5 7 -0 ,0 0 2 7 -0 ,0 0 2 2 -0 ,0 0 4 8 -0 ,0 2 4 6 -0 ,0 2 4 6 -0 ,0 1 3 0 0 ,0 1 3 7 0 ,0 0 4 2 -0 ,0 2 2 7 -0 ,0 0 0 8 -8 -0 ,0 1 3 9 -0 ,0 1 3 9 0 ,0 2 7 0 0 ,0 4 9 1 -0 ,0 0 9 0 -0 ,0 0 4 4 0 ,0 1 2 1 -0 ,0 0 1 6 -0 ,0 6 1 2 -0 ,0 6 1 2 0 ,0 0 3 1 0 ,0 0 3 1 0 ,0 2 3 3 0 ,0 1 8 9 0 ,0 2 3 9 -0 ,0 0 3 3 0 ,0 1 3 8 0 ,0 1 3 8 -0 ,0 0 3 3 -0 ,0 1 0 8 -0 ,0 0 4 0 0 ,0 0 4 1 -0 ,0 1 2 0 -7 0 ,0 0 8 3 0 ,0 0 8 3 -0 ,0 0 8 8 0 ,0 2 9 1 -0 ,0 0 7 4 0 ,0 0 6 3 0 ,0 0 7 1 0 ,0 0 3 0 -0 ,0 2 4 2 -0 ,0 2 4 2 0 ,0 2 4 0 0 ,0 2 4 0 0 ,0 1 4 9 -0 ,0 2 5 8 -0 ,0 0 0 2 -0 ,0 0 8 6 0 ,0 0 3 3 0 ,0 0 3 3 0 ,0 0 5 3 -0 ,0 0 8 2 0 ,0 0 1 1 -0 ,0 3 0 1 0 ,0 0 2 8 -6 0 ,0 5 0 2 0 ,0 5 0 2 0 ,0 2 8 1 0 ,0 8 9 9 -0 ,0 0 2 2 0 ,0 1 3 7 0 ,0 2 6 7 -0 ,0 1 1 6 -0 ,0 0 2 5 -0 ,0 0 2 5 0 ,0 1 2 2 0 ,0 1 2 2 0 ,0 1 0 2 0 ,0 0 6 4 -0 ,0 0 2 5 0 ,0 4 8 3 -0 ,0 0 9 8 -0 ,0 0 9 8 0 ,0 1 0 8 -0 ,0 0 1 7 -0 ,0 0 7 2 0 ,0 0 6 5 0 ,0 0 2 8 -5 0 ,0 4 2 9 0 ,0 4 2 9 -0 ,0 0 1 9 0 ,0 0 7 7 0 ,0 0 3 3 0 ,0 0 5 1 0 ,0 2 0 1 -0 ,0 0 0 1 0 ,0 0 8 1 0 ,0 0 8 1 0 ,0 0 1 6 0 ,0 0 1 6 0 ,0 1 6 8 -0 ,0 1 5 8 0 ,0 1 0 4 0 ,0 0 7 2 0 ,0 1 1 5 0 ,0 1 1 5 0 ,0 0 6 7 -0 ,0 1 0 5 0 ,0 2 3 3 0 ,0 1 9 4 0 ,2 5 1 7 -4 -0 ,0 1 5 5 -0 ,0 1 5 5 0 ,0 2 7 3 -0 ,0 2 7 8 0 ,0 0 3 9 -0 ,0 1 7 2 0 ,0 0 9 0 0 ,0 0 3 6 -0 ,0 0 4 0 -0 ,0 0 4 0 -0 ,0 0 2 9 -0 ,0 0 2 9 0 ,0 1 2 7 -0 ,0 2 0 0 -0 ,0 1 1 8 -0 ,0 0 8 6 0 ,0 0 6 4 0 ,0 0 6 4 0 ,0 0 5 3 -0 ,0 0 7 1 -0 ,0 0 8 1 -0 ,0 4 8 3 0 ,0 3 1 0 -3 -0 ,0 0 7 6 -0 ,0 0 7 6 0 ,0 1 4 4 -0 ,0 0 8 7 0 ,0 1 1 1 -0 ,0 0 0 6 -0 ,0 1 9 2 -0 ,0 1 4 5 -0 ,0 0 5 9 -0 ,0 0 5 9 -0 ,0 0 1 0 -0 ,0 0 1 0 0 ,0 1 2 2 -0 ,0 0 2 0 0 ,0 0 7 4 -0 ,0 0 5 7 -0 ,0 1 8 0 -0 ,0 1 8 0 -0 ,0 0 2 7 0 ,0 0 0 8 -0 ,0 0 7 4 -0 ,0 2 9 9 -0 ,0 0 8 4 -2 0 ,0 0 0 2 0 ,0 0 0 2 0 ,0 0 0 8 -0 ,0 0 0 6 -0 ,0 0 6 1 0 ,1 0 8 1 0 ,0 1 0 3 0 ,0 2 7 9 -0 ,0 1 3 3 -0 ,0 1 3 3 -0 ,0 0 7 7 -0 ,0 0 7 7 0 ,0 0 9 5 -0 ,0 1 5 0 -0 ,0 0 8 4 0 ,0 0 1 8 -0 ,0 1 9 2 -0 ,0 1 9 2 0 ,0 0 4 3 0 ,0 0 3 6 0 ,0 1 3 7 -0 ,0 2 4 3 0 ,0 0 7 2 -1 -0 ,0 0 6 4 -0 ,0 0 6 4 -0 ,0 1 1 7 -0 ,0 3 2 1 0 ,0 0 1 6 -0 ,0 0 3 2 0 ,0 0 9 1 0 ,0 4 2 5 -0 ,0 0 3 3 -0 ,0 0 3 3 0 ,0 0 1 6 0 ,0 0 1 6 -0 ,0 0 2 6 -0 ,0 3 4 9 -0 ,0 1 1 6 0 ,0 0 6 9 -0 ,0 1 9 8 -0 ,0 1 9 8 -0 ,0 0 8 2 0 ,0 2 4 3 0 ,0 0 1 4 0 ,0 0 1 3 0 ,0 0 0 7 0 0 ,0 4 6 9 0 ,0 4 6 9 0 ,0 6 2 1 0 ,0 1 0 5 0 ,2 3 6 7 0 ,0 2 6 1 0 ,1 1 6 7 0 ,1 3 1 6 -0 ,0 0 6 0 -0 ,0 0 6 0 0 ,0 4 9 8 0 ,0 4 9 8 0 ,0 1 0 7 0 ,1 7 0 0 0 ,0 0 0 2 0 ,1 2 1 6 0 ,0 4 3 9 0 ,0 4 3 9 -0 ,0 0 0 6 -0 ,0 1 7 9 0 ,1 4 7 8 0 ,1 1 5 6 0 ,0 8 9 4 1 0 ,0 2 6 6 0 ,0 2 6 6 -0 ,0 1 5 2 0 ,0 0 0 9 -0 ,0 3 5 2 -0 ,0 0 6 8 -0 ,0 0 5 2 0 ,0 2 1 3 0 ,0 4 7 1 0 ,0 4 7 1 -0 ,0 2 7 3 -0 ,0 2 7 3 0 ,0 0 7 2 -0 ,0 3 6 9 0 ,2 1 9 1 0 ,0 0 9 8 0 ,0 1 5 5 0 ,0 1 5 5 0 ,0 2 7 8 0 ,0 0 1 2 -0 ,0 0 4 4 0 ,0 0 1 7 0 ,0 1 0 2 2 0 ,0 1 0 5 0 ,0 1 0 5 0 ,0 1 3 9 0 ,0 0 0 1 0 ,0 0 4 7 0 ,0 0 6 9 -0 ,0 0 5 9 -0 ,0 1 6 5 -0 ,0 1 1 9 -0 ,0 1 1 9 0 ,0 0 0 4 0 ,0 0 0 4 0 ,0 2 1 0 -0 ,0 0 6 5 -0 ,0 1 6 7 0 ,0 0 1 3 0 ,0 5 6 1 0 ,0 5 6 1 0 ,0 1 7 3 -0 ,0 0 1 4 0 ,0 0 1 8 0 ,0 0 1 4 -0 ,0 1 3 3 3 0 ,0 1 1 4 0 ,0 1 1 4 -0 ,0 1 7 6 0 ,0 0 4 9 -0 ,0 2 7 5 -0 ,0 0 3 2 -0 ,0 0 3 7 0 ,0 1 0 0 -0 ,0 0 3 4 -0 ,0 0 3 4 -0 ,0 0 7 8 -0 ,0 0 7 8 -0 ,0 0 9 8 -0 ,0 1 0 2 -0 ,0 1 2 0 -0 ,0 2 4 0 -0 ,0 1 7 9 -0 ,0 1 7 9 0 ,0 0 0 9 0 ,0 0 9 1 0 ,0 0 1 8 -0 ,0 0 4 0 0 ,0 0 4 8 4 0 ,0 0 0 2 0 ,0 0 0 2 0 ,0 0 1 5 -0 ,0 0 6 4 0 ,0 1 6 3 -0 ,0 0 7 6 -0 ,0 0 3 2 0 ,0 1 2 5 0 ,0 0 0 0 0 ,0 0 0 0 0 ,0 2 5 8 0 ,0 2 5 8 0 ,0 2 6 3 -0 ,0 1 5 9 -0 ,0 0 8 8 0 ,0 2 0 8 0 ,0 5 7 3 0 ,0 5 7 3 -0 ,0 0 0 6 -0 ,0 1 0 1 0 ,0 0 0 2 -0 ,0 2 6 1 0 ,0 0 3 9 5 0 ,0 1 7 0 0 ,0 1 7 0 0 ,0 0 9 0 -0 ,0 0 3 0 0 ,0 8 2 4 -0 ,0 0 0 5 -0 ,0 0 0 4 -0 ,0 0 3 5 -0 ,0 0 3 0 -0 ,0 0 3 0 0 ,0 0 5 1 0 ,0 0 5 1 -0 ,0 1 5 5 0 ,0 2 4 7 0 ,0 3 6 4 0 ,0 1 2 3 -0 ,0 2 6 4 -0 ,0 2 6 4 -0 ,0 0 3 3 0 ,0 0 3 0 0 ,0 0 2 2 -0 ,0 0 6 7 0 ,0 0 1 7 6 0 ,0 0 1 0 0 ,0 0 1 0 -0 ,0 1 2 8 -0 ,0 0 3 1 0 ,1 6 7 1 0 ,0 0 2 5 -0 ,0 0 2 1 -0 ,0 2 4 6 0 ,0 1 1 9 0 ,0 1 1 9 0 ,0 0 2 9 0 ,0 0 2 9 -0 ,0 0 4 5 0 ,0 0 2 9 0 ,0 0 8 5 0 ,0 0 4 5 0 ,0 0 1 5 0 ,0 0 1 5 -0 ,0 1 6 4 0 ,0 1 2 4 -0 ,0 0 7 2 0 ,0 0 4 9 -0 ,0 0 7 1 7 -0 ,0 0 6 7 -0 ,0 0 6 7 -0 ,0 0 5 6 -0 ,0 0 5 9 -0 ,0 0 4 4 -0 ,0 0 1 3 -0 ,0 0 4 0 -0 ,0 0 9 7 -0 ,0 0 7 3 -0 ,0 0 7 3 -0 ,0 0 5 7 -0 ,0 0 5 7 0 ,0 0 8 4 -0 ,0 0 8 5 0 ,0 1 4 8 -0 ,0 2 7 0 0 ,0 0 8 0 0 ,0 0 8 0 0 ,0 0 3 3 -0 ,0 0 2 5 -0 ,0 0 2 1 -0 ,0 1 4 9 -0 ,0 0 2 6 8 0 ,0 0 0 6 0 ,0 0 0 6 0 ,0 0 4 5 -0 ,0 0 1 1 -0 ,0 0 0 6 0 ,0 0 0 1 0 ,0 0 0 5 -0 ,0 1 1 3 -0 ,0 0 1 6 -0 ,0 0 1 6 -0 ,0 0 0 3 -0 ,0 0 0 3 0 ,0 0 2 2 -0 ,0 1 5 3 0 ,0 0 3 8 -0 ,0 5 2 3 0 ,0 0 3 6 0 ,0 0 3 6 0 ,0 1 5 7 -0 ,0 1 1 2 -0 ,0 0 2 0 0 ,0 2 3 2 -0 ,0 0 2 2 9 -0 ,0 0 5 3 -0 ,0 0 5 3 -0 ,0 0 0 8 -0 ,0 0 6 4 -0 ,0 0 6 4 -0 ,0 0 3 7 0 ,0 0 2 4 0 ,0 0 1 9 0 ,0 0 1 7 0 ,0 0 1 7 0 ,0 2 6 8 0 ,0 2 6 8 0 ,0 0 9 2 -0 ,0 3 0 8 0 ,0 0 5 3 -0 ,0 0 3 3 -0 ,0 1 5 2 -0 ,0 1 5 2 -0 ,0 0 0 3 -0 ,0 1 3 6 0 ,0 0 0 8 -0 ,0 0 1 4 0 ,0 0 6 2 10 -0 ,0 1 9 8 -0 ,0 1 9 8 -0 ,0 0 7 2 0 ,0 2 6 2 0 ,0 0 5 2 0 ,0 0 7 6 0 ,0 0 0 6 -0 ,0 1 1 3 0 ,0 0 0 6 0 ,0 0 0 6 0 ,0 2 0 3 0 ,0 2 0 3 -0 ,0 0 6 3 0 ,0 0 4 5 0 ,0 2 3 7 -0 ,0 2 2 6 0 ,0 0 7 3 0 ,0 0 7 3 0 ,0 1 6 0 -0 ,0 0 1 8 -0 ,0 0 0 1 0 ,0 0 5 3 0 ,0 0 0 9 E v e n t W in d o w L B O 1 L B O 2 L B O 3 L B O 4 L B O 5 L B O 6 L B O 7 L B O 8 L B O 9 L B O 1 0 L B O 1 1 L B O 1 2 L B O 1 3 L B O 1 4 L B O 1 5 L B O 1 6 L B O 1 7 L B O 1 8 L B O 1 9 L B O 2 0 L B O 2 1 L B O 2 2 L B O 2 3 -1 0 0 ,0 3 3 0 -0 ,0 0 5 7 -0 ,0 1 7 2 -0 ,0 0 7 9 -0 ,0 0 9 7 0 ,0 1 5 2 -0 ,0 0 6 5 -0 ,0 0 9 0 -0 ,0 0 0 4 -0 ,0 0 9 4 0 ,0 0 5 7 -0 ,0 0 4 7 -0 ,0 1 8 7 0 ,0 1 2 2 -0 ,0 1 1 7 -0 ,0 0 6 4 -0 ,0 3 9 8 -0 ,0 3 1 0 0 ,0 0 4 6 -0 ,0 0 9 9 0 ,0 1 9 7 0 ,0 0 0 1 0 ,0 0 2 1 -9 0 ,0 2 3 8 -0 ,0 0 3 5 -0 ,0 0 4 0 -0 ,0 0 7 5 -0 ,0 0 1 3 0 ,0 1 8 7 -0 ,0 0 1 8 -0 ,0 0 4 6 0 ,0 1 2 3 -0 ,0 0 1 5 0 ,0 0 6 8 0 ,0 1 5 6 -0 ,0 0 6 4 0 ,0 0 5 7 -0 ,0 0 2 6 -0 ,0 0 9 0 -0 ,0 0 5 0 0 ,0 1 7 3 -0 ,0 1 3 5 0 ,0 0 3 5 -0 ,0 1 3 7 -0 ,0 4 0 1 0 ,0 1 3 5 -8 0 ,0 0 3 6 0 ,0 0 0 8 0 ,0 0 6 7 0 ,0 0 4 7 -0 ,0 1 8 3 0 ,0 0 1 4 0 ,0 0 1 4 -0 ,0 1 9 9 0 ,0 3 2 0 0 ,0 0 3 7 0 ,0 0 5 6 -0 ,0 0 1 9 0 ,0 2 1 8 0 ,0 0 0 9 0 ,0 1 3 1 0 ,0 1 2 0 -0 ,0 0 0 2 -0 ,0 3 0 4 0 ,0 0 2 9 0 ,0 1 8 1 0 ,0 2 3 1 0 ,0 0 3 0 0 ,0 0 3 9 -7 0 ,0 0 0 2 -0 ,0 0 5 0 0 ,0 0 0 4 -0 ,0 1 9 7 -0 ,0 1 7 6 -0 ,0 0 5 2 0 ,0 0 2 9 0 ,0 0 5 2 0 ,0 1 1 1 0 ,0 3 1 4 -0 ,0 0 9 3 0 ,0 0 8 2 -0 ,0 0 1 8 -0 ,0 0 2 2 -0 ,0 0 7 0 0 ,0 1 7 6 -0 ,0 0 4 4 0 ,0 1 0 4 0 ,0 0 6 1 0 ,0 1 5 4 -0 ,0 1 4 6 0 ,0 0 0 3 -0 ,0 0 0 8 -6 -0 ,0 0 4 6 -0 ,0 0 2 7 0 ,0 0 7 9 0 ,0 0 0 0 0 ,0 0 5 1 -0 ,0 0 5 8 0 ,0 0 5 9 0 ,0 1 8 7 0 ,0 0 9 5 0 ,0 5 4 1 -0 ,0 0 8 2 0 ,0 0 7 9 0 ,0 1 0 1 0 ,0 1 4 9 0 ,0 1 4 9 -0 ,0 2 8 8 -0 ,0 0 2 5 -0 ,0 2 7 5 0 ,0 0 8 2 -0 ,0 0 0 8 0 ,0 0 1 2 0 ,0 2 2 5 0 ,0 0 2 3 -5 -0 ,0 2 0 3 -0 ,0 0 4 6 -0 ,0 0 3 5 -0 ,0 0 4 1 0 ,0 2 4 4 0 ,0 1 2 2 -0 ,0 0 1 6 -0 ,0 0 0 5 0 ,0 2 9 3 0 ,0 3 9 5 0 ,0 0 0 6 0 ,0 0 5 5 -0 ,0 0 8 1 0 ,0 4 0 6 -0 ,0 4 0 4 0 ,0 0 3 5 0 ,0 1 7 9 0 ,0 4 7 0 0 ,0 0 2 1 -0 ,0 1 1 0 -0 ,0 1 0 1 0 ,0 0 0 2 0 ,0 0 5 9 -4 0 ,0 0 2 9 0 ,0 0 7 6 -0 ,0 1 0 8 -0 ,0 2 1 7 0 ,0 2 3 9 0 ,0 2 2 1 -0 ,0 0 0 2 0 ,0 3 4 4 -0 ,0 0 9 9 -0 ,0 1 0 2 0 ,0 1 2 0 -0 ,0 1 1 9 0 ,0 0 1 0 0 ,0 0 4 9 0 ,0 1 0 3 -0 ,0 1 2 1 -0 ,0 0 3 2 0 ,0 2 3 0 0 ,0 0 4 7 0 ,0 0 4 6 -0 ,0 2 2 5 -0 ,0 2 0 0 -0 ,0 0 1 7 -3 -0 ,0 0 1 7 -0 ,0 0 7 8 -0 ,0 1 0 4 -0 ,0 4 8 7 0 ,0 3 6 9 0 ,0 2 5 8 0 ,0 0 7 6 0 ,0 0 0 3 -0 ,0 1 1 8 -0 ,0 2 0 4 -0 ,0 0 2 3 -0 ,0 0 3 3 0 ,0 0 2 7 -0 ,0 2 2 4 -0 ,0 0 8 7 0 ,0 1 6 5 -0 ,0 0 1 7 0 ,0 3 2 5 -0 ,0 2 0 3 0 ,0 0 5 0 0 ,0 0 7 5 0 ,0 1 9 5 0 ,0 0 7 5 -2 -0 ,0 0 6 1 -0 ,0 0 5 2 -0 ,0 1 0 3 -0 ,0 3 6 1 -0 ,0 0 9 0 -0 ,0 1 5 2 -0 ,0 0 8 5 -0 ,0 0 6 1 -0 ,0 3 0 2 -0 ,0 3 2 9 -0 ,0 0 1 7 0 ,0 0 4 6 -0 ,0 1 1 3 -0 ,0 0 6 3 0 ,0 1 1 6 0 ,0 1 0 3 0 ,0 0 1 5 -0 ,0 1 3 6 0 ,0 1 6 4 0 ,0 0 6 0 -0 ,0 1 3 4 0 ,0 0 0 1 0 ,0 0 4 6 -1 0 ,0 0 4 4 0 ,0 0 4 2 -0 ,0 1 4 9 -0 ,0 1 9 3 0 ,0 2 4 1 -0 ,0 1 4 3 0 ,0 0 3 8 -0 ,0 0 8 4 0 ,0 2 0 1 0 ,0 0 2 3 0 ,0 0 5 7 -0 ,0 0 3 6 0 ,0 1 5 3 -0 ,0 0 5 3 0 ,0 0 4 7 -0 ,0 2 2 3 -0 ,0 1 6 0 0 ,0 1 2 6 -0 ,0 0 8 8 -0 ,0 1 9 1 0 ,0 0 6 2 -0 ,0 0 9 1 0 ,0 0 1 7 0 0 ,0 0 1 6 0 ,0 0 2 8 -0 ,0 1 3 0 -0 ,0 0 3 4 0 ,0 0 9 3 0 ,0 2 0 3 0 ,0 1 6 0 -0 ,0 1 8 9 -0 ,0 3 0 4 0 ,0 0 2 3 -0 ,0 2 8 2 -0 ,0 0 4 9 0 ,0 1 2 2 0 ,0 3 6 1 -0 ,0 0 2 3 0 ,0 0 8 2 0 ,0 9 8 7 -0 ,0 0 8 0 -0 ,0 0 0 9 0 ,0 1 0 1 -0 ,0 0 3 1 -0 ,0 0 0 1 0 ,0 1 3 1 1 0 ,0 0 3 6 -0 ,0 1 9 2 0 ,0 0 8 4 0 ,0 0 7 5 -0 ,0 1 1 2 0 ,0 1 3 6 -0 ,0 1 6 6 -0 ,0 1 6 7 0 ,0 1 7 2 -0 ,0 0 2 0 -0 ,0 1 4 3 0 ,0 0 1 8 -0 ,0 3 1 0 -0 ,0 2 5 2 -0 ,0 3 6 2 -0 ,0 1 0 4 -0 ,0 0 1 8 -0 ,0 0 4 4 0 ,0 3 3 6 0 ,0 0 9 5 0 ,0 0 3 9 0 ,0 3 8 7 0 ,0 0 0 4 2 0 ,0 0 0 3 -0 ,0 1 7 0 -0 ,0 0 7 9 0 ,0 0 1 0 -0 ,0 2 3 6 -0 ,0 0 2 6 -0 ,0 0 5 6 -0 ,0 0 6 7 0 ,0 0 3 7 0 ,0 1 2 5 -0 ,0 1 4 5 -0 ,0 1 2 8 0 ,0 1 2 0 -0 ,0 1 1 9 0 ,0 1 9 2 -0 ,0 0 3 2 0 ,0 0 1 5 0 ,0 0 6 1 0 ,0 1 1 8 -0 ,0 2 4 8 -0 ,0 0 7 4 -0 ,0 2 3 1 -0 ,0 0 0 3 3 0 ,0 0 8 9 -0 ,0 0 6 3 -0 ,0 0 1 0 0 ,0 0 7 6 0 ,0 0 5 5 -0 ,0 0 7 0 -0 ,0 1 0 1 -0 ,0 0 3 9 -0 ,0 2 7 4 -0 ,0 2 0 9 -0 ,0 0 9 5 0 ,0 0 4 0 -0 ,0 1 0 7 -0 ,0 0 1 0 0 ,0 2 9 9 -0 ,0 0 2 9 -0 ,0 0 9 3 -0 ,0 2 0 9 0 ,0 1 4 2 0 ,0 0 6 3 0 ,0 0 2 0 0 ,0 0 9 8 0 ,0 0 2 0 4 0 ,0 0 5 3 0 ,0 0 6 8 0 ,0 0 7 9 -0 ,0 0 3 4 -0 ,0 0 2 3 0 ,0 1 3 2 0 ,0 2 2 9 -0 ,0 0 1 9 -0 ,0 0 1 4 -0 ,0 1 4 5 -0 ,0 0 7 5 0 ,0 0 0 2 0 ,0 2 5 5 -0 ,0 0 4 0 0 ,0 0 6 8 -0 ,0 2 4 8 0 ,0 0 0 6 0 ,0 1 4 3 -0 ,0 0 0 9 0 ,0 0 2 7 0 ,0 0 4 8 -0 ,0 0 0 2 0 ,0 0 0 5 5 -0 ,0 1 2 8 -0 ,0 0 3 8 -0 ,0 0 3 4 -0 ,0 0 8 2 -0 ,0 4 3 5 -0 ,0 0 9 3 -0 ,0 0 7 3 -0 ,0 2 4 6 -0 ,0 1 2 5 -0 ,0 1 4 6 -0 ,0 0 4 2 0 ,0 2 2 7 0 ,0 0 6 0 -0 ,0 0 9 7 -0 ,0 1 4 7 0 ,0 2 0 9 0 ,0 0 1 8 -0 ,0 0 3 3 0 ,0 0 4 3 0 ,0 0 8 7 -0 ,0 0 5 6 0 ,0 0 4 8 0 ,0 1 7 1 6 0 ,0 0 2 6 -0 ,0 1 2 4 -0 ,0 0 5 2 -0 ,0 0 9 2 -0 ,0 3 6 5 -0 ,0 0 6 0 0 ,0 4 3 3 0 ,0 3 5 5 -0 ,0 0 4 9 0 ,0 0 2 7 0 ,0 0 5 4 -0 ,0 0 7 9 -0 ,0 0 5 2 0 ,0 0 6 4 0 ,0 0 2 8 -0 ,0 1 9 1 0 ,0 0 0 8 0 ,0 0 0 4 -0 ,0 1 9 2 -0 ,0 1 4 4 -0 ,0 0 9 2 -0 ,0 0 9 3 -0 ,0 0 7 4 7 -0 ,0 0 1 0 -0 ,0 0 7 1 -0 ,0 1 9 3 -0 ,0 0 9 7 -0 ,0 0 8 0 0 ,0 0 9 1 0 ,0 3 7 1 -0 ,0 0 5 3 0 ,0 1 5 8 0 ,0 1 3 8 0 ,0 1 0 7 -0 ,0 0 8 2 0 ,0 2 5 3 0 ,0 0 0 0 0 ,0 0 7 3 -0 ,0 1 0 0 -0 ,0 1 7 2 0 ,0 1 5 0 -0 ,0 0 0 5 -0 ,0 1 2 1 0 ,0 0 9 9 0 ,0 0 4 6 0 ,0 1 5 7 8 -0 ,0 1 2 4 -0 ,0 1 5 0 -0 ,0 0 7 6 -0 ,0 1 6 2 -0 ,0 2 0 6 0 ,0 0 6 0 -0 ,0 0 5 4 -0 ,0 0 0 5 -0 ,0 0 2 0 -0 ,0 1 7 0 0 ,0 0 0 6 -0 ,0 0 0 3 0 ,0 0 0 6 0 ,0 0 5 2 0 ,0 2 6 4 -0 ,0 1 0 7 0 ,0 2 7 5 0 ,0 1 1 1 0 ,0 0 2 9 0 ,0 0 2 3 -0 ,0 0 4 8 0 ,0 0 4 2 0 ,0 0 5 0 9 -0 ,0 0 3 3 -0 ,0 1 4 3 -0 ,0 1 9 9 -0 ,0 1 6 2 0 ,0 0 7 7 0 ,0 0 6 6 -0 ,0 2 3 2 -0 ,0 1 1 5 0 ,0 0 8 5 -0 ,0 1 8 9 0 ,0 2 3 9 0 ,0 0 2 1 0 ,0 0 8 5 -0 ,0 1 7 9 0 ,0 0 1 2 0 ,0 0 1 7 -0 ,0 3 2 2 -0 ,0 1 5 0 0 ,0 1 6 1 -0 ,0 0 7 0 -0 ,0 0 0 2 0 ,0 0 0 0 0 ,0 0 3 8 10 0 ,0 1 5 3 0 ,0 0 3 7 0 ,0 0 3 6 0 ,0 0 6 8 -0 ,0 2 4 1 -0 ,0 1 1 2 -0 ,0 0 9 2 -0 ,0 1 0 2 0 ,0 0 7 7 0 ,0 1 3 1 0 ,0 2 6 0 -0 ,0 2 1 5 0 ,0 1 3 0 -0 ,0 0 1 1 -0 ,0 4 5 1 0 ,0 2 2 4 -0 ,0 3 0 2 0 ,0 1 9 4 -0 ,0 0 2 2 0 ,0 1 8 0 -0 ,0 0 0 9 -0 ,0 0 8 3 -0 ,0 0 7 0 A b n ro m a l R e tu rn s f o r T a rg e t F ir m s A b n o rm a l R e tu rn s f o r B id d in g F ir m s