Master Thesis
Department of Industrial Management and Logistics
Forming a Supply Chain Strategy for a Startup
Hanna Isacsson & Jakob Klitte
Acknowledgements
This Master Thesis was written during the fall of 2018 by Hanna Isacsson and Jakob Klitte, as the final part of the M.Sc. program Mechanical Engineering at the Faculty of Engineering, Lund University. We would like to thank our supervisor Bertil Nilsson at the Department of Industrial Management & Logistics at Lund University for guiding us through this process and providing the feedback needed to finish the project. We would also like to thank the company Minut and our supervisor at the company, Rasmus Kjellén, who assisted us throughout the project. Lastly, we would like to thank all the participating case companies and their representatives for taking the time to be a part of this study. These include Marie Johansson-Hult at Hövding, Robert Lindroth at Axis, David Arnesson at Orbital Systems, Sarandis Kalogeropulos at Anima, and Karl-Anders Johansson together with Bogdan Tudosoiu at Modcam.
Malmö, December 2018
Abstract
Title
Forming a Supply Chain Strategy for a Startup Authors
Hanna Isacsson Jakob Klitte Supervisors
Bertil Nilsson, Lund University, Faculty of Engineering Rasmus Kjellén, Minut AB
Background
About 90% of all startups fail to become successful, and the most significant reason is due to premature scaling. Limited research has priorly been conducted in the borderland between startups and supply chain. Explicitly on how a startup should go about defining its supply chain objective and how to measure its performance. Nevertheless, the high-tech startup industry sees potential in gaining insights about this issue. This study will develop a framework to guide startups in choosing a good supply chain strategy and scale it properly.
Purpose
The purpose of this research study is to identify a supply chain strategy for startups to increase preparedness for future growth.
Methodology
To fulfill the purpose of this thesis, a method was developed including two segments. Firstly, a literature review was conducted which resulted in a theoretical framework. Secondly, empirics were collected through interviews and a survey. The method is iterative, thus the resulting framework is developed in close relations with both theory and empirics.
Conclusions
A framework for deciding on a supply chain strategy for a startup is presented. In addition, critical success factors as well as relevant key performance indicators, for a startup to assess when scaling
is presented. In order to determine a supply chain strategy, we propose that the following four factors should be considered: (1) the characteristics of the industry they are operating in, (2) the type of product they are selling, (3) the stage in the product life cycle that the product is currently in, and lastly (4) the stage in the startup life cycle the organization is currently in. The CSFs and KPIs are identified to help a startup scale its supply chain.
Keywords
Startup, Scaleup, Supply Chain Strategy, Born Global, High-tech, Manufacturing, Performance Measurements, Critical Success Factors, Scaling Startup
Definitions
• B2B - Business to business (B2B) is a market strategy where one business makes a commercial transaction with another
• B2C - Business to consumer (B2C) refers to the transactions conducted directly between a company and consumers who are the end-users of its products or services
• BG - Born global (BG) is a company that has targeted a global market from the start • CSF - Critical success factor (CSF) is a management term for an ingoing factor that is
necessary for an organization or project to achieve its mission
• Focal company - The company that is governing over the supply chain network
• IPO - An initial public offering (IPO) is the very first sale of stock issued by a company to the public
• KPI - Key performance indicator (KPI) is a quantifiable measure used to evaluate the success of an organization, employee, and such, in meeting objectives for performance
• Scaling - A system’s ability to expand output on demand when resources are added
• SKU - Stock keeping unit (SKU), is a unique code that is assigned to a product to identify it. Each SKU is a distinct item for sale, separating product variations.
• SME - Small- and medium sized enterprise (SME), where staff headcount ranges between 50-250, and turnover ranges between 100-500 MSEK or below
• Startup - A newly established business
Contents
1 Introduction 1 1.1 Background . . . 2 1.2 Company Description . . . 2 1.3 The Problem . . . 3 1.4 Delimitations . . . 31.5 Purpose of Study & Research Questions . . . 4
1.6 Project objective and deliverables . . . 4
1.7 Report Structure . . . 4
2 Methodology 7 2.1 Research Strategy . . . 8
2.1.1 Purpose of Study . . . 8
2.1.2 Qualitative vs. Quantitative Research Strategy . . . 9
2.2 Research Design . . . 9
2.2.1 Case Study Design . . . 10
2.2.2 Research Methods . . . 11 2.2.3 Data Analysis . . . 14 2.3 Research Quality . . . 15 2.3.1 Trustworthiness . . . 15 2.3.2 Authenticity . . . 16 2.4 Summary of Methodology . . . 17 3 Theory 19 3.1 Introduction . . . 20
3.2 Managing the Supply Chain . . . 20
3.2.1 The Global Supply Chain . . . 20
3.2.2 Supply Chain Management . . . 23
3.2.3 Performance Measurements in the Supply Chain . . . 25
3.3 Industry Characteristics . . . 28
3.4.1 Type of Product . . . 31
3.4.2 Product Life Cycle . . . 33
3.5 The Life Cycle of a Startup . . . 35
3.6 Supply Chain Capabilities . . . 39
3.6.1 Internal Capabilities . . . 39
3.6.2 Supply Chain Network Capabilities . . . 41
4 Empirics - Case Studies 49 4.1 Case Company Data . . . 50
4.2 Case Company A, Modcam . . . 50
4.2.1 Introduction to Modcam . . . 50
4.2.2 Modcam’s Supply Chain . . . 51
4.2.3 Critical Success Factors . . . 51
4.2.4 KPI:s during Growth Phase . . . 52
4.3 Case Company B, Orbital Systems . . . 53
4.3.1 Introduction to Orbital Systems . . . 53
4.3.2 Orbital Systems’ Supply Chain . . . 54
4.3.3 Critical Success Factors . . . 54
4.3.4 KPI:s during Growth Phase . . . 55
4.4 Case Company C, Anima . . . 56
4.4.1 Introduction to Anima . . . 56
4.4.2 Anima’s Supply Chain . . . 57
4.4.3 Critical Success Factors . . . 57
4.4.4 KPI:s during Growth Phase . . . 58
4.5 Case Company D, Hövding . . . 59
4.5.1 Introduction to Hövding . . . 59
4.5.2 Hövding’s Supply Chain . . . 60
4.5.3 Critical Success Factors . . . 60
4.5.4 KPI:s during Growth Phase . . . 61
4.6 Case Company E, Axis . . . 62
4.6.1 Introduction to Axis . . . 62
4.6.2 Axis’ Supply Chain . . . 63
4.6.3 Critical Success Factors . . . 64
4.6.4 KPI:s during Growth Phase . . . 65
4.7 Cross Case Findings . . . 66
4.7.1 Supply Chain Findings . . . 66
4.7.3 KPI:s during Growth Phase . . . 68
5 Analysis 71 5.1 Summary of Supply Chain Strategies . . . 72
5.2 Industry Characteristics . . . 72
5.2.1 Supply Chain Strategy . . . 72
5.2.2 Identified Critical Success Factors . . . 73
5.3 Product Type . . . 74
5.3.1 Supply Chain Strategy . . . 74
5.3.2 Identified Critical Success Factors . . . 74
5.4 Product Life Cycle . . . 75
5.4.1 Introduction Stage . . . 75
5.4.2 Growth Stage . . . 76
5.4.3 Maturity Stage . . . 77
5.4.4 Decline Stage . . . 78
5.5 Startup Life Cycle . . . 79
5.5.1 Startup Stage . . . 79
5.5.2 Transition Stage . . . 80
5.5.3 Scaling Stage . . . 81
5.5.4 Exit Stage . . . 82
5.6 Summary of Matching Supply Chain Strategies . . . 82
5.7 KPI:s during Growth Phase . . . 83
6 Conclusion 87 6.1 Research Questions . . . 88
6.1.1 Research Question 1: What should a startup’s supply chain strategy be during growth? . . . 88
6.1.2 Research Question 2: What critical success factors (CSFs) can be identified for the supply chain of a startup? . . . 89
6.1.3 Research Question 3: What key performance indicators (KPI:s) are relevant to track in order to measure the performance of a startup’s supply chain? . 91 6.2 Theoretical Contributions . . . 91
6.3 Future Research . . . 92
7 Application of Theoretical Framework 95 7.1 Industry Characteristics . . . 95
7.2 Product Type . . . 98
7.3 Stage in the Product Life Cycle . . . 100
7.4 Stage in the Startup Life Cycle . . . 101
List of Tables
2.1 Purpose and aim of study . . . 8
2.2 Research methodology characteristics, as described by Runeson and Höst (2009) . 8 2.3 Case Company Overview . . . 11
2.4 Strategies for gathering data . . . 12
2.5 Interview methods . . . 13
2.6 Advantages and Disadvantages with Self-Completion Questionnaires . . . 13
2.7 Trustworthiness criteria . . . 16
2.8 Authenticity criteria . . . 17
3.1 Lee’s Uncertainty Framework with Matching Supply Chain Strategies . . . 25
3.2 SCOR Performance Attributes (Council 2008) . . . 27
3.3 Matching Supply Chains With Products by Fisher (1997) . . . 31
3.4 Product Demand as presented by Fisher (1997) . . . 32
4.1 Case Company Overview . . . 50
4.2 Most important attribute of supply chain during growth . . . 68
4.3 Most important KPI:s to monitor during growth . . . 69
5.1 Summary of Supply Chain Strategies . . . 72
5.2 Lee’s Uncertainty Framework with Matching Supply Chain Strategies . . . 72
5.3 The Startup Supply Chain Strategy Framework . . . 82
5.4 SCOR Performance Attributes . . . 84
6.1 Critical Success Factors for a Startup . . . 90
7.1 Product Demand for Point . . . 100
7.2 The Startup Supply Chain Strategy Framework . . . 102
Chapter 1
Introduction
In this chapter, a background to the main problem is given together with a description of the company where this problem has been identified. This is followed by a presentation of the purpose of the study along with the specific research questions that are to be answered. Finally, a disposition of the entire study is laid out.
1.1
Background
A critical moment for a startup is the ability to scale while meeting growing demand. According to Marmer et al. (2011), 90% of all high-tech startups fail, and 74% of high-tech startups fail because they scale their business prematurely. Success in scaling properly might be what stands in the way of becoming a highly successful company. However, scaling might be a challenge for startups today because time is spent putting out fires instead of working pro-actively, such as developing a long-term strategy. Many decisions might be taken ad hoc and correcting mistakes is costly. According to A. Hill and T. Hill (2009), every decision should be taken in accordance with the overall strategy to make the supply chain and the rest of the company functions work in symbiosis. To enable valid, quick decisions, the supply chain strategy has to be aligned with the overall strategy.
While scaling a company, strategies and policies are needed to guide correct and fast decisions. That way, the company can continue to be innovative and successful in a dynamic market, while still pursuing offensive and long-term targets. Through understanding the process of effective scaling, a startup’s chances of success might increase.
The authors have had the opportunity to familiarize themselves with Minut who currently is in a growth phase and asks themselves the question ”how should our supply chain be configured to support rapid growth in demand?”. When gathering initial theory about the subject, the authors found out that very little research has been conducted in the area. More specifically, there is a lack of research about designing a supply chain during the growth phase of a startup and what supply chain strategy a startup should pursue when the firm is experiencing exponential growth in sales volumes.
1.2
Company Description
Minut is based in Malmö, Sweden, and has been active since 2014. They have offices in Stockholm, Malmö, and London. 2015 the founders got a grant for going to Shenzhen, China, to attend HAX, a prominent accelerator for hardware startups, to design and produce their first product. They decided on producing a smart smoke-alarm but later pivoted into a smart home-alarm. The product Minut sells is a smart home alarm designed for smaller homes or apartments, and they position themselves as a cheaper and more connected home alarm compared to their larger competitors. The product comprises of a plastic cover, a lithium battery, a circuit board, as well as multiple sensors such as motion, humidity, temperature, and noise. All these components are sourced and assembled in China and then shipped via Hongkong to warehouses in Europe and the US. They have partnered up with a production company in China which produces their product. Minut’s volume compared to the total volume of the production company is very low. Right now they
are selling to multiple countries across the world, for example, Australia, the US, Germany, and China. However, their main markets are Sweden and Great Britain (Kjellén 2018).
During the first half of 2018, Minut started shipping products to its Kickstarter backers and has since then (late 2018) delivered over 5000 units. The product, both software and hardware-wise, is ready for large-scale commercial launch and the company hopes to see exponential growth in 2019. To be able to grow, thanks to its investors even faster than organic growth, each function in the company have to be prepared and aligned with the rest of the functions. It is unclear what kind of actions that are necessary to take in order for Minut’s supply chain to support rapid growth in demand (ibid.).
1.3
The Problem
Today there are many well-established theories, processes, and methods to determine an appropri-ate strappropri-ategy for a company’s supply chain. These methods are mainly designed and tested on larger well-established companies. Hence, these theories, processes, and methods are usually not appli-cable to a startup. However, if the company is facing a growth period, the best time to implement well-established structures is prior to growth, when the startup is still fairly small. This foundation can play an important role in having a successful transition to the growth stage. Therefore, this thesis sets out to develop a set of factors a startup should take into consideration when they are forming a supply chain strategy, and how the startup should go about to successfully support this strategy.
1.4
Delimitations
In order for Minut to benefit as much as possible from the study, their requests and preferences have been taken into regards when setting the focus of the study together with its delimitations. Due to the nature of Minut as a startup, the study has mainly focused on the challenges and critical success factors regarding management of a global supply chain for a startup that is producing a hardware product containing electronic components. Due to geographical constraints and the limited time frame of 20 weeks to finish the study, it has been decided that the authors will only source case companies to interview that are active in the Malmö-Lund region of Sweden. In addition to that, only a few case companies will be selected because of the time constraints.
1.5
Purpose of Study & Research Questions
The purpose of this research study is to identify a supply chain strategy for startups to increase preparedness for future growth. In order to fulfill this purpose, the following research questions are to be answered:
Research question 1: What should a startup’s supply chain strategy be during growth? Research question 2: What critical success factors (CSFs) can be identified for the supply chain of a startup?
Research question 3: What key performance indicators (KPI:s) are relevant to track in order to measure the performance of a startup’s supply chain during growth?
Research question one is constructed in a broader way compared to research question two and three. The reason behind this is to allow insights to be gained in a broader spectrum. A strategy usually includes some critical success factors as well as key performance indicators, thus the reason for choosing our second and third research question.
1.6
Project objective and deliverables
The objective of this research study is to develop a framework that helps startup’s to identify a suitable strategy for their supply chain. The framework takes into account both internal and external factors that are considered to have an implication on a startup’s supply chain. When recommending a supply chain strategy, critical success factors have been taken into account based on gathered theoretical and empirical data. Also, relevant KPI:s will be identified to measure the performance of a startup’s supply chain.
1.7
Report Structure
The report is built upon the following six chapters: • Chapter 1 - Introduction
• Chapter 2 - Methodology • Chapter 3 - Theory
• Chapter 4 - Empirics - Case studies • Chapter 5 - Analysis
• Chapter 6 - Conclusions
A visual representation of the report structure can be found in figure 1.1. A more detailed descrip-tion of the ingoing components of each chapter is given below.
Figure 1.1: Report structure
Chapter 1 - Introduction
In the first chapter, an introduction has been given to the subject that is to be researched together with a presentation of the research questions that are to be answered.
Chapter 2 - Methodology
The second chapter begins with a description of different research strategies that are suitable for a Master Thesis, which is followed by a discussion on the advantages and the disadvantages of a qualitative versus a quantitative research strategy. Secondly, the research design is presented together with a description of the research methods used to collect data for the study. How the collected data is to be analyzed is also explained here. After that, it is discussed how the study is to keep a high level of quality with consideration taken to the criterion of trustworthiness and authenticity. Lastly, a summary of the methodology that is to be used for the study is given. Chapter 3 - Theory
In the third chapter, the theoretical framework that will form the base for the literature review is presented and described. Before elaborating on the ingoing components of the theoretical frame-work, an introduction to the global supply chain and supply chain management is given. How to measure supply chain performance is also discussed here. Thereafter, a theoretical background to each ingoing element in the theoretical framework is presented.
Chapter 4 - Empirics - Case studies
In this chapter, findings from the five case companies are presented. An introduction to each case company is given, followed by a description of their supply chain and identified critical success
factors as mentioned by the interviewees. Each company is also placed in the product life cycle curve as well as the startup life cycle curve in order to understand their current context, which may affect their point of view on the matter. The chapter ends with a cross-case analysis to identify common denominators.
Chapter 5 - Analysis
In chapter 5, the analysis of the gathered empirical data and relevant theories from the literature review is presented. A specific supply chain strategy is recommended for each area and identified critical success factors associated with the stage is given. The analysis ends with a presentation of a framework that a startup can use as a tool to determine a suitable strategy for their supply chain.
Chapter 6 - Conclusion
In chapter 6, answers to the research questions of the study are provided based on conclusions drawn from the analysis. Suggestions on future research of the subject are given, as well as a discussion on how this study has contributed to the theory of the subject.
Chapter 7 - Application of Theoretical Framework
In chapter 7, the framework developed in previous chapters is applied to the main case company, Minut. The company is analysed based on the ingoing models of the framework. From this analysis, recommendation of a superior supply chain strategy is made.
Chapter 2
Methodology
This chapter declares the methodology of this study. It aims to explain and motivate which research strategy and research design were chosen as well as discussing the quality of the study in the form of trustworthiness and authenticity. Furthermore, it helps the reader understand how this study was executed to easier follow insights and conclusions made in later chapters.
2.1
Research Strategy
Denscombe (2014) defines a research strategy as “a plan of action designed to achieve a specific goal” (p. 3). Several research strategies can be applied to one single research study. However, the best research strategy for the study is one that is (1) suitable, (2) feasible, and (3) ethical. In this subchapter, a research strategy is chosen for the study based on these three criteria.
2.1.1
Purpose of Study
The selection of a research strategy depends on the purpose the research study is serving, the characteristics of the study, as well as the research study goals. Runeson and Höst (2009) claim that a Master Thesis can serve either of the four different purposes; exploratory, descriptive, explanatory, or improving study. The purposes and their respective aims are described in table 2.1.
Table 2.1: Purpose and aim of study
Purpose Aim
Exploratory study Aims to investigate a certain situation or
phe-nomenon and seek new insights in the matter. The generation of new ideas provides a foundation for further research
Descriptive study Seeks to describe a situation or phenomenon as it is
Explanatory study Aspires to explain a situation or an issue and the
reason behind it, often in the form of a causal rela-tionship
Improving study Commits to finding a solution to the problem at hand
Different approaches apply to the research methodology depending on the primary objective of the study. Runeson and Höst (ibid.) list the associated characteristics of the research methodology depending on the purpose of the study, see table 2.2.
Table 2.2: Research methodology characteristics, as described by Runeson and Höst (2009)
Methodology Primary objective Primary data Design
Case Study Exploratory Qualitative Flexible
Survey Descriptive Quantitative Fixed
Experiment Explanatory Quantitative Fixed
Action research Improving Qualitative Flexible
The purpose of this study builds upon the case company’s anticipated problem of successfully scaling up their business in the case of an exponential increase of order volumes. The aim is to investigate how a startup can approach this issue in a structured manner and increase the startup’s preparedness for such an event. A suitable approach could be considered to be that of an improving
study, as the research study aims to solve a problem for the case company. However, as the authors conducted a literature review on the subject of managing an exponential increase in order volumes, there was a perceived lack of theory applicable to startups. In order to gain further insights into the matter through empirical studies and develop new ideas for future research, an exploratory study approach was chosen.
2.1.2
Qualitative vs. Quantitative Research Strategy
A research strategy may be either quantitative or qualitative in its nature. Qualitative studies put great emphasis on the context and provide a detailed description of the studied phenomenon. Thus, qualitative data emphasizes words, whereas quantitative data focuses on numbers. Data collection and analysis coincides in a qualitative study, while quantitative data is used to test already existing theories by applying statistics to analyze outcomes. This makes qualitative data collection more flexible as it is not strictly limited to a specific structure, which is the case of quantitative data collection as it is more sensitive to a change in direction of the study. (Bryman and Bell 2015; Runeson and Höst 2009). However, according to Seaman (1999), the use of both qualitative and quantitative data in a research study allows for a better understanding of the studied phenomenon. This approach is sometimes referred to as "mixed methods" (Runeson and Höst 2009).
As the aim of the research study is to understand a specific phenomenon and develop new theory rather than to test already existing theory and concepts, the main focus has been on collecting qualitative data. This is supported by Runeson and Höst (ibid.), who argue that an exploratory study should use qualitative primary data. Due to the fact that new insights are anticipated to be gained along with the collection of empirical data, a flexible approach to the research study is also preferred. A qualitative research method will allow for adjustments to be done in the research strategy during the course of the investigation in order to narrow down the scope of the study, as the initial research focus can be considered rather general. Complementary quantitative data will be collected in the form of a survey to get clear and easily comparable answers. Thus, the research study will use the approach of "mixed methods" to collect data.
2.2
Research Design
In line with the defined characteristics of research methodologies by Runeson and Höst (ibid.), a case study design has been adopted to conduct the research study due to its mainly exploratory nature. As a complement, a survey in the form of a self-completion questionnaire has been sent out to the interviewees at each case company in order to collect data regarding performance measurements in the supply chain for a startup. In this subchapter, a further description of case study design and methods used for collecting data will follow.
2.2.1
Case Study Design
According to Yin (2003), a case study design is preferred when research questions such as "why" and "how" are being asked. This type of research method allows the researcher to gain a deeper understanding of a complex phenomena in social settings through an intensive examination of the selected case (Bryman and Bell 2015). Runeson and Höst (2009) further argue that case studies are of a highly reliable nature as they are based in real-world settings. However, as the characteristics of the studied phenomena are difficult to predict in advance, researchers must be flexible in their approach in order to be able to adjust their study according to the context. Hence, case study researchers lose a certain level of control over the study. Thus, a case study research will never be able to provide a conclusion based on statistics (ibid.). A distinctive advantage with using a case study design, however, is that it provides the researcher with strong, connected evidence collected from multiple sources that provide a solid foundation for building a relevant conclusion.
A case study can focus on one single case or use multiple cases to understand the complex phe-nomenon that is being investigated. A single case study is commonly used in situations such as in the critical test of existing theory, the phenomena being studied occurs under rare circumstances, the case is considered to be representable, or the single case serves a revelatory or longitudinal purpose (Yin 2003). This study will be based on multiple cases as to distinguish between what is common and what is unique among the selected case companies, in order to generate a gener-alizable framework applicable to startups that are on the verge of scaling up their business. An additional advantage of conducting a multiple case study is that the investigation of several cases increases the reliability of the analytical conclusion, according to Yin (ibid.).
Selection of Case Companies
Case selection is a form of sampling and the process is highly relevant to address since one or a few cases cannot be based on theories of the statistical probability of selection (Curtis et al. 2000). Purposive sampling, in contrast to probability sampling, is a common method of sampling cases where the objective is to sample in a strategic way so that those sampled are relevant to the research questions. Since it is a non-probability sampling method, it does not let the research be generalized to a population (Bryman and Bell 2015). In purposive sampling, cases are chosen because of their relevance to the research as well as for convenience, access, and geographic proximity (Yin 2003). Bryman and Bell (2015) proposes a series of purposive sampling-strategies where critical case sampling will be used by the researchers. This strategy allows choosing cases that meet a certain criterion and might be of interest to the research. The criteria for the case study to be eligible objects are:
• Case company that produces a hardware product
• Case company that has a global presence and/or sources globally • Accessible interview object that knows the company’s growth phase
Based on these criterion, the companies presented in table 2.3 were chosen for the case study. A more elaborate description of each case company will follow in section 4.1
Table 2.3: Case Company Overview
Company Industry Net Sales
(TSEK) Number of Employees Active Since Modcam (Modcam 2018) Video Analysis (IoT) 900 10 2014 Orbital Systems (Orbital 2018) Water Recycling (IoT) 1 000 50 2013 Anima (Anima 2018) Smart-watches (IoT) 37 100 62 2015 Hövding (Hövding 2018) Airbag 67 000 33 2006
Axis (Axis 2018) Cameras (IoT) 8 602 600 2780 1984
2.2.2
Research Methods
The research methods used to collect data for this study have been through literature reviews, reviewing archival records, by conducting interviews with the selected case companies, as well as collecting data through a survey. A more detailed explanation of each method used is provided below.
Literature Review
To create a rigorous foundation, the research has to be conducted in relation to pre-existing knowl-edge. (Seuring et al. 2005) The objective of a literature review is to distill and summarize the state of science in the research field. (Rowley and Slack 2004) According to Seuring et al. (2005), there are two main reasons to conduct a literature review. First, it summarizes existing research by identifying patterns, themes, and issues to help generate ideas. This provides a starting point for the research. Second, since all new knowledge has to be assessed and handled in accordance with existing theories, the literature review provides a means to do this.
When conducting the literature review, gathering relevant data is key for a substantiated result (Runeson and Höst 2009). Rowley and Slack (2004) proposes four main strategies for gathering data, see table 2.4.
Table 2.4: Strategies for gathering data
Strategies Description
Citation pearl growing Uses phrases and terms from one or a few documents
to find new documents.
Breifsearch A quick-search that retrieves documents crudely and
quickly. It may be suitable to begin with this strat-egy of search.
Building blocks Terms and synonyms derived from relevant concepts
are used for retrieving a comprehensive set of docu-ments.
Successive fractions Aim to reduce an already retrieved large set of
doc-uments by searching within this set of docdoc-uments to eliminate less relevant data.
Based on the scope and research questions set forward in chapter 1, the theory was gathered and organized to form the literature review. Strategies used to find relevant data where citation pearl growing, breifsearch and building blocks. Search-strings that where initially used alone and later in combination with each other where SMEs, Scaleup, Startup, Operations Strategy, Supply Chain Management, Born Global, Scaling Supply Chain, Scaling Startup.
Archival Research
Archival records consist of data produced by the investigated case company, such as meeting minutes, strategic planning and financial information (Runeson and Höst 2009). By taking part of archival data, mainly at the primary case company, the researchers gained a better understanding of the different stages of development that the primary case company has undergone and where the company is headed in the near future. However, what can be a challenge when collecting data from archival records is to properly assess the quality of this data according to Runeson and Höst (ibid.). Therefore, the quality of archival records has always been verified with the management at the primary case company.
Interviews
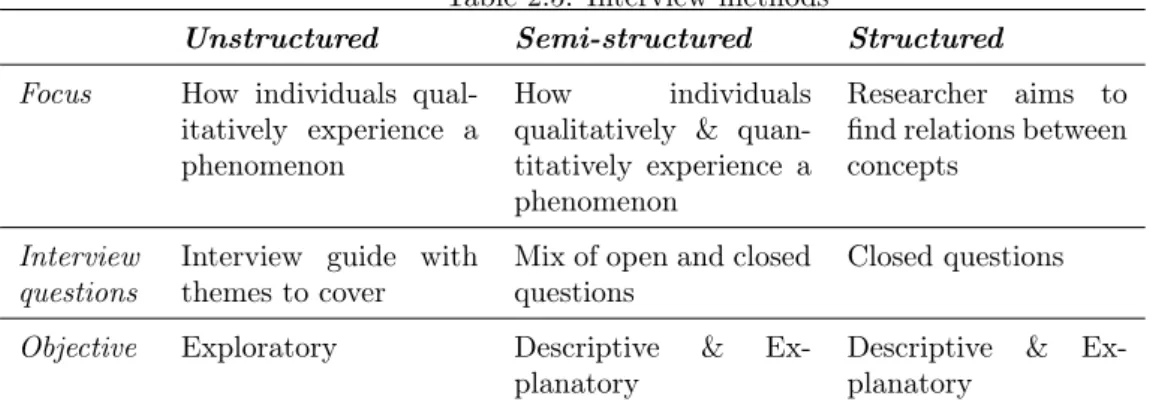
When carrying out a qualitative study, interviews are an effective way of gathering rich data. It is the flexibility of the method that makes it well suited to a qualitative study, where the interviewee’s perspective is of greater importance (Bryman and Bell 2015). Wohlin et al. (2012) present three types of interviews: unstructured, semi-structured and structured interviews. The characteristics of these strategies are presented in table 2.5. Unstructured interviews may consist of just a single question, and the interviewee is allowed to respond and elaborate freely (Bryman and Bell 2015). In a fully structured interview, pre-determined questions are asked, and the interview is more like a questionnaire Wohlin et al. (2012). Semi-structured interviews are something in between where
the researcher is free to ask questions in any order and to follow up with questions on other topics of interest (Bryman and Bell 2015).
Table 2.5: Interview methods
Unstructured Semi-structured Structured
Focus How individuals
qual-itatively experience a phenomenon
How individuals
qualitatively & quan-titatively experience a phenomenon
Researcher aims to
find relations between concepts
Interview questions
Interview guide with themes to cover
Mix of open and closed questions
Closed questions
Objective Exploratory Descriptive &
Ex-planatory
Descriptive &
Ex-planatory
As the focus of the study is mainly exploratory, unstructured and semi-structured interviews are chosen as the preferred methods. When conducting interviews at the main case company Minut, unstructured interviews are used to capture the broad nature of the problem and to help identify areas of concern or improvement unknown to the researchers. When later conducting interviews with sub-case companies, the study takes on a more descriptive and explanatory approach, semi-structured interviews will be used. The semi-semi-structured method is used to pinpoint similarities and differences between Minut and the sub-case companies as well as identifying key strategies.
Survey
As a complement to the literature review and the insights gained from the case studies, a survey in the form of a self-completion questionnaire was sent out to the interviewees at each case com-pany to collect data regarding performance measurements in the supply chain for a startup. In a self-completion questionnaire, respondents are responsible for completing the questionnaires them-selves. There are several advantages and disadvantages of using self-completion questionnaires. Bryman and Bell (ibid.) mentions a few, see table 2.6.
Table 2.6: Advantages and Disadvantages with Self-Completion Questionnaires
Advantages Disadvantages
- Cheap and quick to administer - No interviewer effects
- No interviewer variability - Convenience for respondents
- No opportunity to probe
- No ability to ask other questions - No ability to collect additional data - Difficult to know who completes the survey - Risk of missing data
- Not suitable for illiterate respondents - Low response rates
The tool used for designing the questionnaire and collecting data from respondents was Google Forms, as it enables for a quick and convenient way for sending out the questionnaire as well as monitoring and comparing the collected data between respondents. The questionnaire consisted of
thirteen questions with the majority being questions where the respondent was required to rank the importance of certain supply chain performance metrics. As to know which answer belonged to a specific case company, the representatives were asked to disclose the name of the company
in the survey. In order to mitigate the disadvantages associated with using a self-completion
questionnaire, it was designed with a focus on having a clear presentation together with clear instructions on how each question was to be answered. The use of open-ended questions was strictly limited to only one, which was to be answered only if the respondent had additional thoughts or comments that he or she wanted to share with the researchers. This way, the survey enabled for additional data to be collected. However, the additional data given was only based
on the initiative of the respondent and not the researcher. Thus, there might still be a risk
of missing relevant information compared to conducting an interview where the interviewers are given the opportunity to ask supplementing questions. In order to increase the response rates of the questionnaire, a follow-up email was sent to the respondents where the researchers provided more elaborate instructions on how to answer the questionnaire. The importance of completing the questionnaire for the sake of the research was also emphasized in the follow-up email.
2.2.3
Data Analysis
As a qualitative study is a flexible method, data analysis have to support this. Seaman (1999) proposes a set of qualitative data analysis methods first to generate a hypothesis and later build up a "weight of evidence" necessary to confirm the hypothesis. Runeson and Höst (2009) emphasizes the importance of keeping a clear chain of evidence to ensure a certain quality of the study. The first set of methods is used to generate hypothesizes and is commonly called grounded theory methods (Seaman 1999). Grounded theory is defined as "theory that was derived from data, systematically
gathered and analyzed through the research process. In this method, data collection, analysis,
and eventual theory stand in close relationship to one another” (Strauss and Corbin 1994). Thus, Bryman and Bell (2015) derives that the process is iterative and is concerned with the development of theory out of data. After generating a hypothesis, the new theory has to be strengthened by building up the "weight of evidence." Seaman (1999) also proposes methods for this purpose. Seaman (ibid.) proposes two separate methods for grounded theory. The first one, constant com-parison method, is concerned with generating new theory by attaching codes to relevant pieces of text in the data which are relevant to a specific theme or idea. The groups are analyzed to build propositions. The feasibility of the new proposition is checked against new data in the next data collection iteration. The second method, cross-case analysis, is concerned with generating new the-ory by cross-analyzing different cases to find similarities and differences. According to Eisenhardt (1989) the analysis of multiple cases should be based on looking at data in different ways. This is done by grouping or pairing cases and then examine for similarities and differences between and within each group or pair. Attributes for grouping or pairing could be for example the type of
product, the number of people involved or the source of data.
Any new hypothesis or theory cannot be confirmed, only supported or denied (Bryman and Bell 2015). The Weight of evidence is a means of strengthening a studies quality, thus making it harder to deny the proposed new theories. This can be build up either by qualitative or quantitative methods but is best done with a combination of both (Seaman 1999). Examples of these methods
are negative case analysis and member checking. Other qualitative ways of strengthening the
new theory are concerned with the quality of the study, which is further discussed in section 2.3. Quantitative ways of strengthening the data are usually related to statistical methods, such as surveys (ibid.).
As for this study, methods from both hypotheses generating and hypothesis confirming categories were incorporated. Firstly, the grounded theory methodology was used to generate theory from the collected data. Both the constant comparison method and cross-case analysis were applied to find hypotheses. Secondly, qualitative methods were used to confirm the found hypothesizes. Regarding qualitative methods, beyond what is covered in section 2.3, member checking was used. Regarding quantitative methods, a survey collecting comparable answers was conducted to answer research question three.
2.3
Research Quality
When evaluating the quality of business research, the level of reliability, generalizability, and validity are commonly used as criteria (Bryman and Bell 2015). However, these criteria are based on the assessment of quality for quantitative studies and should not be used in the evaluation of qualitative studies according to Guba, Lincoln, et al. (1994). Instead, they propose an evaluation of the quality based on the research’s trustworthiness and authenticity.
2.3.1
Trustworthiness
Trustworthiness consist of four criteria; credibility, transferability, dependability, and confirmability (ibid.). In table 2.7 a short explanation to each criterion is provided as described by Guba, Lincoln, et al. (ibid.), followed by actions taken by the researchers in order to satisfy the specific criterion.
Table 2.7: Trustworthiness criteria
Criterion Explanation Actions taken
Credibility Ensures that the research is carried out
according to good practice, and that the researcher confirms with the sub-jects that the interpretations in the study are accurate (i.e. respondent val-idation). Triangulation of data is also a technique used to ensure credibility.
The researchers have provided each par-ticipant of the study with an account of what he or she contributed with dur-ing the interview to establish an
ac-curate interpretation. To triangulate
data, multiple sources have been uti-lized, such as interviews from several companies and different theoretical per-spectives.
Transferability As qualitative studies focus on depth
rather than breadth, it is important that the researchers demonstrate how the results of the study can be trans-ferred to a different milieu. This can be achieved by providing detailed descrip-tions throughout the study.
A careful consideration between the amount of details provided and its rel-evance of the study has been made by the researchers, as not to overwhelm the readers with redundant information nor take away the focus from the intention of the study.
Dependability Refers to the systematic recording of
data during the research process that should be accessible in a convenient manner.
Interviews have been recorded and transcribed to increase the reliability of
the qualitative data. The researchers
have aimed at being transparent in the way of conducting the study by providing a detailed description of the methodology used.
Confirmability Concerns the level of objectivity by the
researcher in the study. The researcher should not incorporate own personal values in the study.
To achieve complete objectivity in a qualitative study is considered difficult. However, to fulfill this criterion the re-searchers have not interfered with the collected data prior to the analysis.
2.3.2
Authenticity
The purpose of evaluating a research based on its authenticity is to raise awareness regarding the possible wider political impact of the study (Guba, Lincoln, et al. 1994). To determine whether or not the criterion of authenticity is met, the study should be reviewed based on the following aspects according to Guba, Lincoln, et al. (ibid.), see table 2.8.
Table 2.8: Authenticity criteria
Criterion Explanation Actions taken
Fairness Concerns the representation of
dif-ferent viewpoints that participating subjects have expressed in the study.
Employees from different functions have been interviewed at the pri-mary case company in order to un-derstand each function’s viewpoint. Onthological &
ed-ucative authenticity
Refers to whether or not the re-search helps the participating sub-jects to better understand the com-plex phenomena, as well as the level of understanding of other members’ perspective the participating sub-jects receive through the study
Have been achieved through a reg-ular discussion with key players at the primary case company to ver-ify whether or not the research helps the subjects to understand the com-plex phenomena and the different viewpoints of each function. If not, changes have been made accord-ingly.
Catalytic & tactical authenticity
Concerns whether or not the re-search has acted as a catalyst for the studied subjects to actively change their circumstances, as well as the level of motivation provided by the research in order for the studied sub-jects to take the necessary steps re-quired to engage in action
The theoretical framework that is the result of the research has been developed in unison with the pri-mary company in order to ensure that it enables the company to take the necessary actions when they reach the critical point of having to rapidly scale up their business.
2.4
Summary of Methodology
A visual representation summarizing the methodology chosen for this study is shown in figure 2.1. Our belief is that this chosen methodology is the best possible research design in order to answer the research questions.
Figure 2.1: Summary of the method chosen for this study
A visual representation of the methodology of this entire project is shown in figure 2.2. The project starts with the purpose as well as the research questions. After that, the design of the study is set. From that, multiple iterations are conducted between literature review, theoretical framework, the empirics, analysis, and strategic framework. The reasons behind the iterations are to capture all insights as well as anchoring the empirics in the theoretical framework well.
Chapter 3
Theory
Literature relating to our research focus arises in three contexts. First, introduction to the global supply chain and supply chain management. Secondly, literature linking the industry character-istics, product type, the product life cycle, and the life cycle of an entrepreneurial venture with supply chain strategy. Lastly, literature on supply chain capabilities that will support the supply chain strategy and its accompanying objectives is presented.
3.1
Introduction
There is limited research on how a startup should go about defining its supply chain objective and how to measure its performance. Startups are constantly struggling with optimizing its use of resources, which are usually scarce. Lack of funds to hire employees makes time a constant issue for the startup, as it is the responsibility of only a few people to drive an entire business. This makes strategic, long-term planning less prioritized within the organization as the organization needs to allocate resources towards issues that need immediate attention. We argue that in order for a startup to identify the right strategy for its supply chain, management must first assess the characteristics of the industry that they are in order to determine the level of uncertainty both on the demand side as well as on the supply side. Secondly, management must identify and take into consideration the following factors: (1) the type of product the startup is producing, (2) the stage in the product life cycle where the product is currently at, and (3) the stage in the entrepreneurial life cycle where the organization is currently at. Together with the level of uncertainty in the market, these factors are the determinants of the startup’s supply chain strategy. Further, we argue that the management of the startup must assess how the capabilities of the startup’s supply chain network can help the startup to achieve its supply chain strategy and accompanying objectives. This theoretical framework is visually presented in figure 3.1.
Figure 3.1: Theoretical Framework developed for this study
3.2
Managing the Supply Chain
3.2.1
The Global Supply Chain
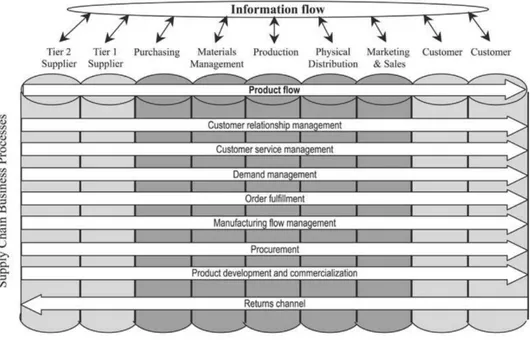
Mentzer et al. (2001) define the supply chain as "a set of three or more entities (organizations or individuals) directly involved in the upstream and downstream flows of products, services, finances, and/or information from a source to a customer". Figure 3.2 depicts the layout of a typical supply
chain process. Modern supply chains have become more dynamic and complex due to progressive liberalization and deregulation of international trade and investments, rapid changes in customer demand, and the emergence of the Internet (Hausman 2004). As an effect, many organizations now operate in multiple nations as they now have access to a global market that can drive higher volumes, and companies have also been given the opportunity to outsource activities to low-cost countries which is believed to result in reduced costs in the supply chain (Rose and Reeves 2017).
Figure 3.2: The Supply Chain Process (Beamon 1999)
However, operating a global supply chain is no easy task. Skjott-Larsen et al. (2007) recognize the following challenges that all are the result of a globalized world:
• The firm must offer customers across foreign markets a unique value proposition • The firm is facing competition from around the world
• The firm must adapt to the national environment of several countries. This includes adapting to different cultures, political-, economic-, legal-, and tax systems, as well as to differences in business practices
• The firm needs to tend to global politics of economic and trade relationships
• The firm must assess the country’s level of quality and availability of infrastructure in trans-port and telecommunications
• Time, distance, and location of markets will all have an impact on the supply chain’s perfor-mance
• Changes in monetary exchange rates need to be considered as it may impact the costs of supply chain activities taking place in foreign countries
Furthermore, the once single-site and vertically integrated firm now consists of several geographi-cally dispersed entities that partner up in order to capture market opportunities. All these entities that are spread across the world must be managed to work in unison in order to be flexible and fast enough to compete in a global market (Stock, Greis, and Kasarda 2000). Christopher (2016) states that even though it is a global market, there are still local preferences and requirements that must be taken into account when designing a product. Country-specific product certifications and
language in manuals are only a few examples. Additionally, companies must recognize the trade-off between using low-cost supply sources and the total cost of managing these at a distance as seen in figure 3.3. There has been an increase in fuel and transportation costs during recent years, which argues against vast geographical distances in the supply chain (Ellram, Tate, and Petersen 2013). Companies operating a global supply chain will also most likely have more tied up capital in in-ventory to hedge for delays in shipment, consolidation and customs clearance (Christopher 2016). What further should be recognized when evaluating these trade-offs is the fact that countries that once were considered to have low operations costs drastically have increased their cost of labor. One example is China, who has had an annual increase in labor cost of 15 percent to 20 percent (Rose and Reeves 2017).
Figure 3.3: Potential Cost Trade-Offs for Global Strategy (Christopher 2016)
Apart from the cost trade-offs mentioned, other issues need to be managed in a global supply chain. This includes an increased focus on companies to lower their carbon footprint, higher risk of having obsolete products due to short product life cycles, and difficulties with managing the level of quality throughout the supply chain. It is also essential to coordinate actors in the supply chain more intensively, such as managing the flow of cash and information, so that lead times and costs do not increase. This, in turn, leads to higher transaction costs according to Gereffi, Humphrey, and Sturgeon (2005).
However, there are several benefits of operating a global supply chain, such as improving overall quality, meeting the planned schedule, reducing cost, benefiting from new technologies, as well as extending the supply base (Handfield 1994). Tanev (2012) identifies several reasons as to why a small firm chooses to go global at an early stage. One reason is that it gives access to a bigger market to support the scale needed for the firm to be profitable. Another reason is that customer preferences for the product or service that the firm is offering are not linked to a geographical market. Thus, the offering does not require any modification when launching in a new country. This lowers the barriers for the firm to take their business global. For the business to be profitable,
the value of the product or service must also exceed the costs of the added complexity to the supply chain. To realize the benefits of a global supply chain, Handfield (1994) argue that a firm must align supply chain decisions with the business’ overall mission, objectives, and strategy.
3.2.2
Supply Chain Management
Due to the now global competition that organizations are facing today, time to market has become critical. This has resulted in the supply chain becoming a source of competitive advantage to achieve time to market in the most efficient and effective way, while at the same time ensuring that customer expectations are being met (Anand and Grover 2015). Thus, the practice of supply chain management has become an essential part of the success of a firm. Supply chain management is defined by Mentzer et al. (2001) as "the systemic, strategic coordination of the traditional business functions and the tactics across these business functions within a particular company and across businesses within the supply chain, for the purposes of improving the long-term performance of the individual companies and the supply chain as a whole". It is a complex matter of managing all the processes within the supply chain, spanning from sourcing of raw materials to providing post-purchase services for the customer. In figure 3.4, a framework for supply chain management is shown.
Figure 3.4: A Framework for Supply Chain Management (Chan and Qi 2003)
Supply chain management includes the following components according to Mentzer et al. (ibid.): information sharing, shared risks, cooperation among entities in the supply chain, aligning customer service goals and focus, integration of key processes, long-term relationships, and interfunctional coordination. Mentzer et al. (ibid.) argue that managing all this properly will result in lower costs, improved customer value, improved customer satisfaction, and a strengthened competitive
advantage. These are considered to be the key objectives of a supply chain. However, it is important to know what the value proposition of the company is in order to make the right trade-offs between efficiency and effectiveness so that the supply chain will be able to support the company accordingly. Being efficient means reducing costs in the supply chain, such as lowering inventory levels and leveraging on economies of scale, whereas being effective means providing availability by always having items in stock and ensuring high product quality. Nevertheless, what makes the supply chain profitable comes down to achieving the right balance between efficiency and effectiveness (Mentzer et al. 2001).
Supply Chain Strategies
Lee (2002) identifies four different supply chain strategies that a firm could pursue; efficient, respon-sive, risk-hedging, and agile. Efficient supply chains should pursue scale of economies, optimization in capacity and distribution and cost-efficient, accurate distribution of information across the sup-ply chain. Responsive supsup-ply chains should pursue strategies to be responsive and flexible to the changing demand and needs of the customer. Ways to become responsive are mass customization, excess inventory and capacity, and postponement. Risk-hedging supply chains should implement an efficient supply chain downstream and hedge for uncertainties upstream. As there might be some supply issues with certain components, the risk of disruption should be mitigated by multiple supply sources or by pooling safety stocks with other companies. Agile supply chains should pursue strategies to be responsive to demand uncertainty, like responsive supply chains are, while hedging for supply uncertainty upstream. The agility comes from mitigating the risks of supply shortages while still being responsive and flexible to customer needs. Morgan (2004) claims that agility is the strategic driver in the development of the supply chain of the 21st century. An agile supply chain responds quickly to customer demands, is equipped with customized manufacturing systems, it is flexible, the scheduling is synchronized with the final demand, the supply chain processes are controlled, capabilities with trading partners are integrated into the chain, e-trading can take place, it can handle concurrent product development and "pipeline" cost improvements (Hughes, Ralf, and Michels 1998).
In order to determine which strategy that is most suitable to pursue, Lee (2002) argue that different combinations of uncertainty benefit from different supply chain strategies. His model is presented in table 3.1. By reducing both demand and supply uncertainty, fewer resources are needed concerning excess inventory and capacity according to Lee (ibid.). Ways to minimize uncertainty are for example information sharing through the supply chain, early design collaboration, and collaborative replenishments.
Table 3.1: Lee’s Uncertainty Framework with Matching Supply Chain Strategies
Demand uncertainty low Demand uncertainty high
Supply uncertainty low Efficient supply chains Responsive supply chains
Supply uncertainty high Risk-hedging supply chains Agile supply chains
Chopra and Meindl (2006) present a three-step method for achieving strategic fit for a company and its supply chain strategy. The three steps are:
1. Understanding the customer and supply chain uncertainty 2. Understanding the supply chain capabilities
3. Achieving strategic fit
There are many parameters to consider when deciding upon a strategy for a company’s supply chain and the strategies suggested should not be viewed as either-or, but should rather be specially tailored according to the specific situation. Chopra and Meindl (ibid.) emphasize that to be able to achieve a strategic fit, all functions within the company such as product development, supply chain, and marketing must be aligned with the overall competitive strategy.
3.2.3
Performance Measurements in the Supply Chain
Performance measurement has been defined by Neely, Gregory, and Platts (1995) as "the process of quantifying the efficiency and effectiveness of action". Today, performance measurement has come to be viewed as an important tool for reviewing business management and identifying areas for improvement across industries. Measuring performance has also led to enhanced motivation at the workplace as well as improvements in communications between different functions (Chan and Qi 2003). Gunasekaran, C. Patel, and Tirtiroglu (2001) state that measuring activities in the supply chain is necessary in order to "streamline the flow of material, information, and cash, simplify the decision-making procedures, and eliminate non-value adding activities". However, there are several challenges associated with measuring the performance of a supply chain. Sink and Tuttle (1989) argue that you cannot manage what you cannot measure, yet it is of high importance to not only have the right metrics but also to have the right amount of metrics. Otherwise, the number of metrics will be difficult to manage and take action on (Chae 2009). This is especially true for startups, as they have limited resources that they need to manage effectively and efficiently (Rompho 2018). Thus, it is of high importance for a startup to chose the right metrics to focus its resources on. It is also important for the metrics chosen to have a holistic perspective as the goal is to integrate the different functions within the supply chain so it will operate as a single entity (Chan and Qi 2003).
The SCOR Model
Due to the difficulty of defining the right performance measurements, Chae (2009) proposes that companies use the Supply Chain Reference (SCOR) Model to identify proper metrics for measur-ing supply chain performance. SCOR is a model of the most critical business activities to satisfy customer demand, developed by the Supply Chain Council, and it is used by companies to under-stand, structure, and evaluate the performance of their supply chain (Council 2008). The SCOR model is divided into five core management processes as seen in figure 3.5 that together make up the supply chain of a company; (1) plan, (2) source, (3) make, (4) deliver, and (5) return.
Figure 3.5: SCOR Processes and the Supply Chain (Council 2008)
Plan refers to the process of aligning and organizing the other categories in the SCOR model, with the goal being to balance aggregate supply and demand to best meet supply chain require-ments, including sourcing, production, and delivery (ibid.). Source concerns processes associated with the procurement of goods and services necessary to create the actual output of the supply chain activities. This includes how a company should select suitable suppliers and evaluate their performance, as well as how to manage supplier payments (Li, Su, and X. Chen 2011). The make process encompasses activities that are part of the production process, where procured goods and services are transformed to a final state that is to be delivered to the customer. When the product has gone through the production step, the next supply chain process will be to deliver the product. This means transporting it either to its final destination or to a temporary location for storing before being sent off to the customer. Return concerns the return flow process of the product and is linked to the level of customer satisfaction. Having appropriate performance measurements within each function will increase the visibility of supply chain operations and help the company to assess their performance to make improvements where necessary (Anand and Grover 2015). The SCOR model has recognized five performance attributes that should be used to set the strategic direction of the supply chain, each being provided with diagnostic metrics for three process levels in the supply chain. The levels are (Council 2008):
• Level-1 metrics, also known as key performance indicators, measures the overall health of the supply chain
• Level-2 metrics further break down level-1 metrics to identify the root cause of the perfor-mance
• Level-3 metrics are diagnostic metrics for the level-2 metrics, helping firms to identify the root cause for a problem
The SCOR performance attributes and their level-1 metrics are described in table 5.4.
Table 3.2: SCOR Performance Attributes (Council 2008)
Attribute Strategy Key Performance Indicators
Customer
Reliability Consistently getting the
or-ders right, product meets
quality requirements
- Perfect order fulfillment
Responsiveness The consistent speed of
pro-viding products/services to
customers
- Order fulfillment cycle time
Agility The ability to respond to
changes in the market (exter-nal influences)
- Upside supply chain adaptability - Downside supply chain adaptability - Overall value at risk
In
ternal
Cost The cost associated with
man-aging and operating the sup-ply chain
- Total SCM costs - Cost of goods sold
Assets The effectiveness in managing
the supply chain’s assets in support of fulfillment
- Cash-to-cash cycle time - Return on SC fixed assets - Return on working capital
SCOR has become a preferred tool to use when evaluating the performance of a supply chain. This is due to its broad applicability and inclusiveness of the entire chain, its focus on creating value for the customer, and its standardized metrics which facilitates in benchmarking activities (Council 2008). However, there are several hundred metrics to choose from in the SCOR model, see appendix C for the SCOR metrics used in this research. To be successful, the company must ensure that the chosen metrics are aligned with its business, product strategy, and value proposition (Hausman 2004).
Choosing the Right Metrics
As the objective of the supply chain varies with the overall business strategy, it is important to recognize that one supply chain is not the other one alike. Hausman (ibid.) claims that the metrics need to be tailored to the company’s value proposition. If the strategy is low cost, management should monitor metrics such as costs, capacity utilization, and labor productivity. If the chosen strategy is responsiveness, proper metrics would be order response time, order change flexibility, and expediting capabilities (ibid.). Rompho (2018) also emphasizes that metrics must be tailored to the specific organizational and contextual factors of the firm. Rompho (ibid.) points out that this is especially the case regarding large corporations and a startup firm. Rompho (ibid.) argues
that the current research done on performance metrics are focused mainly on already big and established firms, and the proposed performance metrics in research is thus not applicable in the case of a startup. Even though there is not much research done regarding performance metrics for startups, measuring performance is still highly relevant in order for the startup to know where and how to improve to be successful (Davila and Foster 2005). The most significant difference between the metrics used for large firms and metrics that startup should use is their differences regarding the time perspective (Rompho 2018). Large firms tend to focus more on long-term planning, whereas startups have a more short-term focus. Many high-tech startup companies are funded by various kinds of investors, looking to make a profit in the future through an initial public offering (IPO) or through selling the company. For the startup, a primary goal is to generate enough revenue to continue operations and enable further search for a sustainable business model and market return (Lester, Parnell, and Carraher 2003). It is crucial to show the investors that the company is on the right track and not spending their money at a too fast rate. Important financial metrics to do this might be burn rate, cash-to-cash time and gross profit margin (Blank and Dorf 2012). Blank and Dorf (ibid.) argue that a startup should base its decisions on facts and implement decisions according to the plan. While sticking to these constraints, a firm should not search for the perfect solution but instead focus on speed. Keeping the momentum is more important, as well as having a tight feedback loop to identify and reverse bad decisions. The first step in choosing the right metrics is identifying the stage of the startup life cycle that the firm is currently in. This is due to the fact that stages differ in their nature, thus they require different focuses of their metrics (Rompho 2018). It has been concluded that when choosing the performance metrics, a startup must take into account the characteristics of the industry in order to assess the level of supply and demand uncertainty, the type of product that the startup is offering, the stage it is at both in regards to the product life cycle as well as the startup life cycle, the capabilities of its supply chain, and its overall value proposition.
3.3
Industry Characteristics
Lee (2002) argues that a firm can choose a proper supply chain strategy by mapping uncertainty both at the supply as well as the demand side. In order to determine the level of uncertainty in the market, it is important first to understand the market the company is operating in. To analyze and assess a specific industry, Michael E. Porter (1979) presented a comprehensive tool consisting of five forces that influence the competitiveness in an industry, see figure 3.6.
Figure 3.6: Porter’s Five Forces (Michael E. Porter 1979)
Although the model is almost 40 years old, to this date the model is still being used and taught. The five forces; threat of new entry, supplier and buyer power, threat of substitution and competitive rivalry, are summarized in table 8 in the appendix and further elaborated upon in the following sections.
Threat of New Entry
A new competitor poses a threat to existing firms in an industry as the newcomer brings new capacity and a desire to gain market share. The threat of new entry in an industry is dependent on the barriers to the industry. If barriers are high, then the threat is low. Capital requirements, economies of scale and cost disadvantages based on the learning curve (further developed upon in section 3.6.2) all make it especially hard for a startup to enter. Loyalty to an already existing brand as well as technology IP also limit the chances of new entry. A new firm to an industry faces a barrier when setting up its supply chain if they have to fight for shares in the distribution channel. This happens for example in a grocery store where each company competes for shelf space.
Supplier Power
A supplier might behave differently depending on their bargaining power and might raise prices or lower the quality of their products or services if they have much power. The power of a supplier group is dependent on if; it is dominated by just a few companies or is highly concentrated; there are high switching-costs or if the product is unique or highly differentiated; the supplier has the ability to integrate forward or; if the industry is not an important buyer of the supplier group.