BIOLOGICAL TREATMENT OF CAR WASH
WASTE WATERS – A REDUCTION SURVEY
Essi Malinen
1Nico Id
1Sanni Valtonen
1Janne Hakala
1Tiina Mononen
2Silja Kostia
1 1Lahti University of Applied Sciences, Faculty of Technology, Lahti, Finland
2University of Helsinki, Department of Environmental Sciences, Lahti, Finland
ABSTRACT
The purpose of this study was to examine how efficient a biological treatment process is in purifying car wash waste waters. Two Finnish automatic car washes having rotating bed biofilm reactors for waste water treatment were included in the study. Both of them are using 87 % of recycled water per car wash and only from 35 to 60 liters of fresh water. Samples were taken from the purified water tank every second week altogether seven times between the beginning of February and the end of May, 2012. The reduction of surfactants was at least 95 % and reduction of chemical oxygen demand (COD) between 87 and 95 % during the sampling period. Outdoor temperature seems not to have any significant effect on purification efficiency. Other water quality parameters such as conductivity, pH, oxygen concentration, total solids, and biological oxygen demand (BOD) were found to be on acceptable level based in comparison to values found in the literature. The high concentration of total nitrogen and total phosphorus in the purified water was caused by nutrients added to the bioreactor for optimal conditions for the microbes. In the studied car washes, the waste water treatment process managed to reduce input load considerably. The main challenges for the quality of purified water seems to be optimal nutrient input as well as on-line monitoring system for water quality.
KEYWORDS
Car washes, Biological waste water treatment, Water recycling.
1 INTRODUCTION
Due to diminishing global water supplies and growing number of cars, purifying and reusing car washing waste waters is sensible. The average water consumption per car washing without waste water treatment is 200–500 l. In tunnels, which have a higher washing capacity, water consumption is about 100–250 l/washing. Systems which use recycled water for both body and underbody washing reduce the water consumption by 80–90 %, and produce usually 20–60 l/
waste water per wash [1]. Water recycling in car washes is mandatory in some European countries. In Belgium, the water consumption of automatic car washes is on average 400 liter per a car and in the future 70 % of recycling is needed to obtain an environmental license [2, 3]. Waste waters from car washes consist of dirt from the cars like sand and dust, chemicals used for the washing, materials from washing equipment, as well as lubricants and other chemicals for maintaining the equipment [1]. Several applications have been developed and tested for treatment of car wash waste waters including for example ultrafiltration [4], nanofiltration [3], hollow fiber membranes [5], and electrochemical oxidation [6, 7].
In Finland, there are around 900 automatic car washes, which are often located at petrol stations, and about 10 million cars are washed in these car washes every year. Car washes do not need an environmental permit [8]. In Nordic countries the most common waste water treatment technologies in car washes are sand and oil separators. Less than 5 % of Finnish car washing facilities have an additional waste water treatment system method like sand, peat or activated carbon filter or biological treatment [1].
Biological treatment systems are sensitive to chemicals, so non-solvent type detergents are used for washing. Surface active agents (also called surfactants or tensides) are generally the active agents in car shampoos, rinses and waxes. They lower the surface tension of a liquid, the interfacial tension between two liquids, or that between a liquid and a solid. Usually, anionic and nonionic surfactants are used in washing and cleaning products. Positively charged cationic surfactants are used to neutralize the negatively charged surfaces. Zwitterionic (amphoteric) surfactants have two oppositely charged groups and are anionic in alkaline solution, cationic in acidic solution and neutral in uncharged solution [9]. High concentration of surfactants in waste water can inhibit autochthonous microorganisms. Surfactants increase permeability of the bacterial membranes and the adsorption of surfactants causes the depolarization of the cellular membranes [10]. The surfactant concentration in the medium cannot exceed 1000 mg/l in biological treatment [11]. However, more than 90-95 % of surfactants can be eliminated by waste water treatment plants under optimized conditions. All surfactant classes undergo primary biodegradation under aerobic conditions, but persistent biodegradation products can form since all compounds do not biodegrade completely [12].
The aim of the study was to examine how efficiently rotating bed biofilm reactors are purifying car wash waste waters. Two automatic car washes were followed for four months by analyzing samples and performing measurements every second week. Reduction of COD and surfactants during the purification process was calculated as well as other quality parameters for the reused water.
2 MATERIALS AND METHODS 2.1 Car washes
Two automatic car washes (CW) located in Southern Finland were used in this study (named CW1 and 5). Approximately 13 000 and 17 000 cars are washed per year in CW1 and CW5, respectively. An overview of automatic car washes is presented in Figure 1. Both car washes purify waste waters using rotating bed biofilm reactors and reuse the water for car washing. In CW1 two bioreactors (15 m3 each, consisting two compartments of similar size) are connected in parallel and placed under the ground. In CW5 four bioreactors (5 m3 each, consisting of two compartment of similar size) are connected in series and placed in a container. Both types of
bioreactors are commercially available. A schematic diagram of the waste water treatment process and reuse of water is presented in Figure 2.
Figure 1. Overview of the automatic car washing process.
1 4 5 Tap water 10 % 3 Nutrients 6 2 Reuse water
Figure 2. Schematic diagram of the waste water treatment process and reuse of water. 1 car washer; 2 sand separator; 3 rotating bed biofilm reactor (in series or in parallel); 4 flotation unit; 5 clean water tank; 6 sludge tank
2.2 Washing operations and detergents used in car washes
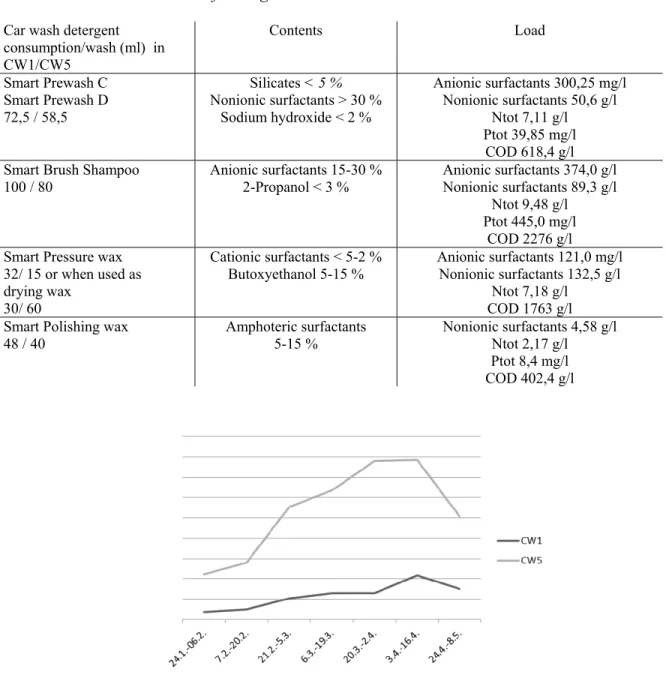
The two car washes involved in the study use same Pineline detergents (Swan Label by Ecolabelling Finland) manufactured by Tekno-Forest Ltd (Table 1). Altogether 14 different washing operations are provided in the car washes consisting of from one to five units (pre-wash, washing with or without brushes etc.) Consumption of detergents varies between different operations. The consumption was experimentally tested in CW1 by measuring the amount of chemicals by weight in a test wash. The detergent consumption in CW5 was calculated using mean of measurements from previous spring 2011 provided by the operator. The load of detergents was examined using Hach lange Photometric tests using dilutions from 1:10 to 1:1 000 000. During the sampling period the number of washes was on average 5 times higher in CW5
than in CW1 and the relative number of car washes is presented in Figure 3. The numbers of washes increased towards the spring and begin to drop in the end of April.
Table 1: Contents and load of detergents used in CW1 and 5.
Car wash detergent consumption/wash (ml) in CW1/CW5 Contents Load Smart Prewash C Smart Prewash D 72,5 / 58,5 Silicates < 5 % Nonionic surfactants > 30 % Sodium hydroxide < 2 % Anionic surfactants 300,25 mg/l Nonionic surfactants 50,6 g/l Ntot 7,11 g/l Ptot 39,85 mg/l COD 618,4 g/l Smart Brush Shampoo
100 / 80 Anionic surfactants 15-30 % 2-Propanol < 3 % Anionic surfactants 374,0 g/l Nonionic surfactants 89,3 g/l Ntot 9,48 g/l
Ptot 445,0 mg/l COD 2276 g/l Smart Pressure wax
32/ 15 or when used as drying wax
30/ 60
Cationic surfactants < 5-2 %
Butoxyethanol 5-15 % Anionic surfactants 121,0 mg/l Nonionic surfactants 132,5 g/l Ntot 7,18 g/l
COD 1763 g/l Smart Polishing wax
48 / 40 Amphoteric surfactants 5-15 % Nonionic surfactants 4,58 g/l Ntot 2,17 g/l Ptot 8,4 mg/l COD 402,4 g/l
Figure 3. The relative number of car washes of CW1 and CW5 during the testing period.
2.3 Sampling, measurements and laboratory analyses
The sampling period lasted from February 2012 to middle of May 2012. Sampling was done every two weeks, a total of 7 times, and samples were taken from the purified water tank which is reused for car washing. COD, BOD, suspended solids, nitrogen, phosphorus, surfactants,
turbidity, conductivity, oxygen, pH and temperature were analyzed every time. Concentration of chlorides was also analyzed 6 times in commercial laboratory.
COD, Ntot, Ptot, anionic and nonionic surfactants were analysed using Hach lange photometric tests and BOD with OxiTop (WTW). Suspended solids were analyzed according to standard SFS-EN 872 using Glass Microfibre Filters GF/C 47 m (Whatmann). Conductivity, oxygen and pH were measured using WTW Multi 3410 and turbidity with Turb 555IR (WTW).
2.4 Calculation of reduction
Reduction of COD and detergent load (anionic and nonionic surfactants) during the purification process was calculated comparing calculated input load (from detergents and reused water) to analysis result of purified water (outflow). The input load was estimated as follows:
((CW x D x L) + R) : W
(CW) = number of different car washing operations in two weeks period before sampling (information from sales database).
(D) = amount of detergent / wash (Table 1). (L) = chemical load of five detergents (Table 1).
(R) = chemical load of reused water in two weeks period before sampling calculated using analysis results from purified water and multiplying with the amount of reused water consumed in two weeks period.
(W) = amount of used water in two weeks period before sampling (tap water and reused water). Mean value was calculated using the value from beginning and end of two weeks period.
3 RESULTS AND DISCUSSION 3.1 Reduction of COD and surfactants
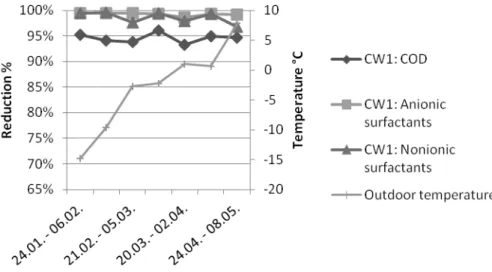
The mean of COD and surfactants reductions (Figure 4a and 4b) were calculated using results of seven sampling times. However, the error situation (3.4. – 16.4.2012) of CW5 was excluded. The average COD reductions were 95 and 87 % in CW1 and in CW5, respectively. The reduction of anionic surfactants was almost complete in the aerobic treatment; the average reduction was 99 % and 97 % in CW1 and in CW5, respectively. Also, the reduction of nonionic surfactants was almost complete; average reduction was 99 % and 95 %, in CW1 and in CW5, respectively.
Figure 4a. Reduction of COD and surfactants in CW1 and the mean of daily outdoor temperatures.
Figure 4b. Reduction of COD and surfactants in CW5 and the mean of daily outdoor temperatures.
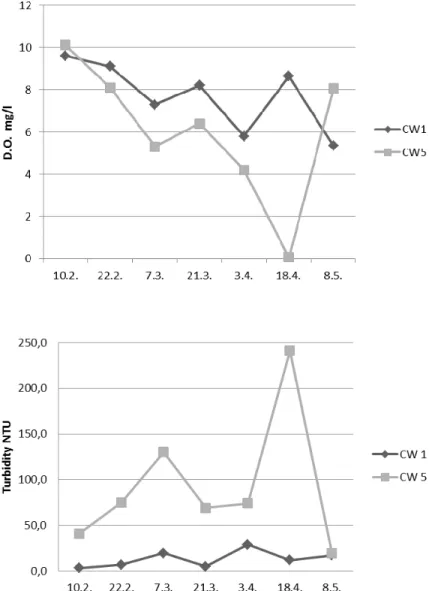
One reason for worse purification capacity of CW5 than CW1 was most probably lack of oxygen. The average oxygen concentration in purified water tank during the sampling period was 7 mg/l in CW5 and 8 mg/l in CW1. The amount of dissolved oxygen was lower in CW5 than in CW1 at all the other sampling times except the first and the last one. In accordance, turbidity was much higher in CW5 than in CW1 except at the last sampling time (Figure 5). In April the oxygen concentration dropped to almost zero in CW5 and a peak in turbidity was also observed (Figure
5). The reason for that was that aeration blower of the bioreactor was broken, which was clearly
indicated by low dissolved oxygen concentration and turbidity measured in purified water tank. The number of washing operations was highest when the level of oxygen was lowest in CW5. One objective of the study was to determine the effect of temperature on the biological treatment
process and degradation of surfactants. Although it was very cold outside at some sampling points (Figure 4a and 4b), the temperature seemed not to have any effect on purification capacity.
Figure 5. Dissolved oxygen (top) and turbidity (lower) measured from purified water tank of car washes CW1 and 5.
3.2 Quality of reused water
pH, BOD, COD, suspended solids and turbidity analyzed from purified water were compared to standards in Flanders (EU) and China (Table 2). The average values of CW1 are mainly below the standards in Flanders but the average values of CW5 are higher than those. When the dissolved oxygen levels measured from the purified water tank were at a good level in CW5 (10.2., 22.2., 8.5., see Figure 5) also BOD, COD, SS and turbidity values were much lower and at
best below the standards in Flanders. However, mean turbidity exceeded the criteria in China in both car washes. All quality parameters of outflow treated with hollow fiber membrane aided by enhanced coagulation and activated carbon treatments satisfied the criteria of China [5].
Table 2: Mean of quality parameters of purified water in CW1 and 5 calculated from values measured during the sampling period (the minimum and maximum is presented in brackets).
Quality parameter CW1 CW5 Standards in
Flanders [3]
Criteria of China (GB/T 18920-2002) [5] BOD (mg/l) 17 (4-43) (BOD7) 146 (20–372) <25 (BOD520) 10 (BOD5) COD (mg/l) 126 (87–152) 313 (116–652) <125 50 (CODCr)
SS (mg/l) 18 (6-33) 112 (53–218) <60 5
Turbidity (NTU) 13 (3-29) 93 (20–241) - 5
pH 7.87 (7.61–8.11) 7.54 (7.24–8.00) 6.5-9 6.5-9
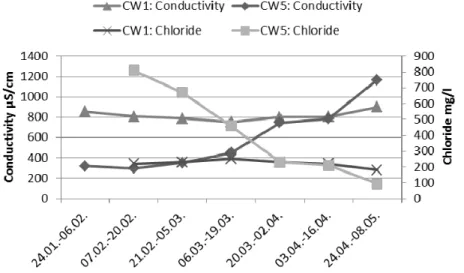
In a previous study (S.K., unpublished) high conductivity values were measured from purified water. In this study, the chloride concentration was analyzed to find out if there is a correlation between road salting and high conductivity (Figure 6). Based on the results, road salting is not the reason for increase in conductivity. Chloride concentrations seem to decrease and conductivity increase when the amount of washes increases during the spring (see figure 3), especially in CW5. The reason for high concentration of chlorides in CW5 must be further studied. The chloride concentration of CW1 was below the criteria of China (300 mg/l) during the whole sampling period.
Figure 6. Conductivity and chloride concentrations (not analyzed in February 10th) in CW1 and 5.
3.3 Nutrient supply
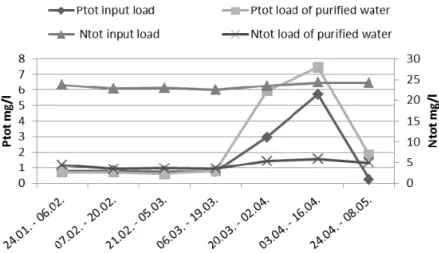
Total phosphorus and nitrogen in input and purified water consist of load from reused water and from surfactants as well as nutrient supply (Figure 7 and 8). Phosphorus and nitrogen are fed manually to the process by an operator and exact amount of amendment is not known. In optimum situation microbes use all the nutrients during the purification process. In CW1 nutrient balance is pretty good except the excess load of phosphorous in April probably because of growing number of car washing operations (Figure 3). In CW5, the optimization of nutrient feed is getting better during the sampling period. The effect of the broken aeration blower can also be seen in poorer removal of nitrogen by microbes. Biological treatment of car washing waste waters needs some extra nutrients but it should be better optimized and controlled.
Figure 7. Total phosphorous and nitrogen in CW1 in input and purified water.
3.4 Water consumption
Wastewater treatment of car washes aims at closed water systems and savings of clean water. In CW1 and 5 only 10 % (from 35 to 60 liters) of all the water used for washing is clean tap water which is used for the final rinsing and also recovers the water, which is lost during the process because of evaporation and spilling. Assuming that approximately 30 000 cars are washed in an automatic car wash, and 200 liters are used in car washed without water reuse, 140 liters is saved in every wash in closed water system resulting in 4200 m3 water saving per year.
4 CONCLUSIONS
We conclude that car wash waste waters can be efficiently purified using biological waste water treatment. By reusing purified water for car washing it is possible to save considerable amounts of water. Nutrient supply is needed in biological treatment but application should be developed further to replace manual feed and thus avoid overload of nutrients.
ACKNOWLEDGEMENT
This study has been funded by TEKES (The Finnish Funding Agency for Technology and Innovations). We are grateful for car wash operator Seppo Palo and Jukka Nikkanen, Juho Roine, Heikki Salmela, Nico Salmela (Clewer Oy) and Esa Mäkinen (Pineline) for co-operation and valuable comments.
REFERENCES
[1] Norden 2007. BAT – car washing facilities. TemaNord, 587.
[2] Huybrechts, D., De Baere, P., Van Espen, L., Wellens, B and Dijkmans, R. 2002. Best available techniques for carwash and truckwash, BBT study VITO;
http://www.emis.vito.be
[3] Boussu, K., Kindts, C., Vandecasteele, B. and Van der Bruggen, B. 2007. Applicability of nanofiltration in the carwash industry. Separation and Purification Technology, 54, 139-146.
[4] Hamada, T. and Miyazaki, Y. 2004. Reuse of carwash water with a cellulose acetate ultrafiltration membrane aided by flocculation and activated carbon treatments.
Desalination, 169, 257-267.
[5] Li, T., Xue-jun, T., Fu-yi, C., Qi, Z. and Jun, Y. 2007. Reuse of carwash wastewater with hollow fiber membrane aided by enhanced coagulation and activated carbon treatments.
Water Science and Technology, 56(12), 111-118.
[6] Panizza, M., Delucchi, M. and Cerisola, G. 2005. Electrochemical degradation of anionic surfactants. Journal of Applied Electrochemistry, 35, 357-361.
[7] Panizza, M. and Cerisola, G. 2010. Applicability of electrochemical methods to carwash wastewaters for reuse. Part 1: Anodic oxidation with diamond and lead dioxide anodes.
Journal of Electroanalytical Chemistry, 638, 28-32.
[9] The Finnish Cosmetic, Toiletry and Detergent Association 2006. Pyykinpesuaineiden toiminta (Functioning of detregents). http://www.teknokem.fi/pesuaktiiviset_aineet (accessed 11 July 2012)
[10] Aloui, F., Kchaou, S. and Sayadi, S. 2009. Physicochemical treatments of anionic surfactants wastewater: Effect on aerobic biodegradability. Journal of hazardous
materials, 164, 353-359.
[11] ADEME 2001. Agence de l’Environnement et de la Maîtrise de l’Energie, Direction de l’Agriculture et des Bioénergies. Tensioactif et Oléagineux Etude sur les matières premières oléagineuses disponibles sur le marché européen pour la production de tensioactifs.
[12] González, S., Petrovic, M. and Barceló, D. 2007. Removal of a broad range of surfactants from municipal wastewater – Comparison between membrane bioreactor and conventional activated sludge treatment. Chemosphere, 67, 335-343.