Sveriges Lantbruksuniversitet
Självständigt arbete i skogsvetenskap, 15 hp Jägmästarprogrammet
Umeå
Evaluation of GM trees expressing a fungal
enzyme
-
Investigating the effects of the fungal enzyme on activation of
jasmonate signaling using JAZ10:GUS reporter lines of Arabidopsis
Utvärdering av GM-träd som uttrycker svampenzym
- Undersöker effekten av svampenzymer effekt på aktiveringen av
jasmonatsignalering med hjälp av JAZ10:GUS reporterlinje i Arabidopsis
Elin Bäckström & Therese Thalin
Kandidatarbeten
2019:3
i skogsvetenskap
1
Enhet/Unit Institutionen för skogens ekologi och skötsel Department of Forest Ecology and Management
Författare/Author Elin Bäckström & Therese Thalin
Titel, Sv
Utvärdering av GM-träd som uttrycker svampenzym - Undersöker effekten av svampenzymer effekt på aktiveringen av jasmonatsignalering med hjälp av JAZ10:GUS reporterlinje i Arabidopsis
Titel, Eng
Evaluation of GM trees expressing a fungal enzyme - Investigating the effects of the fungal enzyme on activation of jasmonate signaling using JAZ10:GUS reporter lines of Arabidopsis
Nyckelord/ Keywords
Cellväggsbildning, cellväggskomposition,
genmodifiering, genetisk förädling, GUS/ cell wall formation, cell wall composition, genetic modification, genetic improvement, GUS
Handledare/Supervisor
Ewa Mellerowicz, UPSC, Dept Forest Genetics and Plant Physiology, /Institutionen för skoglig genetik och växtfysiologi
Examinator/Examiner Tommy Mörling
Institutionen för skogens ekologi och skötsel/ Department of Forest Ecology and Management
Kurstitel/Course Kandidatarbete i skogsvetenskap
Bachelor Degree in Forest Science
Kurskod EX0911
Program Jägmästarprogrammet
Omfattning på arbetet/ 15 hp
Nivå och fördjupning på arbetet G2E
Utgivningsort Umeå
Utgivningsår 2019
Serie Kandidatarbeten i Skogsvetenskap
Kandidatarbeten i Skogsvetenskap
Fakulteten för skogsvetenskap,
2
PREFACE
This is part of a bigger project where fungal GE has been transgenically expressed in Arabidopsis and aspen, and their xylem properties are further tested for biorefinery. The project will help to understand the mechanism of stress induction in plants expressing GE ectopically.
We would like to thank Ewa Mellerowicz for being our supervisor and letting us take part in her science project. We also thank Evgeniy Donev for guiding and supporting us through the work process during this study.
3
ABSTRACT
The fungi enzyme glucuronoyl esterase can be used to change the cell wall composition in plants for easier extraction of cellulosic biomass compounds for the production of
biomaterials and biofuels. However, previous studies have shown that expression of
glucuronoyl esterase in plants causes stress response, mediated by jasmonate signaling, and growth penalty. In this study, the GUS reporter system for jasmonate signaling was used to test if the transgenic plants react to the activity of glucuronoyl esterase or to the presence of foreign protein.
Arabidopsis line expressing JAZ10:GUS construct was used to test effects of glucuronoyl esterase applications on seven days old seedlings. The results obtained indicate that the fungal enzyme is recognized by the plant as pathogenic. The hypothesis that the activity contributes to the stress response cannot be rejected, therefore, further testing is needed to prove that. It was also concluded that the experiment require high number of plants samples for clear results, and that small disturbances of the seedlings can induce temporary stress response. Therefore, the time lag period between the selection of seedlings and the application of the enzyme should be at least 24 hours to avoid unwanted stress response.
Keywords: cell wall formation, cell wall composition, genetic modification, genetic improvement, GUS
4
SAMMANFATTNING
Svampenzymet glucuronoylesteras kan användas för att förändra cellväggskompositionen i växter för enklare extraktion av cellulosahaltiga biomassakomponenter, vilket är intressant för produktionen av olika biomaterial och biobränslen. Tidigare studier visar däremot att uttryck av glucuronoylesteras i plantor orsakar stress signalerad av jasmonater, samt förlorad tillväxt. I denna studie användes GUS-reportersystem för att undersöka om transgena
Arabidopsisplantorna reagerar på enzymets aktivitet, eller känner igen enzymet som patogent. En Arabidopsislinje som uttrycker JAZ10:GUS-konstruktion användes för att testa effekterna av glucuronoylesteras applicering på sju dagar gamla plantor. De erhållna resultaten indikerar att svampenzymet känns igen som en patogen, men hypotesen om att aktiviteten kan bidra till stressresponsen kan inte avvisas. Därför krävs ytterligare tester för att konfirmera eller
utesluta aktivitetens påverkan. Det fastslogs också att experimentet kräver stor mängd plantor för att ge säkra resultat, samt att små störningar kring plantan kan inducera tillfällig
stressrespons. Därför bör vilotiden mellan selektion och applikationen av substanserna vara minst 24 timmar, för att undvika oönskad stress.
Nyckelord: Cellväggsbildning, cellväggskomposition, genmodifiering, genetisk förädling, GUS
5
Table of contents
1. INTRODUCTION 6
1.1. Tree improvement for future needs 6
1.2 Wood structure and components 6
1.2.1. Cellulose 7
1.2.2. Lignin 7
1.2.3. Hemicellulose 8
1.2.4. Lignin-carbohydrate complexes 8
1.3. Fungal Glucuronoyl Esterase 8
1.4. Plant stress response 9
1.4.1. Jasmonate 9
1.4.2. JAZ10 9
1.4.3. JAZ10:GUS reporter system 10
1.5. Aim 10
2. MATERIALS AND METHODS 11
2.1. GUS-JASMONATE signaling experiment 11
2.1.1. Factors 11
2.1.2. Seed sterilization 11
2.1.3. Plant growth conditions 11
2.1.4. Selection and treatment 12
2.1.5. GUS staining and activity 12
2.1.6. Creation of staining scale 13
2.2 Statistical analysis 14
3. RESULTS 15
3.1 Results from staining 15
3.2. Result from Pearson correlation test 18
3.3. Result from ANOVA and the Duncan test 19
4. DISCUSSION 21
6
1. INTRODUCTION
1.1. Tree improvement for future needs
With a rapidly growing world population and increasing standards of living, mainly due to rising incomes in developing countries, providing enough energy to sustain our modern living standard is a rising problem. Currently, fossil carbon sources formed over millions of years by decomposing plant and animal remains are used to meet the energy demand. The steadily increasing consumption rate of these finite resources results in higher levels of released carbon dioxide in the atmosphere, which could be one of the key factors contributing to current climate change (Vanholme, et al., 2013).
Sustainable and renewable resources such as bio-based materials and fuels, has the potential to replace the use of fossil fuels. Traditional breeding is one way of improving trees, to meet the various demands and increase the yield, to support the transition to a sustainable society (Vanholme, et al., 2013). However, it is a time-consuming process and needs many
generations of crossing to produce plants with desired traits (N. R. C. (US) Board on Agriculture, 1984).
Compared to traditional breeding, a targeted genetic modification has the advantage to change or suppress the expressions levels of selected gene or genes, introduce genes from a foreign organism into the genome, or even randomly induce mutations in the genome. In such way a Gene Modified(GM) plant could be designed, with targeted beneficial properties. Unlike traditional breeding the GM methods modify only the genes of interest, which rises a number of new options, not only for optimization of the process of plant selection, but also for generating a new knowledge among the plant science community (N. R. C. (US) Board on Agriculture, 1984).
1.2 Wood structure and components
Plant biomass is an abundant and renewable resource mainly composed by carbohydrate polymers, such as cellulose, hemicelluloses and the polyphenolic compounds, the lignins. These compounds can be found in the cell wall, which consists of the middle lamella, which glues adjacent cells together, the primary cell wall and the secondary cell wall layers (Evert & Eichhorn, 2013).
The plant secondary cell wall contains cellulose, hemicelluloses and lignin. Among other functions the complex network formed by these polymers provides the strength needed to withstand mechanical stress, forms an important barrier protecting the cells against pests and pathogens, and enables the water transport through the xylem (Vanholme, et al., 2013).
The heterogeneity and complex molecular structure of the polysaccharides and lignin limits the effect of enzymatic hydrolysis for production of biofuels and other commodities (Vega-Sanchez & Ronald, 2010). Green biotechnology shows an enormous potential to design plant
7
cell walls for easier extraction and processing (Vanholme, et al., 2013). To improve the bioconversion of lignocellulosic raw materials to biofuels, it is important to investigate how each compound of the woody biomass affects the recalcitrance of it. This knowledge makes it possible to design plants with reduced wood recalcitrance, characterized by higher recovery rate of cellulosic and non-cellulosic wood polysaccharides (Vega-Sanchez & Ronald, 2010).
1.2.1. Cellulose
Cellulose is the major component of woody plants and natural fibers. It constitutes about 50% of the wood dry weight, whereas cotton fibers are almost pure cellulose. In fact, cellulose is the most abundant organic polymer in the world, containing half of the worlds organic carbon (Evert & Eichhorn, 2013). Cellulose is a polysaccharide composed of glucose monomers, similar to starch and glycogen, but because cellulose has β-glucose linkages, instead of α-linkages, it receives a different three-dimensional structure which is long and unbranched. The OH-groups of the monomers forms hydrogen bonds with the neighboring cellulose chain, which are further bundled into crystalline microfibrils (DeCoste, 2015; Evert & Eichhorn, 2013).
The crystalline structure formed by β-linkages makes cellulose difficult to dismantle and therefore, cellulose cannot be used as energy source by most of the living organisms, unlike starch and glycogen. However, organisms capable of breaking down the cellulose can be found among microorganisms, such as certain bacteria and fungi (DeCoste, 2015; Evert & Eichhorn, 2013).
1.2.2. Lignin
Lignin is a major component of wood, contributing 15-36 % of the dry weight (Vanholme, et al., 2013). Its complexity makes it difficult to degrade for pests and pathogens, which is beneficial for the plant, but from an industrial point of view lignin increases the recalcitrance which negatively affects the pulping and saccharification processes (Zeng, et al., 2014). Easier extraction of lignin would improve the yield of wood polymers and make the process more energy efficient, increasing the yield of ethanol (Chen & Dixon, 2007).
The molecular structure of lignin varies, as the three lignin precursors; p-coumaryl alcohol, coniferyl alcohol, and sinapyl alcohol are put together in various numbers and combinations. In the plant, lignin is mainly found in the middle lamella and the secondary cell wall,
rigidifying the plant cell wall even after the programmed cell death (Pesquet, et al., 2013). Different solutions on how to overcome the recalcitrance have been tested, such as reducing the lignin content or changing the precursor ratio (Mahon & Mansfield, 2019). Reducing the lignin content have increased the saccharification yield, but also resulted in growth penalty not compensated by the increased sugars recovery. Changing the ratio between the
8
is the most labile building-block, increased the yield without any growth deficit (Van Acker, et al., 2013).
1.2.3. Hemicellulose
Hemicelluloses are usually the second most abundant component of lignocellulosic biomass, contributing 20–35% of the dry weight in wood (Khatib, 2009). Hemicellulose are
structurally similar to cellulose, with a backbone consisting either of β -(1 → 4) linked glucose, xylose or mannose (Naraian & Gautam, 2018). Also, the cellulose is ordered as a microfibrils framework while the hemicelluloses are branched and cross linked. The polymerization degree of hemicelluloses ranges from 100 to 200 sugar units (Fan & Fu, 2017).
Hemicelluloses form hydrogen bonds to the cellulose microfibrils in both primary and secondary cell wall (Evert & Eichhorn, 2013). They also bind covalently to lignin, forming ester and ether linkages based on the hemicellulose side group (Gandla, et al., 2015).
1.2.4. Lignin-carbohydrate complexes
Lignin, cellulose and hemicellulose form highly recalcitrant complexes in which the
separation of lignin from the carbohydrates is a challenging process because of the existence of covalent bonds between them (Balakshin, 2011). The most common linkages between lignin and carbohydrates are thought to be phenyl glycoside bonds, esters and benzyl ethers, depending on species. In hardwoods, however, the phenyl glycosidic bonds are the
predominant linkages. Due to the high alkali resistance of the benzyl and phenyl glycosidic bonds, they can affect kraft pulping and delignification negatively (Tarasov, 2018).
1.3. Fungal Glucuronoyl Esterase
Glucuronoyl esterase enzyme (GE), found in both fungi and bacteria, participates in the degradation process of plant biomass (Biely, 2017). GE is active under typical acidic conditions for the plant cell wall, hydrolyzing the ester bond between 4-O-methyl-a-D-glucuronic acid of 4-O-Methyl-Glucuronoxylans and lignin (Arnling Bååth et al., 2016) . It might be possible to reduce cell wall recalcitrance with transgenic expression of GE in plants, which is of interest when improving the recovery of xylan from plant biomass. However, when GE from Phanerochaete carnosa (PcGCE) was expressed in Arabidopsis and hybrid aspen, growth penalty and stress response were observed in the transgenic plants (Tsai, et al., 2012; Gahndla, et al., 2015).
9
1.4. Plant stress response
In nature, plants interact with a broad range of below and above soil organisms, which also includes pathogenic fungi and herbivores, each possessing different invasion strategies. This has led to the development of sophisticated immune systems in plants, that recognize
invaders and activate plant defense mechanisms (Jones & Dangl, 2006). The immune system is regulated and controlled by hormones, where salicylic acid and jasmonic acid play key roles in the signaling activating the inducible defense (Pieterse, et al., 2012).
Plants have two main types of defenses against pathogen invasions; pre-existing and inducible. The pre-existing defense protects against pathogens by physical or chemical barriers, such as thorns or stinging hairs. The inducible defense is triggered by either recognition of pathogen molecules or by damage associated with host molecules (Jones & Dangl, 2006).
The inducible defense can also be triggered by the volatile organic compounds produced by nearby plants that are under attack (Kessler, et al., 2006). Such responses can be shown to be triggered by spraying the leaves of a plant with jasmonic acid that leads to synthesis of herbivore restricting compounds in plants not affected by any other stress conditions (Farmer & Ryan, 1990).
1.4.1. Jasmonate
Jasmonates are signaling molecules in the plants produced in response to a variety of biotic and abiotic stresses. They derive from linolenic acid. The term jasmonate includes both the jasmonic acid and the intermediates of the acid biosynthesis, and the active derivatives (Turner, et al., 2002).
Jasmonic acid and its derivatives also regulates fruit ripening, resistance to pests and pathogens, root growth, tendril coiling and production of mature pollen in Arabidopsis. Jasmonate can alter the activity and the resistance of the plant, through control of
photosynthesis genes and vegetative storage proteins in the plant (Creelman & Mullet, 1997).
1.4.2. JAZ10
JAZ10 belongs to a family of 12 protein coding genes which are named Jasmonate Zim-domain (JAZ). JAZ proteins were found in plants, and not in animals, yeast or bacteria, indicating that JAZ proteins are plant specific (Chini, et al., 2007). JAZ10 is a jasmonate activated gene (Acosta, et al. 2013) known to be induced from stress caused by mechanical damage, pathogen attack and water deficit (Chini, et al., 2007).
10
1.4.3. JAZ10:GUS reporter system
GUS reporter system is a practical way of tracing specific gene expression, where a promotor of a gene of interest is fused to the GUS (β-glucuronidase) reporter gene. The gene coding for the GUS enzyme is found in E. coli (Escherichia coli). GUS catalyzes the hydrolysis of different glucuronides (Jefferson, 1986). When using the GUS reporter system in plants the most commonly used substrate is X-gluc (X-glucuronide), where the colorless 5-br-4-Cl-3-indolyl is converted into the final blue colored product indigo (Craig, S. 1992).
1.5. Aim
In this study the GUS reporter system was used to test if jasmonate signaling is triggered by drop application of the fungal enzyme GE on the cotyledon of seven days old Arabidopsis plants. The main questions to be answer in this study were: (i) is a certain peptide motif of GE recognized as pathogenic by the plant, or (ii) do the plants respond to the GE activity? This is one of the first studies investigating these particular questions and this will serve as a pilot study for future studies.
11
2. MATERIALS AND METHODS
2.1. GUS-JASMONATE signaling experiment2.1.1. Factors
Different factors were used, to specify what underlying mechanism could trigger plant stress response, when applied to the cotyledons of seven days old Arabidopsis plants.
The factors tested were (1) bovine serum albumin (BSA), (2) denatured BSA, (3) mutated GE, (4) denatured mutated GE , (5) active GE, (6) denatured active enzyme, (7) buffer, (8) selected unwounded, (9) untouched and (10) wounded.
BSA is an artificial protein, which was to test if the plant would react to any kind of foreign protein. The denatured BSA was used to test if the plant could be triggered by denatured proteins, possibly precipitating on the leaf surface.
The mutated GE has a single point mutation at the active site and its enzymatic activity is lost. It is used to test if the plant reacts to the GE peptide itself rather than to its enzymatic activity. The denatured mutated enzyme and denatured active enzyme were also used to test if the plant is able to recognize a certain domain motif of GE as pathogenic.
The buffer, selected unwounded, untouched and wounded factors worked as controls. The wounded plants give a strong stress response, turning blue from the GUS staining. The untouched factor was added as a control for the selected unwounded, after suspecting that seedlings selection could induce stress. The buffer tested if the plant reacted to having a drop applied to the cotyledon. The same buffer was used to suspend the proteins.
2.1.2. Seed sterilization
Sterilization was performed in a sterile hood. JAZ10-GUS seeds were placed in a 1.5 ml Eppendorf tube. 1 ml of 70% ethanol was added, then the tube was incubated for 5 min, followed by five washings with sterile water. After that, 1 ml of 30 % chlorine mixed with 0.1% Triton x-100 was added and incubated for 10 minutes before rinsing the seeds six times with sterile water. The seeds were kept in sterile water at 4°C for 48 h, after which they were ready for planting on media.
2.1.3. Plant growth conditions
The plants were grown in plastic jars containing half-strength Murashige and Skoog solid medium. For the preparation of 3 L medium , 6.6 g of MS (2.2 g/L), 1.5 g MES (0.5 g/L), 30 g of sucrose (10 g/L) and 3 L of sterile water were added to a 5 L plastic container. Then, the pH was adjusted to 5.7 using KOH. 0.6 L of the liquid was poured into each of five glass
12
bottles and 4.8 g agar (0.8%) was added to each bottle. The bottles were then autoclaved, and before the medium solidified, it was transferred to ten sterile plastic jars in a sterile hood. The sterilized seeds were distributed on the media in sterile conditions, under a hood, and were left to germinate and grow for seven days. During this time the jars were kept in long day conditions, (16 hours of light at 22 ºC, and a dark period at 18ºC).
2.1.4. Selection and treatment
In trial 1 and trial 2, a selection of seedlings was performed. Seven days old seedlings, seedlings that were either fragile or laying on the media were manually removed with tweezers from the jars. Approximately 25 individuals were left in each jar after selection. In trial 1, the selection was performed 4 hours before applying a 2 µl drop of certain compound (factor) to one of each seedling’s cotyledons. In trial 1, due to contamination of plates, only six factors were investigated. In trial 2, the seedlings were left to rest for 24 hours after the selection, followed by application of drops. In trial 3, no selection was performed, except on the selected unwounded factor, and this trialed had approximately 50 seedlings per factor. After the application of the different compounds the seedlings were left for 24 hours until the GUS staining reaction was performed. The wounding of the seedlings was performed two hours before the GUS staining, using a sharp needle to puncture one of each plant’s cotyledon.
2.1.5. GUS staining and activity
The plants were incubated for 20 minutes in a 6-well plate containing 90 % ice cold acetone. The acetone was removed, and the plants were washed with 50 mM sodium phosphate buffer pH 7 for 5-10 minutes. Then the buffer was replaced with GUS staining mix, consisting of 50 mM sodium phosphate buffer with a pH of 7, 0.1% Triton X-100, 0.75 mM K4Fe(CN)6, 0.75
mM K3Fe(CN)6 and 0.5 mg/ml X-Gluc. The plants were vacuum infiltrated for 15 minutes
and then they were incubated in darkness at 37ºC for 2 h. The reaction was stopped by replacing the staining solution with 70% ethanol. The 70 % ethanol was exchanged several times and then left overnight at 4°C to remove the remaining chlorophyll.
Before taking pictures in the microscope, the plants were rehydrated in decreasing
concentration of ethanol, first 50% and then 30%, 5-10 minutes in each step. Finally, the 30% ethanol was replaced with 50 mM sodium phosphate buffer (pH 7), which was the solution for final storage. When mounting the plants on the microscopy slides, a mixture of sodium phosphate buffer and glycerol (9:2 v/v) was used. For trial 1 and 2, there were a total number of 25 individuals per factor, and ten of the 25 plants were randomly sampled and
photographed to be included in the data. In trial 3, there were approximately 50 plants of each factor and among them ten of them were randomly sampled and photographed, while all the 50 plants were included for the blind test.
13
2.1.6. Creation of staining scale
The pictures from the microscope were sorted into scale 1-4, based on intensity and area of staining, indicating the stress level. One being the least stained and four being the most stained.
14
2.2 Statistical analysis
The Pearson correlation test measures linear correlation between two variables, indicating the potential correlation with a value between -1 and 1. A value of -1 indicates perfect negative correlation, whilst 1 indicates a positive correlation. A value of 0 indicates no correlation. The effects of the tested factors were compared by comparing the histograms of the
distributions of the staining intensity between score 1 and 4 for these factors. The identical distributions would lead to perfect correlation. This way the different factors can be analyzed to see if they induce similar response or not (Yeager, 2018). Here, the distributions of the result-histograms for each factor are compared pair-wisely.
Analysis of variance (ANOVA) was used to test if treatments induced any effects on staining, or if eventual differences were caused by chance. It was followed by the Duncan test to compare differences among the treatment means. The Duncan’s multiple range test (DMRT) compares multiple sets of means, by comparing the sample means with a calculated least significant range. Two means are considered significantly different if the difference between them are equal or greater than the least significant range (Salkind, 2010). DMRT measures specific differences between pairs of means and indicates which of the means are
significantly different at chosen significance level (P ≤ 0.05) (Kao & Green, 2008; Salkind, 2010).
15
3. RESULTS
3.1 Results from staining
The results from the untouched and wounded plants (negative and positive controls, respectively) were clear and can be seen visually (figure 1 and 3).
Figure 2. Untouched plants. No GUS staining was observed in cotyledons from untouched plants.
Figure 3. Wounded plants. Strong GUS staining was evident in wounded plants.
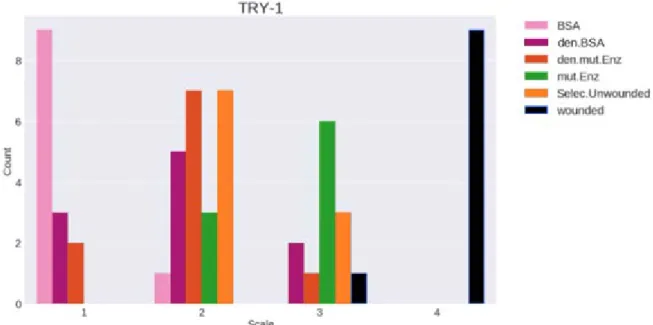
In trial one (figure 4) ten of 25 plants were randomly sampled. In the results the negative control, selected unwounded, are seen to induce stress response. The other enzymes and denatured BSA also induce stress response, however, BSA did not. The plants treated with either the denatured mutated enzyme or mutated enzyme showed induced stress response, but not as strong as the wounded plants.
16
Figure 4. Results from trial 1 for samples of 10 plants per factor presented as histograms of distributions
according to staining intensity scale (1-4). Pink = bovine serum albumin (BSA), purple = denatured BSA, red = denatured mutated enzyme, green = mutated enzyme, orange = selected plants.
In trial two (figure 5) ten of 25 plants were randomly sampled. In the results, it can be seen that the number of selected unwounded plants with induced stress response were small and that the added control, untouched, did not induce any stress response. Both, BSA and denatured BSA induced no significant stress response, where only one of ten plant showed induced stress response. All ten plants of the untouched had no stress response. All the enzymes indicate a stress response, but not as clearly as the wounded plants.
Figure 5. . Results from trial 2, of samples 10 plants per factor, presented as histograms of distributions
according to staining intensity scale (1-4). Pink = bovine serum albumin (BSA), purple = denatured BSA, red = denatured mutated enzyme, green = mutated enzyme, yellow = denatured active enzyme, grey = active enzyme, light blue = buffer, orange = selected plants, dark blue = untouched plants and black = wounded plants.
17
In trial 3 (figure 6) ten of 50 plants were randomly sampled. The negative controls (buffer, selected unwounded, untouched) and the BSA indicate no stress response. The denatured BSA and mutated denatured enzyme also did not induce any significant stress response. In contrast the active enzyme, denatured active enzyme and mutated enzyme seem to induce stress response, but not as strong as the wounded plants.
Figure 6. Results from trial 3 for samples of 10 plants per factor presented as histograms of distributions
according to staining intensity scale (1-4). Pink = bovine serum albumin (BSA), purple = denatured BSA, red = denatured mutated enzyme, green = mutated enzyme, yellow = denatured active enzyme, grey = active enzyme, light blue = buffer, orange = selected plants, dark blue = untouched plants and black = wounded plants.
After having performed the three trials and analyzed the data from the photographs, it was realized that no clear conclusion could be drawn. The results from trial 1 was unreliable since the negative control had induced stress response, and trial 2 and 3 indicated different results, because of that a blind scoring test was performed with larger samples. Trial 3 was selected as it had the most individuals per factor (50), and all individuals were photographed. This was done blindly, as the factors were coded with letters, and the photographs were sorted according to the stress scale. Because of this the statistical analyzes were performed only based on the blind test data.
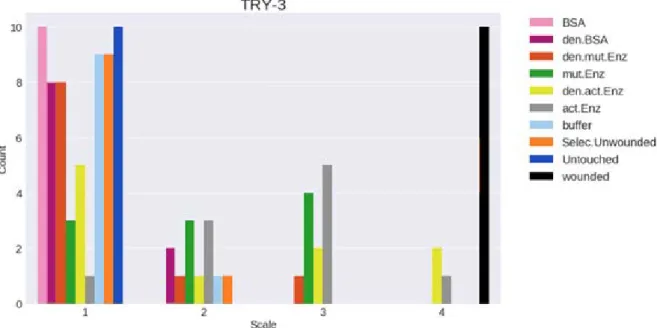
In the blind test (figure 7) all of the 50 plants from trial 3 were sampled and the result
differed some from the results in trial 3. All the enzymes indicated to induce stress response, but not as strong as the wounded plants. The negative controls are mostly found in scale 1, however, the buffer is strangely found in all of the scales, thus indicating induced stress response. The BSA and denatured BSA reacted similarly as the unwounded plants. The wounded plants had induced stress response.
18
Figure 7. Results from trial 3 for all treated plants (50 plants/factor) presented as histograms of distributions
according to staining intensity scale (1-4). Pink = BSA (bovine serum albumin), purple = denatured BSA, red = denatured mutated enzyme, green = mutated enzyme, yellow = denatured active enzyme, grey = active enzyme, light blue = buffer, orange = selected plants, dark blue = untouched plants and black = wounded plants.
3.2. Result from Pearson correlation test
There was no significant difference between several of the factors tested (table 1). The wounded plants gave significantly higher staining than the other treatments. The staining of untouched (E), BSA (I) and denatured BSA (J) correlated perfectly with each other, reaching the value of coefficient of correlation 1.0. While the staining of these plants correlated negatively with the wounded plants (G), reaching the value of coefficient of correlation between -0,62 and -0,63. Selected unwounded (F) and buffer (H) correlates perfectly with each other; they also highly correlate to untouched, BSA and Denatured BSA with coefficient of correlation values between 0.97 and 0.99.
The mutated enzyme- (B), denatured active enzyme- (D) and active enzyme- (C) treated plants indicated correlation among each other, and less with the other factors. The denatured mutated enzyme treated plants correlated most with that of the buffer treated plants. They both correlated negatively with the wounded, having coefficients of correlation of 0.77 and -0.69, respectively.
19
Table 1: Correlation between the different factors from the blind test. The letter coded factors are: A =
Denatured mutated enzyme, B = Mutated enzyme, C = Active enzyme, D = Denatured active enzyme, E = Untouched, F = Selected unwounded, G = Wounded, H = Buffer, I = BSA (bovine serum albumin), J = Denatured BSA.
3.3. Result from ANOVA and the Duncan test
Prior to conducting the Duncan test, an analysis of variance was performed (Table 2). The p- value indicates that the null-hypothesis, that the mean values of the factors investigated is equal, can be rejected, and the differences observed in the data are not due to chance.
Table 2: Results from ANOVA, indicating that differences between treatments were not due to chance.
The results from the Duncan test (Figure 8) indicated that the mean staining of wounded plants was different from all the other means (higher), as indicated by the dot on the range-line of the factor. The Y-axis showing the scale, 1-4, and the x-axis the factors, A- J. The staining of mutated enzyme- (B), active enzyme- (D) and denatured enzyme- (C) treated plants was not distinct from each other, while it was distinctly higher than the staining of the plants treated with the denatured mutated enzyme (A) or the buffer (H). Plants treated with denatured BSA (J), BSA (I) and untouched (E) plants had the lowest staining of all other
20
groups and were also not significantly different from each other. Selected unwounded (F) on the other hand is not significantly different from either group of A and H or J, I and E while being significantly lower than means for B, D and C. This indicated by the letters a, b, c, and d, above each column. These four letters are significantly different from each other, while cd overlaps with both group c and d.
Figure 8. Results Duncan test. The Y-axis shows the staining scale, and the X-axis shows the different factors:
G = wounded, B = mutated enzyme, D = active enzyme, C = denatured active enzyme, H = buffer, A = denatured mutated enzyme, F = selected unwounded, J - denatured BSA, I = BSA (bovine serum albumin), E = untouched. The letters above each column a, b, c, and d, are significantly different from each other. While cd is not significantly different from either c or d. The columns shows the range of each factor and the dot shows the mean value of each factor.
21
4. DISCUSSION
When repeating this experiment all individuals should be added to the data and not a small sample. As seen when comparing the results from the blind test and trial 3 (figure 7 and 6) the results can be different due to chance, when using a small sample. If a fraction of total samples is used, the samples should be bigger than ten plants. The results could become more reliable if the GUS staining was quantified by 4-Methylumbelliferyl glucuronide (MUG) assay (C. Côté and R. G. Rutledge 2013). Also, because selection of the plants can induce stress response (figure 4), it is of interest to keep testing how long the plants should rest to perfectly correlate with the untouched plants. However, in this study it was discovered that the plants needs at least 24 hours rest after selection to avoid significant stress response (figure 5). Otherwise, the experiment can be conducted without selection.
Application of mutated, denatured mutated, active and denatured active enzyme on the cotyledon of seven days old Arabidopsis plants was found to trigger jasmonate signaling (figure 7 and 8), but to a lesser degree than physical wounding. The proteins BSA and denatured BSA did not trigger signaling, thus indicating that the plant recognize GE as pathogenic. However, this study cannot reject the hypothesis that the activity of GE contributes to the stress response. This also means that the cause of the stress symptoms observed when introducing the GE coding gene is not yet understood, since there were no clear differences between the active and inactive enzymes.
Another unclarity is the fact that the buffer induced stress (figure 7 and 8), which could be a reaction to having a drop applied. That on the other hand is dismissed by the fact that neither BSA and denatured BSA indicated stress. It should also be noted that the enzymes and proteins were suspended in the buffer and therefore contains some buffer and consequently the proteins should have had similar or higher levels of induced stress. Contamination of the buffer might be a reason for the unexpected results, since for trial 3 a new stock of phosphate buffer was prepared.
In conclusion it can be said that our results supports hypothesis (i), that a certain peptide motif of GE recognized as pathogenic by the plant. However, we cannot reject hypothesis (ii) that the activity contributes to the stress response. It was also discovered in this study that selection can induce stress response and for this reason it is important for the plants to rest at least 24 hours after the selection process. There has been no other studies on this particular question and therefore this can serve as a pilot study.
22
5. REFERENCES
Acosta, I. F., Gasperini, D., Chételat, A., Stolz, S., Santuari, L. and Farmer E. E. “Role of NINJA in Root Jasmonate Signaling.” Proceedings of the National Academy of Sciences of
the United States of America 110.38 (2013): 15473–8. Web.
Balakshin, M., Capanema, E., Gracz, H., Chang, H. & Jameel, H. (2011). Quantification of lignin–carbohydrate linkages with high-resolution NMR spectroscopy. Planta. [Online] 233 (6), 1097–1110.
Biely, P. (2017). Microbial Glucuronoyl Esterases: 10 Years after Discovery. Applied and
environmental microbiology. [Online] 82 (24), 7014–7018.
Bååth, A. J., Giummarella, N., Klaubauf, S., Lawoko, M., Olsson, L. (2016). A glucuronoyl esterase from Acremonium alcalophilum cleaves native lignin-carbohydrate ester bonds.
FEBS Letters. [Online] 590 (16), 2611–2618.
Chen, F. & Dixon, R.A. (2007). Lignin modification improves fermentable sugar yields for biofuel production. Nature Biotechnology. [Online] 25 (7), 759–761.
Chini, A., Fonseca, S., Fernández, G., Adie, B., Chico, J. M., Lorenzo, O., García-Casado, G., López-Vidriero, I., Lozano, F. M., Ponce, M. R., Micol, J. L. & Solano R. (2007). The JAZ family of repressors is the missing link in jasmonate signalling. Nature. [Online] 448 (7154), 666–671.
Côté, C. & Rutledge, R. G. (2003). An improved MUG fluorescent assay for the
determination of GUS activity within transgenic tissue of woody plants. Plant Cell Reports. [Online] 21 (6), 619–624.
Craig, S. (1992). 8 The GUS Reporter Gene—Application to Light and Transmission Electron Microscopy. I: Gallagher, S. R. (red), GUS Protocols: Using the GUS Gene as a
Reporter of Gene Expression. San Diego: Academic. pp. 115–124.
Creelman, R. A. & Mullet, J. E., (1997). Biosynthesis and action of jasmonates in plants. Annual Review of Plant Biology. [Online] 48 (1), 355–381.
DeSanti, C., Willassen, N. P. & Williamson, A. (2016). Biochemical Characterization of a Family 15 Carbohydrate Esterase from a Bacterial Marine Arctic Metagenome. PLOS ONE. [Online] 11 (7), .
DeCoste, J. D. (2015). chemical principles. 8 ed. Boston: CENGAGE Learning Custom Publishing
23
Evert, F. R. & Eichhorn E. S. (2013). Raven biology of plants. 8 ed. New York: W.H. Freeman and Company Publishers.
Fan, M., & Fu, F., (2017). Advanced high strength natural fibre composites in construction . Amsterdam, Netherlands: Woodhead Publishing.
Farmer, E.E. & Ryan, C.A. (1990). Interplant communication: airborne methyl jasmonate induces synthesis of proteinase inhibitors in plant leaves, Proceedings of the National
Academy of Sciences of the United States of America. October 1990 pp. 7713–7716.
Gandla, L. M., Derba-Maceluch, M., Liu, X., Gerber, L., Master, R. E., Mellerowicz, J. E. & Jönsson, J. L. (2015). Expression of a fungal glucuronoyl esterase in Populus: Effects on wood properties and saccharification efficiency. Phytochemistry. [Online] 112 (1), 210–220. Jefferson, R. A. (1989). The GUS reporter gene system. Nature. [Online] 342 (6251), 837– 839
Jones, J.D.G. & Dangl, J.L. (2006). The plant immune system. Nature [Online] 444 (7117), 323–329.
Kao, L. S. & Green, C. E. (2008). Analysis of variance: is there a difference in means and what does it mean? The Journal of surgical research. 144 (1), 158–170.
Kessler, A., Halitschke, R., Diezel, C., Baldwin, I. T. (2006). Priming of plant defense responses in nature by airborne signaling between Artemisia tridentata and Nicotiana attenuata. Oecologia [Online] 148 (2), 280–292.
Khatib, J. M. (2009). Sustainability of construction materials . Cambridge, England: Woodhead Publishing Limited.
Mahon, E. L. & Mansfield, S. D. (2019). Tailor-made trees: engineering lignin for ease of processing and tomorrow’s bioeconomy. Current Opinion in Biotechnology, 56, pp 147–155 Naraian, R. & Gautam, R. L. (2018). ‘Chapter 6 - Penicillium Enzymes for the
Saccharification of Lignocellulosic Feedstocks, New and Future Developments in Microbial
Biotechnology and Bioengineering. [Online]. pp. 121–136.
N. R. C. (US) Board on Agriculture, (1984). Crop Improvement. National Academies Press
(US). Available from: https://www.ncbi.nlm.nih.gov/books/NBK216396/. [Accessed
2019-04-02].
Pieterse C.M.J., Van der Does D., Zamioudis C., Leon-Reyes A. & Van Wees S.C.M. (2012). Hormonal modulation of plant immunity. Annual Review of Cell and Developmental Biology
24
Pesquet, E., Zhang, B., Gorzsás, A., Puhakainen, T., Serk, H., Escamez, S., Barbier, O., Gerber, L., Courtois-Moreau, C., Alatalo, E., Paulin, L., Kangasjärvi, J., Sundberg, B., Goffner, D. and Tuominen, H. (2013). “Non-Cell-Autonomous Postmortem Lignification of Tracheary Elements in Zinnia Elegans.” The Plant cell. [Online] 25 (4), 1314–1328.
Salkind, J. N. (2010). Encyclopedia of Research Design. [Online]. Thousand Oaks: SAGE Publications, Inc.
Tarasov, D., Leitch, M. & Fatehi, P. (2018). Lignin–carbohydrate complexes: properties, applications, analyses, and methods of extraction: a review. Biotechnology for Biofuels [online], 11. Available from: https://www.ncbi.nlm.nih.gov/pmc/articles/PMC6162904/. [Accessed 2019-03-13].
Tsai, A. Y. -L., Canam, T., Gorzsás, A., Mellerowicz, J. E., Campbell, M. M. & Master, R. E. (2012). Constitutive expression of a fungal glucuronoyl esterase in Arabidopsis reveals altered cell wall composition and structure. Plant Biotechnology Journal. [Online] 10 (9), 1077–1087.
Turner, G. J., Ellis, C. & Devoto, A. (2002). The jasmonate signal pathway. The Plant cell. 14 S. 153–164.
Van Acker, R. et al. (2013). Lignin biosynthesis perturbations affect secondary cell wall composition and saccharification yield in Arabidopsis thaliana. BIOTECHNOLOGY FOR
BIOFUELS. [Online] 6 (1), 46. [online]. Available from:
https://biblio.ugent.be/publication/4098823.
Vanholme, B., Desmet, T., Ronsse, F., Rabaey, K., Breusegem, V. F., Mey, D. M., Soetaert, W. & Boerjan, W. (2013). Towards a carbon-negative sustainable bio-based economy.
FRONTIERS IN PLANT SCIENCE. [Online] 4174. [online]. Available from:
https://biblio.ugent.be/publication/4098843.
Vega-Sánchez, Miguel E. & Ronald, P. C. (2010). Genetic and biotechnological approaches for biofuel crop improvement. Current Opinion in Biotechnology. [Online] 21 (2), 218–224. Vigani, M., Raimondi, V. & Olper, A. (2012). International trade and endogenous standards: the case of GMO regulations. World Trade Review. [Online] 11 (3), 415–437.
Yeager, K. (2018). LibGuides: SPSS Tutorials: Pearson Correlation. Available from: https://libguides.library.kent.edu/SPSS/PearsonCorr. [Accessed 2019-04-16].
Zeng, Y., Zhao, S., Yang, S. & Ding, S.-Y. (2014). Lignin plays a negative role in the biochemical process for producing lignocellulosic biofuels. Current opinion in