Author:
Caesar Alhawi, Ahmad
Abdilrahim
Supervisor:
Francis Palma
Semester:
VT 2020
Subject:
Computer Science
Bachelor Degree Project
Studying the Relation Between
Change- and Fault-proneness
-Are Change-prone Classes More
Fault-prone, and Vice-versa?
Abstract
Software is the heartbeat of modern technology. To keep up with the new demands and expansion of requirements, changes are constantly introduced to the software, i.e., changes can also be made to fix an existing fault/defect. However, these changes might also cause further faults/defects in the software. This study aims to investigate the possible correlation between change-proneness and fault-proneness in object-oriented systems. Forty releases of five different open-source systems are analysed to quantify change- and fault-proneness; Beam, Camel, Ignite, Jenkins, and JMe-ter, then statistic evidence is presented as to answer the following: (1) Is there is a relationship between change-proneness and fault-proneness for classes in object-oriented systems? (2) Is there a relationship between size and fault-proneness for classes in object-oriented systems? and (3) Is there a relationship between size and change-proneness for classes in object-oriented systems? Using the Wilcoxon rank-sum test, the results show that: (1) there is a correlation between change- and fault-proneness at a statistically significant level and (2) a correlation also exists between class size and its change- and fault-proneness at a statistically significant level. Keywords: Empirical software engineering, Change-proneness, Fault-proneness, Object-oriented, Metrics.
Preface
We would like to thank our supervisor, Dr. Francis Palma, for guiding us through this study. We would not be able to complete this thesis without his continuous support.
Contents
1 Introduction 1
1.1 Background . . . 1
1.2 Related Work . . . 1
1.2.1 Change- and Fault-proneness and Design Practices . . . 1
1.2.2 Change- and Fault-proneness and Object-oriented Metrics . . . . 2
1.3 Problem Formulation . . . 2 1.4 Motivation . . . 3 1.5 Research Questions . . . 3 1.6 Scope/Limitation . . . 4 1.7 Target Group . . . 4 1.8 Outline . . . 4 2 Method 5 2.1 Data Collection and Processing . . . 5
2.2 Variable Selection . . . 12
2.3 Reliability and Validity . . . 13
2.4 Ethical Consideration . . . 13
3 Results and Analysis 14 3.1 RQ1: Is there a relationship between change-proneness and fault-proneness for classes in object-oriented systems? . . . 14
3.2 RQ2: Is there a relationship between size and fault-proneness for classes in object-oriented systems? . . . 16
3.3 RQ3: Is there a relationship between size and change-proneness for classes in object-oriented systems? . . . 18
4 Discussion 21 4.1 Correlation Between Change- and Fault-proneness . . . 21
4.2 Correlation Between Class Size and Change-proneness . . . 21
4.3 Correlation Between Class Size and Fault-proneness . . . 21
5 Conclusion 22 5.1 Future Work . . . 22
1
Introduction
Software systems evolve and change continuously over time. These changes could be to improve functionality, fix bugs, or add new features. Users’ requirements may change as well, causing further changes in the software artifacts and resulting in newer releases of the software [1]. At the same time, when users report a bug, a quick fix is essential, which also causes the software artifacts to change and evolve. Subsequently, frequent changes could introduce potential bugs, fixing of which causes more changes in the source artifacts. The software typically consists of a large number of classes, and a single change in a class might propagate to a significant percentage of other classes followed by an increase in faults/defects [2]. However, there is little or no evidence in practice that shows change-prone software modules or classes to be more fault-prone or vice versa.
In this paper, we perform an empirical study that uses data collected from develop-ment history repositories and combined with data from issue-tracking systems of five different open-source software products. The goal is to assess whether classes that have an increased likelihood to change between any two given releases also have a higher like-lihood to be involved in faults/defects and vice versa. We also investigate the possible effect of class size on its change- and fault-proneness. The study relies on widely used software metrics, such as the number of changes, code churn, LOC, the number of bugs, and the defect density. Statistical evidence is presented to support the results and findings of this study.
1.1 Background
Change-proneness: In object-oriented systems, change-proneness is considered to be an essential external quality attribute because it signifies to what extent a class changes across the different versions of a system [1][2]. In this study, we used the following two metrics, to measure change-proneness:
• Number of changes: the total number of times a class changed within a release. • Code churn: the total number of churns (lines added, deleted, and modified) that a
class underwent within a release [3].
Fault-proneness: Another important external quality attribute in object-oriented systems. It can be defined as the possibility that a software artifact contains a fault/defect [3][4]. In this study, we used the following two metrics, to measure fault-proneness:
• Number of bugs: the total number of faults/defects a class has within a release. • Defect Density: fault content per lines of code [5].
1.2 Related Work
In this section, we discuss the relevant literature on investigating change-proneness, and fault-proneness in relation to software design practices and object-oriented software met-rics.
1.2.1 Change- and Fault-proneness and Design Practices
There is a myriad of previous research studying the impact of good and bad design prac-tices on change- and fault-proneness. The study by Palma et al. [3] investigated the
relationship between change-proneness and service patterns/anti-patterns. Our methodol-ogy was inspired by this study as we followed the same metrics extraction process, data mapping, and statistical analysis approach. The study found, among other results, that services involved in anti-patterns are more change-prone than others.
The study by Jaafar et al. [6] evaluated the impact of design-pattern and anti-pattern dependencies on changes and faults, and one of its findings was that classes possessing dependencies with anti-patterns are more fault-prone.
Khomh et al. [7] also investigated the impact of anti-patterns on the change- and fault-proneness of a class; the study found that classes involved in anti-patterns are more change- and fault-prone than others. The study also concludes that class size cannot explain the change-proneness of classes with anti-patterns.
Finally, an empirical study by Guerrouj et al. [8] investigated the relationship between poor design practices (lexical smells) and change- and fault-proneness. It found that lexi-cal smells can make classes, involved in design smells, more fault-prone. This study also demonstrated that classes with design-smells only are more change- and fault-prone than those with lexical smells only.
1.2.2 Change- and Fault-proneness and Object-oriented Metrics
Studies by Lu et al. [1] investigated the relationship between object-oriented metrics and change-proneness. Lu’s paper employed statistical techniques to examine the ability of 62 different OO metrics to predict change-proneness. The study revealed that size metrics exhibited moderate/almost moderate ability in differentiating change-prone classes from non-change prone ones; it also found that cohesion and coupling metrics are less able to predict change-proneness with inheritance metric being the poorest to predict it.
Malhotra et al. [9] used software metrics to show that machine learning methods are comparable to the previously used logistics regression methods when it comes to predict-ing change-proneness; it also showed that testpredict-ing based on change-proneness prediction leads to better quality as it allows developers to target the most change-prone classes.
A paper by Singh et al. [10] also examined the ability of OO metrics to predict dif-ferent levels of fault severity. The study showed that using machine learning methods to target classes with different severity levels of faults might help developers to better plan and test the fault-prone parts.
Pai et al. [5] use Bayesian methods to analyse the fault -content and -proneness by relating the internal OO metrics of software to external quality metrics.
Another research by Malhotra et al. [2] investigates the relationship between OO metrics and change-proneness using machine learning and statistical techniques. It also concludes that using these techniques to predict the change-proneness of classes in object-oriented systems is a better approach than regression techniques.
Finally, the ability of complexity metrics to predict fault-prone classes in object-oriented systems was investigated by Zhou et al. [11]; it found that many metrics such as LOC, WMC, and AMC showed a moderate or almost moderate ability to predict fault-proneness. The study also concluded that LOC and WMC (weighted method McCabe complexity) are better indicators of fault-proneness.
1.3 Problem Formulation
Software systems keep changing either to meet new needs and requirements or to fix existing defects. As these systems evolve from one release to another, they become larger and more complex; changing one class might propagate further changes and result in
even more faults. As a result, maintenance becomes an arduous and expensive task [12]. Thus, predicting which classes are more prone to changes or involvement in faults can help reduce maintenance costs and improve the software quality [2]. Hence, we aim to investigate the relation between change-proneness and fault-proneness in object-oriented systems and examine the impact of class size on both of these attributes.
1.4 Motivation
Studies state that the most significant percentage of software development effort (i.e., up to 80%) goes to maintenance and evolution [2]. Investigating the relation between two essential quality attributes, such as fault- and change-proneness, can increase the possibility of predicting which classes are more likely to contain faults/defects and which classes are more likely to change in the software development process. The prediction benefits developers as they can focus their resources and efforts on modifying such classes for better quality and reduced long-term maintenance costs. We also examine the impact of class size on its change- and fault-proneness; this provides an easily accessible metric that can be used to categorize a specific class as change-prone, fault-prone, or neither of both.
1.5 Research Questions
Our study aims at investigating whether change-prone classes are related to fault-proneness and vice versa. Also, we examine the impact of class size on change- and fault-proneness. Consequently, we formulate the following research questions:
• RQ1: Is there a relationship between change-proneness and fault-proneness for
classes in object-oriented systems?
– RQ1.1: Are highly change-prone classes also more fault-prone?
– RQ1.2: Are highly fault-prone classes also more change-prone?
• RQ2: Is there a relationship between size and fault-proneness for classes in
object-oriented systems?
– RQ2.1: Are larger classes also more fault-prone?
– RQ2.2: Are highly fault-prone classes are usually the larger classes?
• RQ3: Is there a relationship between size and change-proneness for classes in
object-oriented systems?
– RQ3.1: Are larger classes also more change-prone?
– RQ3.2: Are highly change-prone classes are usually the larger classes?
We expect that the results will yield statistical evidence of a relationship between change-and fault-proneness, where highly change-prone classes are also highly fault-prone change-and vice versa. We also expect the results to present statistical evidence that shows a relation between class size and its fault- and change-proneness.
1.6 Scope/Limitation
– The study is performed on five systems. See Table 2.1. – The study is limited to open source systems.
– All the systems involved in the study are written in Java.
– Due to the limited number of requests allowed by GitHub API v31and the request rate limiter set by Jira2and Bugzilla3, our study was limited to a combination of 40
releases. See Table 2.1.
– Our study is limited to investigating two quality attributes: change- and fault-proneness.
– From many object-oriented metrics, we only investigate the class size metric in relation to change- and fault-proneness.
1.7 Target Group
We aim to target both academic researchers and practitioners within the industry. Our findings might be of interest to academics who want to study further the relation between change- and fault-proneness and document how software behaves as it evolves. We also think that practitioners and team leaders looking for means to improve their team’s out-come in terms of time, money, and quality might be interested in our findings.
1.8 Outline
The remainder of the paper is organized as follows: Section 2 explains the methodology followed in the study as well as the independent and dependent variables used. Section 3 reports the results and findings while Section 4 summarizes and discusses the results. Finally, the study concludes and outlines directions for future work in Section 5.
1https://developer.github.com/v3/ 2https://www.atlassian.com/software/jira 3https://www.bugzilla.org/
2
Method
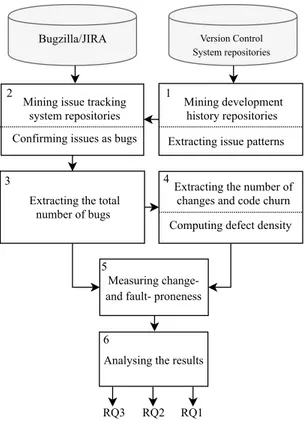
In this section, we present the methodology used to perform our study. The study was done at the release level. We aim to answer the research questions stated in Section 1.5. In order to answer those questions, quantitative data from different systems were collected and analysed statistically. Figure 2.1 exhibits an overview of our approach to the study. All the raw data collected and used can be obtained here4.
Measuring change-and fault- proneness
1
Extracting issue patterns Mining development history repositories 2 3 5 4
Extracting the number of changes and code churn Computing defect density Mining issue tracking
system repositories Confirming issues as bugs
Extracting the total number of bugs
Bugzilla/JIRA Version Control System repositories
Analysing the results 6
RQ1 RQ2 RQ3
Figure 2.1: An overview of our approach to the study.
2.1 Data Collection and Processing
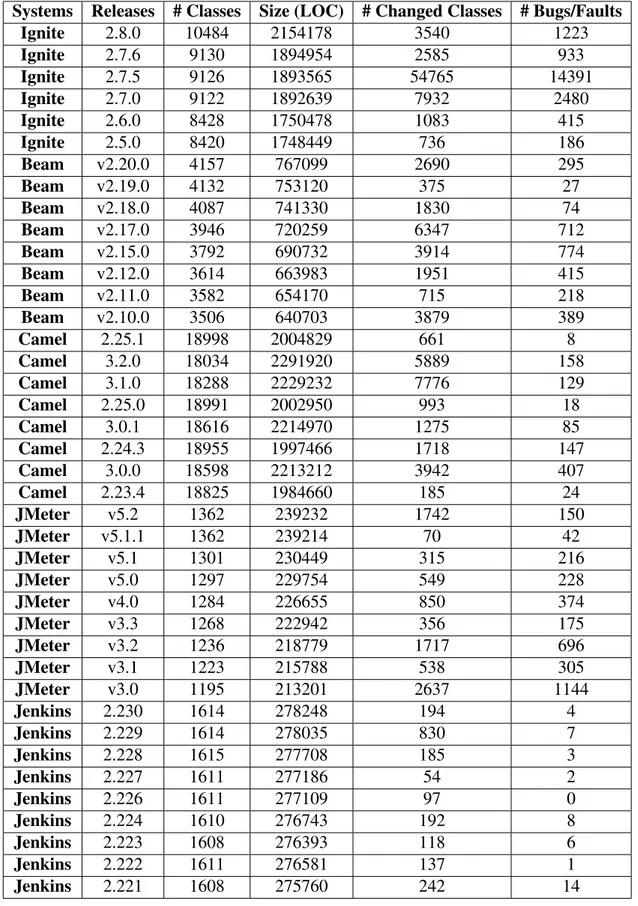
We analysed a total of 40 releases of five different open-source systems; eight releases of Apache Beam5, eight releases of Apache Camel6, six releases of Apache Ignite7, nine releases of Jenkins8, and nine releases of Apache JMeter9. Releases that had less than 50
changed classes were ignored. These systems were mainly chosen for their public avail-ability, a considerable number of releases and committers, as well as a well-documented development history. Also, they belong to different domains and have different sizes, see Table 2.1. Apache Beam is an advanced unified programming model; Camel is an inte-gration framework, Ignite is an in-memory computing platform, Jenkins is an automation server, while JMeter is a tool to load test functional behavior and measure performance. Four of the five systems analysed are developed by The Apache Software Foundation,
4https://github.com/Ahmadar91/Thesis 5https://beam.apache.org/ 6https://camel.apache.org/ 7https://ignite.apache.org/ 8https://www.jenkins.io/ 9https://jmeter.apache.org/
making them stand at an industrial level. By the time this study was performed, the fifth system (Jenkins) had 727 releases, 626 contributors, and over 1600 plugins and qualified as an industrial project commonly used by developers. Table 2.1 describes further details of the systems releases included in our study. The remainder of this section elaborates on each of the methodology steps taken.
Step 1: Mining Development History Repositories and Extracting Issue Patterns: We started the data collection by mining the development history repositories from the version control systems of all systems included in this study. In our case, all the systems used Git10 as their version control system. The mining was done to identify changes and fault fixes that occurred within the specified releases of each system. The Git repositories of the systems were downloaded using a script written with JavaScript and then stored into a MySQL11database. SQL queries were then used to acquire the source code change history of all systems. We extracted the following information for each commit:
• Commit message. • The list of changed files. • Commit date.
• Code churn: the number of code lines that were added or removed from a class within a release.
• A list of paths of all changed files.
• The class size (LOC) for each class instance in a release.
• Details, such as the SHA value and commit URLs were also retrieved, but those were not directly used in the study and were left for possible future use.
To prepare for our next step, we saved all the data retrieved on Excel sheets and extracted the patterns used by each system to report issues. We used regular expression (regex) patterns on the commit messages to identify bug fixing commits. Each system has its pattern to refer to bug reports; for example, Jenkins uses JENKINS-XXX and HUDSON-XXX formats, where HUDSON-XXX is the bug report ID. Our script ran the specified regex pattern, and for every time it found a match in the commit messages, it extracted the issue ID. Then it generated a link for that issue following JIRA or Bugzilla’s pattern standards. For example, https://issues.jenkins-ci.org/browse/JENKINS-xxx is an issue link for issue number XXX. Table 2.2 shows the regex pattern used for each of the systems under study. The idea of using unique bug report IDs to identify bug containing commits was based on this previous study [13].
Step 2: Mining Issue Tracking System Repositories and Confirming Issues as Bugs: In this step, we mined the bug repositories of the corresponding bug tracking systems to identify bugs (faults) linked to changed classes. All of the systems we analysed, except JMeter, use JIRA12 as their issue tracking system; JMeter uses Bugzilla13. We added a web scraping command to our script that ran the extracted issue links from the previous step. If the link (URL) exists in the issue tracking system, the script then retrieved and verified whether the corresponding issue is an improvement request, a new feature request, or a bug. The data retrieved included:
• Issue type, such as improvement, feature request, or bug. • Bug status, such as resolved, opened, closed, or verified.
10https://git-scm.com/ 11https://www.mysql.com/
12https://www.atlassian.com/software/jira 13https://www.bugzilla.org/
• A bug resolution such as fixed, rejected, invalid, or duplicate.
Systems Releases # Classes Size (LOC) # Changed Classes # Bugs/Faults
Ignite 2.8.0 10484 2154178 3540 1223 Ignite 2.7.6 9130 1894954 2585 933 Ignite 2.7.5 9126 1893565 54765 14391 Ignite 2.7.0 9122 1892639 7932 2480 Ignite 2.6.0 8428 1750478 1083 415 Ignite 2.5.0 8420 1748449 736 186 Beam v2.20.0 4157 767099 2690 295 Beam v2.19.0 4132 753120 375 27 Beam v2.18.0 4087 741330 1830 74 Beam v2.17.0 3946 720259 6347 712 Beam v2.15.0 3792 690732 3914 774 Beam v2.12.0 3614 663983 1951 415 Beam v2.11.0 3582 654170 715 218 Beam v2.10.0 3506 640703 3879 389 Camel 2.25.1 18998 2004829 661 8 Camel 3.2.0 18034 2291920 5889 158 Camel 3.1.0 18288 2229232 7776 129 Camel 2.25.0 18991 2002950 993 18 Camel 3.0.1 18616 2214970 1275 85 Camel 2.24.3 18955 1997466 1718 147 Camel 3.0.0 18598 2213212 3942 407 Camel 2.23.4 18825 1984660 185 24 JMeter v5.2 1362 239232 1742 150 JMeter v5.1.1 1362 239214 70 42 JMeter v5.1 1301 230449 315 216 JMeter v5.0 1297 229754 549 228 JMeter v4.0 1284 226655 850 374 JMeter v3.3 1268 222942 356 175 JMeter v3.2 1236 218779 1717 696 JMeter v3.1 1223 215788 538 305 JMeter v3.0 1195 213201 2637 1144 Jenkins 2.230 1614 278248 194 4 Jenkins 2.229 1614 278035 830 7 Jenkins 2.228 1615 277708 185 3 Jenkins 2.227 1611 277186 54 2 Jenkins 2.226 1611 277109 97 0 Jenkins 2.224 1610 276743 192 8 Jenkins 2.223 1608 276393 118 6 Jenkins 2.222 1611 276581 137 1 Jenkins 2.221 1608 275760 242 14
Table 2.1: An overview of the systems releases analysed in this study.
Only bugs characterized as “Resolved/Closed,” “Resolved/Fixed,” or “Unresolved/Open” were considered for the final data. “Duplicate” and “Invalid/Rejected” bugs were ignored.
System Regex Pattern JMeter /\bbz [0-9]{1,6}\b|#[0-9]{1,6}|bug[0-9]{1,6}|id: [0-9]{1,6} |pr[0-9]{1,6}|id=[0-9]{1,6}|bugzilla[0-9]{1,6}|Enhancement [0-9] {1,6}|bz-[0-9]{1,6}|bugzilla-[0-9]{1,6}/gim Beam /\bBEAM-[0-9]{1,6}\b|#[0-9]{1,6}/gim Ignite /\bIGNITE-[0-9]{1,6}\b|#[0-9]{1,6}/gim Camel /\bCAMEL-[0-9]{1,6}\b|#[0-9]{1,6}/gim Jenkins /\bJENKINS-[0-9]{1,6}\b|#[0-9]{1,6}|HUDSON-[0-9]{1,6}/gim
Table 2.2: The regex patterns used to identify commits containing issues.
Our methodology here followed prior works on detecting the impact of anti-patterns on class change- and fault-proneness [7].
Step 3: Extracting The Number of Bugs: In this step, we extended our script to au-tomatically aggregate each class’s instances with bugs and find the total number of bugs the class had in a release. The number of bugs is one of two metrics that will be used to measure fault-proneness.
Step 4: Extracting The Number of Changes, Code Churn, and Defect Density: Using the script, we aggregated the number of instances a class changed in a release and found the total number of changes of each class in a release. Likewise, the total code churn for a class was automatically extracted by aggregating the code churns of each class instance. At this point, if a class had more than one instance in a release, we left only the latest one. The defect density was then computed by dividing the number of bugs in a class on the class size (LOC).
Step 5: Measuring Change- and Fault-proneness: Once we extracted the metrics needed, we mapped the data for each system under study to identify the thresholds upon which the metrics will be grouped as high, normal, or low. In this study, we refer to both normal and low groups as others. We used the Outliers library14 in R15. R is a language
that provides a wide variety of tools for statistical analysis and graphic visualization [14]. We performed the calculation of the Outlier on each metric dataset needed to answer our research questions. Table 2.3 presents the results of mapping each system in terms of percentages. To confirm the validity of the results, we did the Outliers calculations again in Microsoft Excel, and the outcome was similar to that of R.
System LOC # Changes Code Churn # Bugs Defect Density
High Others High Others High Others High Others High Others
Beam 8.98% 91.02% 8.34% 91.66% 10.78% 89.22% 11.95% 88.05% 15.74% 84.26% Camel 11.82% 88.18% 11.69% 88.31% 8.10% 91.90% 5.60% 94.40% 5.60% 94.40% Ignite 12.30% 87.70% 9.47% 90.53% 11.35% 88.65% 9.77% 90.23% 10.60% 89.40% Jenkins 10.86% 89.14% 7.34% 92.66% 13.83% 86.17% 2.97% 97.03% 2.97% 97.03% JMeter 6.14% 93.86% 6.72% 93.28% 12.17% 87.83% 7.86% 92.14% 6.55% 93.45% All Systems 11.02% 88.98% 9.66% 90.34% 10.41% 89.59% 8.47% 91.53% 9.29% 90.71%
Table 2.3: An overview of the systems releases analysed in this study.
Step 6: Analysing the data: In this last step, we use R again to apply the Wilcoxon rank-sum test [15] and compare the needed metrics within the different categories obtained in the previous step. More details about these comparisons are presented in the Results
14https://www.rdocumentation.org/packages/outliers/versions/0.14 15https://www.r-project.org/
section. The Wilcoxon rank-sum test is a non-parametric statistical test used to assess if two independent sets of variables have equally large values [3] [15]. Non-parametric tests can be used with data that is not distributed normally, which is true in our case. We used a 95% confidence level; this means that any comparison that yields a p-value under 0.05 is considered statistically significant. To confirm the results we got from R, we ran the test on the same dataset in SPSS16, another statistics software developed by IBM, and finally,
we tested it on this site17; all tools gave matching results. For the sake of simplicity, we combined all the releases of each system separately and analysed it as a whole, then we combined all the systems and tested our null hypotheses again.
Figure 2.2: Overall characteristics of Beam releases.
Figure 2.2 shows a boxplot with an overview of the analysed metrics across the eight Beam releases included in this study; each color refers to a different release. The purpose of this boxplot is to depict the metrics values graphically and present the maximum Outlier values of each metric in a way that is easy to compare across the releases. Moreover, this boxplot along with the five other figures (2.3-2.7) provide a rough observation of the correlation between change- and fault-proneness.
16https://www.ibm.com/analytics/spss-statistics-software 17https://aiguy.org/ez_statistics/
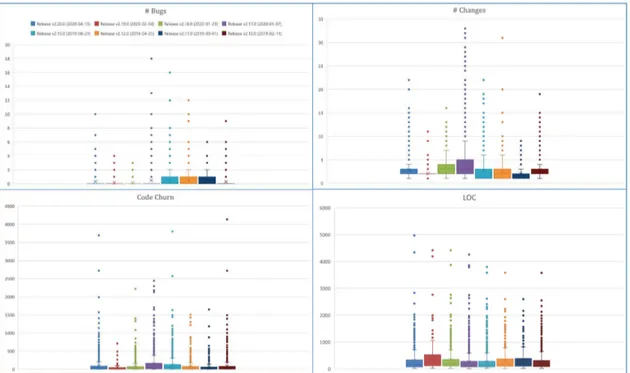
Figure 2.3: Overall characteristics of Camel releases.
Figure 2.3 shows a boxplot with an overview of the analysed metrics across the eight Camel releases included in this study; each color refers to a different release. The purpose of this boxplot is to depict the metrics values graphically and present the maximum Outlier values of each metric in a way that is easy to compare across the releases.
Figure 2.4: Overall characteristics of Ignite releases.
Figure 2.4 shows a boxplot with an overview of the analysed metrics across the six Ignite releases included in this study; each color refers to a different release. The purpose of
this boxplot is to depict the metrics values graphically and present the maximum Outlier values of each metric in a way that is easy to compare across the releases.
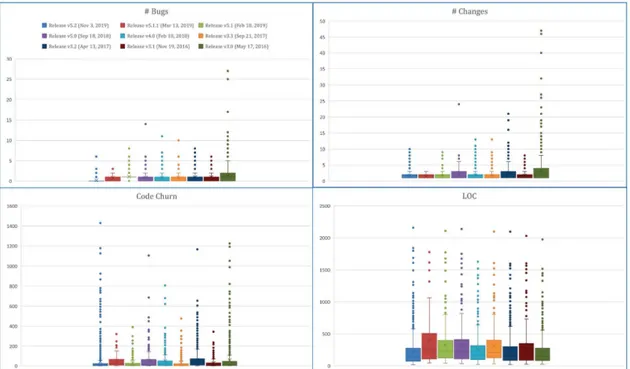
Figure 2.5: Overall characteristics of Jenkins releases.
Figure 2.5 shows a boxplot with an overview of the analysed metrics across the nine Jenk-ins releases included in this study; each color refers to a different release. The purpose of this boxplot is to depict the metrics values graphically and present the maximum Outlier values of each metric in a way that is easy to compare across the releases.
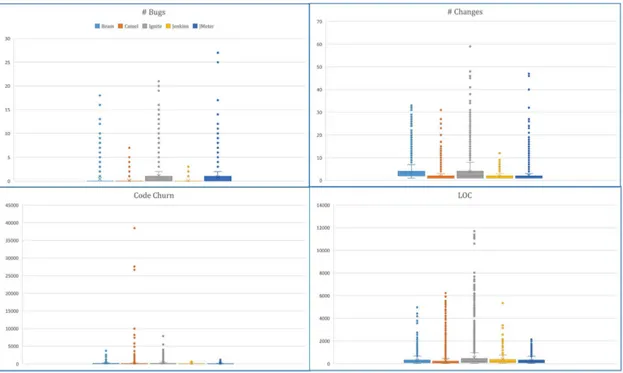
Figure 2.6 shows a boxplot with an overview of the analysed metrics across the nine JMeter releases included in this study; each color refers to a different release. The purpose of this boxplot is to depict the metrics values graphically and present the maximum Outlier values of each metric in a way that is easy to compare across the releases.
Figure 2.7: Overall characteristics of all systems.
Figure 2.7 shows a boxplot with an overview of the analysed metrics across all the systems included in this study; each color refers to a different system. The purpose of this boxplot is to depict the metrics values graphically and present the maximum Outlier values of each metric in a way that is easy to compare across the systems.
2.2 Variable Selection
In this section, we identify the dependent and independent variables used to test the null hypotheses corresponding to each of our research questions.
A) Independent Variables
– RQ1.1 and RQ3.2– Classes that went through at least one change between any two
given releases.
– RQ1.2 and RQ2.2– Classes that contain at least one fault/defect in a release.
– RQ2.1 and RQ3.1– Classes that have either changed or contain a fault/defect within
a release. LOC must be >1, but since all classes in the dataset have LOC >1, we ignored this condition.
B) Dependent Variables
– RQ1.1 and RQ2.1– there are two metrics to measure fault-proneness in this study;
the total number of bugs for each class in a release and the defect density of each class in a release.
– RQ1.2 and RQ3.1– two metrics are used to measure change-proneness in this study;
the total number of changes a class went through in a release and the total code churn which refers to the aggregated number of lines of code that were added or removed from a class within a release.
– RQ2.2 and RQ3.2– class size (LOC), represented by the number of lines of code in a
class within a release. 2.3 Reliability and Validity
In this section, we discuss the validity and reliability of our methodology. We start by discussing Construct Validity, which refers to the extent a test is measuring what it claims to be measuring [16]. In our case, the identification of the studied metrics is reliable be-cause we are retrieving the data directly from the development history repositories of five different software and their corresponding issue tracking systems. The use of R to calcu-late the thresholds and perform the Wilcoxon test is also reliable because we performed the same calculations and tests on different tools (Excel for the Outliers and SPSS for The Wilcoxon tests).
When it comes to Internal Validity, our threat comes from the fact that four of the five systems we analysed are developed by Apache, so there is a case of a systematic bias here that could have been avoided if we randomized our choices in terms of development organizations. One more threat to this validity that was beyond the scope of this study is that we did not investigate the changes that directly triggered the fault/defects. We only counted the faults/defects as they were reported by users/testers and appeared in the commit messages.
External Validity threats come from the fact that we cannot generalize our findings even though our data set is large enough to draw statistically meaningful conclusions. The study cannot claim that change-proneness causes fault-proneness, or vice versa. Further replication and validation are needed, especially that this study was limited to open-source systems developed with one programming language only.
Reliability Validity is concerned with the possibility of replicating this study. All the details and steps needed to replicate this study were provided and explained in the Method section. All the systems we studied are accessible open-source software, so the source code and issue tracking system data are available online. Moreover, the raw data we compiled and used for the statistics can be obtained through the link here18.
2.4 Ethical Consideration
All the systems analysed in this study are open-source software, so no developers’ con-sent was required. The development history repositories of the analysed software are publicly available, and so is the corresponding issue tracking system data. The raw data we collected for the calculations do not contain any private data of any users. Thus, the GDPR19 does not apply to this study. Moreover, the study is objectively investigating the correlation between two software attributes in five different software systems chosen randomly, and the findings are objective conclusions backed by statistical tests. Thus, no ethical considerations apply to this case study.
18https://github.com/Ahmadar91/Thesis 19https://gdpr.eu/
3
Results and Analysis
In this section, we present and discuss the answers to the three research questions. For each question, we also present the motivation behind it, the analysis approach followed, and then we discuss our findings.
3.1 RQ1: Is there a relationship between change-proneness and fault-proneness for
classes in object-oriented systems?
Motivation: A better understanding of the relation between change-proneness and fault-proneness in classes is an essential factor when it comes to making better design decisions. Fault-proneness can help developers predict testing priorities, faults concentration, and have a real effect on the overall project development and its cost and time. Change-proneness is also an important quality attribute because it represents the effort expected by developers to modify and improve the code; this, in turn, translates into maintenance costs. Nevertheless, no evidence has been available to this date to confirm whether there is a relation between change- and fault-proneness. In this research question, we investigated whether such a relationship exists or not using statistical evidence.
Approach: we answered this research question by dividing it into two sub-questions: • RQ1.1: Are highly change-prone classes also more fault-prone?
• RQ1.2: Are highly fault-prone classes also more change-prone?
First, we studied whether the number of faults increased in classes that changed once, at least. Hence, for each class that went through at least one change within a release, we measured the fault-proneness using the following two metrics:
• Number of bugs: the total number of faults/defects a class has within a release. • Defect density: the number of faults/defects a class has within a release divided by
the size of the class (LOC). For releases that contained more than one instance of the same class with different LOCs, only the most recent class instance was considered when calculating the defect density.
To measure the proportion of fault-proneness within highly change-prone classes, we tested the two following null hypotheses:
• H1
0.1.1: There is no relation between the total number of times a class changed
within a release and the number of faults/defects the class had in that release. • H2
0.1.1: There is no relation between the total number of times a class changed
within a release and the defect density of the class in that release.
Next, we studied whether the classes that contained more faults went through more changes. Hence, for each class that contained at least one fault/defect within a release, we measured the change-proneness using the following two metrics:
• Number of changes: the total number of times a class changed within a release. • Code churn: the total number of churns (lines added, deleted, and modified) that
a class underwent within a release. If a class has more than one instance within a release, the code churns of all instances were aggregated.
To measure the proportion of change-proneness within highly fault-prone classes, we tested the two following null hypotheses:
• H1
0.1.2: There is no relation between the number of faults/defects for a class within
a release and the number of times the class changed in that release. • H2
0.1.2: There is no relation between the number of faults/defects for a class within
a release and the total number of code churns the class had in that release
We used the Wilcoxon rank-sum test to examine H0.1.11 , H0.1.12 , H0.1.21 , and H0.1.22 . Since H1
0.1.1 and H0.1.12 investigated if change-proneness is related to a higher or lower number
of bugs and defect density, they are considered two-tailed. Likewise, H0.1.21 and H0.1.22 investigated whether fault-proneness is related to a higher or lower number of changes and code churn, so they are considered two-tailed as well. We performed all the tests using a 5% significance level, which meant that our p-value <0.05. We tested each studied system separately, and then we performed the same set of tests on all the systems in the study combined.
Findings: Classes that underwent a high number of changes within a release had a higher number of bugs and a higher defect density than other classes at a statistically significant level. The Wilcoxon rank-sum test yielded a p-value of less than 0.05 (even less than 0.01) for each system as well as for all the systems combined. Thus, the null hypothesesH0.1.11 and H2
0.1.1were rejected. The p-values presented in Table 3.1 show a statistically
signifi-cant difference.
Systems Treatment Groups Treatment Types p-value
Beam Highly change-prone ∼ Others Number of bugs 2.86e-58 Defect Density 3.66e-40 Camel Highly change-prone ∼ Others Number of bugs 9.36e-217
Defect Density 1.14e-207 Ignite Highly change-prone ∼ Others Number of bugs 0
Defect Density 1.93e-176 Jenkins Highly change-prone ∼ Others Number of bugs 0.000005
Defect Density 0.00000509 JMeter Highly change-prone ∼ Others Number of bugs 5.78e-72
Defect Density 6.99e-24 All Systems Highly change-prone ∼ Others Number of bugs 0
Defect Density 1.28e-280
Table 3.1: The Wilcoxon Rank-sum Test Between highly change-prone classes and others.
We also found that classes with a higher number of faults/defects had a higher number of changes and a higher code churn than other classes at a statistically significant level. The Wilcoxon rank-sum test yielded a p-value of less than 0.05 for each system as well as for all the systems combined. Thus, the null hypotheses H0.1.21 and H0.1.22 were rejected. Table 3.2 shows the p-values that emphasize a statistically significant difference.
Systems Treatment Groups Treatment Types p-value Beam Highly fault-prone ∼ Others Number of Changes 1.67e-100
Code Churn 2.29e-44 Camel Highly fault-prone ∼ Others Number of Changes 7.79e-56 Code Churn 1.08e-14 Ignite Highly fault-prone ∼ Others Number of Changes 0
Code Churn 0
Jenkins Highly fault-prone ∼ Others Number of Changes 0.00249
Code Churn 0.00707
JMeter Highly fault-prone ∼ Others Number of Changes 2.00e-103 Code Churn 8.98e-77 All Systems Highly fault-prone ∼ Others Number of Changes 0
Code Churn 0
Table 3.2: The Wilcoxon Rank-sum Test Between highly fault-prone classes and others.
Table 3.3 presents a summary of findings for RQ1 and its corresponding research
sub-questions.
RQ1
There is a correlation between change- and fault proneness in all the systems analysed; the statistical difference is significant.
RQ1.1
Classes that are highly change-prone are also more fault-prone; the statistical difference is significant.
RQ1.2
Classes that are highly fault-prone are also more change-prone; the statistical difference is significant.
Table 3.3: Summary of findings for RQ1.
3.2 RQ2: Is there a relationship between size and fault-proneness for classes in
object-oriented systems?
Motivation: In RQ1, we found that highly change-prone classes are also fault-prone and
vice versa; the results were also statistically significant. However, other metrics might have an essential role in further predicting the classes that are more likely to introduce bugs; the class size (LOC) is such a metric. Studying the relation between the size of a class and its fault-proneness is of interest to researchers and practitioners; researchers can benefit from the quantitative data the study provides to see if larger classes have a negative impact on the software artifact. Likewise, practitioners will consider that larger classes are more likely to produce new faults/defects so they can make an educated decision that might lead to fewer maintenance costs and better code quality. In this research question, we investigated the relationship between class size and its fault-proneness.
Approach: Like in RQ1, we answered this research question by dividing it into two
sub-questions:
• RQ2.1: Are larger classes also more fault-prone?
First, we investigated whether classes with more significant LOC numbers also had more faults/defects or defect density. Hence, for each class that had one line of code (LOC=1), at least, we measured the fault-proneness using the same metrics we used in RQ1 (i.e.,
the number of bugs and the defect density).
To measure the proportion of fault-proneness within larger classes, we tested the two following null hypotheses:
• H1
0.2.1: There is no relation between the size of a class (LOC) in a release and the
number of faults/defects the class had in that release. • H2
0.2.1: There is no relation between the size of a class (LOC) in a release and the
defect density of the class in that release.
Then we studied whether classes that contained more faults/defects were bigger. For each class that contained at least one fault/defect within a release, we measured the class size using the following metric:
• Class size (LOC): The number of lines of code a class has in a release. For classes that have more than one instance within a release, we take the most recent entry in that release, and we discard the previous ones.
To measure the proportion of large classes within highly fault-prone classes, we tested the following null hypothesis:
• H1
0.2.2: There is no relation between the number of faults/defects a class has in a
release and the size (LOC) of the class in that release.
Similar to RQ1, we use the Wilcoxon rank-sum test to examine H0.2.11 , H0.2.12 , and H0.2.21 .
We find that H1
0.2.1and H0.2.12 are two-tailed because they investigate if class size (LOC)
is related to a higher or lower number of bugs and defect density. Similarly, H0.2.21 is two-tailed because it investigates whether the number of faults/defects is related to higher or lower class size (LOC). We perform all the tests using a 5% significance level, which means that our p-value <0.05. We test each studied system separately, and then we per-form the same set of tests on all the systems in the study combined.
Findings: Larger classes had a higher number of faults/defects at a statistically signif-icant level. The Wilcoxon rank-sum test yielded p-values <0.05 when it comes to the relation between LOC and the number of bugs, as Table 3.4 shows. Thus, we rejected the null hypothesis H0.2.11 . In the same table, it was observed that larger classes also had a higher defect density. The tests yielded p-values<0.05 except for one case (JMeter) where p>0.5. However, since 4 out of 5 systems and all systems combined yielded a statistically significant difference, the null hypothesis was rejected H0.2.12 .
Systems Treatment Groups Treatment Types p-value Beam Large size (LOC) ∼ Others Number of Bugs 1.74e-23
Defect Density 0.000000419 Camel Large size (LOC) ∼ Others Number of Bugs 2.10e-23
Defect Density 1.32e-19 Ignite Large size (LOC) ∼ Others Number of Bugs 0
Defect Density 4.77e-56 Jenkins Large size (LOC) ∼ Others Number of Bugs 0.0105
Defect Density 0.0135 JMeter Large size (LOC) ∼ Others Number of Bugs 8.63e-26
Defect Density 0.649 All Systems Large size (LOC) ∼ Others Number of Bugs 0
Defect Density 4.23e-95
Table 3.4: The Wilcoxon Rank-sum Test Between Large Size Classes and Others.
We also found that highly fault-prone classes are larger (bigger LOC). The Wilcoxon rank-sum tests yielded p-values <0.05, so the difference is statistically significant and leads us to reject the null hypothesis H0.2.21 . Table 3.5 presents the p-values of the tests.
System Treatment Groups Treatment Types p-value
Beam Highly fault-prone ∼ Others Class size (LOC) 2.95e-38 Camel Highly fault-prone ∼ Others Class size (LOC) 5.36e-32
Ignite Highly fault-prone ∼ Others Class size (LOC) 0 Jenkins Highly fault-prone ∼ Others Class size (LOC) 0.0101
JMeter Highly fault-prone ∼ Others Class size (LOC) 5.57e-41 All Systems Highly fault-prone ∼ Others Class size (LOC) 0
Table 3.5: The Wilcoxon Rank-sum Test Between Highly Change-prone Classes and Others.
Table 3.6 presents a summary of findings for RQ2 and its corresponding research
sub-questions.
RQ2
There is a correlation between size and fault-proneness for classes in all the systems analysed; the statistical difference is significant.
RQ2.1 Largerclasses are also more fault-prone; the statistical difference is significant.
RQ2.2
Highly fault-prone classes are also larger classes; the statistical difference is significantexcept for JMeter.
Table 3.6: Summary of findings for RQ2.
3.3 RQ3: Is there a relationship between size and change-proneness for classes in
object-oriented systems?
Motivation: In this research question, we investigated whether larger classes are more change-prone than others. The findings of this investigation can help developers and team leaders to concentrate on change-prone classes and make more flexible software
by modifying the classes which are more prone to change. Developers may also take preventative actions to reduce maintenance costs.
Approach: Like in RQ1 and RQ2, we answered this research question by dividing it into
two sub-questions:
• RQ3.1: Are larger classes also more change-prone?
• RQ3.2: Are highly change-prone classes usually the larger classes?
First, we investigated whether classes with more significant LOC numbers also had a higher number of changes or code churn. For each class that had one line of code (LOC=1), at least, we measured the change-proneness using the same metrics we used in RQ1.2 (i.e., the number of changes and code churn).
To measure the proportion of change-proneness within larger classes, we test the two following null hypotheses:
• H1
0.3.1: There is no relation between the size of a class (LOC) in a release and the
number of changes the class had in that release. • H2
0.3.1: There is no relation between the size of a class (LOC) in a release and the
total number of code churns the class had in that release.
Then we investigated if classes that are highly change-prone also had a more significant number of LOC. For each class that went through one change in a release, at least, we measured the class size using the same metric as in RQ2.2(i.e., class size).
To measure the proportion of class size within highly change-prone classes, we test the following null hypothesis:
• H1
0.3.2: There is no relation between the number of changes of a class in a release
and the total number of size of the class (LOC) in that release.
Similar to RQ1 and RQ2, we used the Wilcoxon rank-sum test to examine H0.3.11 , H0.3.12 ,
and H0.3.21 . Both H0.3.11 and H0.3.12 are two-tailed because they investigate if class size (LOC) is related to a higher or lower number of changes and code churns. Likewise, H0.3.21 is two-tailed because it investigates whether change-proneness is related to higher or lower class size (LOC). We tested each studied system separately, and then we performed the same set of tests on all the systems in the study combined.
Findings: Larger classes (higher number of LOC) are also more change-prone. The Wilcoxon rank-sum test yielded p-values less than 0.05 for all the systems studied and for both metrics measured (see Table 3.7). Thus, the difference is statistically significant; this leads us to reject both null hypotheses H0.3.11 and H0.3.12 .
Systems Treatment Groups Treatment Types p-value Beam Large size (LOC) ∼ Others Number of Changes 3.95e-32
Code Churn 2.08e-32 Camel Large size (LOC) ∼ Others Number of Changes 3.02e-109
Code Churn 2.95e-42 Ignite Large size (LOC) ∼ Others Number of Changes 0
Code Churn 2.59e-271 Jenkins Large size (LOC) ∼ Others Number of Changes 6.80e-15
Code Churn 1.57e-19 JMeter Large size (LOC) ∼ Others Number of Changes 8.74e-51 Code Churn 3.88e-35 All Systems Large size (LOC) ∼ Others Number of Changes 0
Code Churn 0
Table 3.7: The Wilcoxon Rank-sum Test Between Large Size Classes and Others.
We also found that highly change-prone classes had a bigger LOC (i.e., they were larger). The Wilcoxon rank-sum tests yielded p-values of less than 0.05 for the systems under study and all the systems combined. The difference is statistically significant as Table 3.8 shows; this leads us to reject the null hypothesis H0.3.21 as well.
System Treatment Groups Treatment Types p-value
Beam Highly change-prone ∼ Others Class size (LOC) 1.01e-56 Camel Highly change-prone ∼ Others Class size (LOC) 2.26e-82
Ignite Highly change-prone ∼ Others Class size (LOC) 0 Jenkins Highly change-prone ∼ Others Class size (LOC) 0.00000791
JMeter Highly change-prone ∼ Others Class size (LOC) 1.34e-48 All Systems Highly change-prone ∼ Others Class size (LOC) 0
Table 3.8: The Wilcoxon Rank-sum Test Between Highly Change-prone Classes and Others.
Table 3.9 presents a summary of findings for RQ3 and its corresponding sub-research
questions.
RQ3
There is a correlation between size and change-proneness for classes in all the systems analysed; the statistical difference is significant.
RQ3.1 Largerclasses are also more change-prone; the statistical difference is significant.
RQ3.2
Highly change-prone classes are also larger; the statistical difference is significant.
4
Discussion
In this section, we discuss our results and the relation between change-proneness, fault-proneness, and class size. Table 4.1 summarizes our findings.
Beam Camel Ignite JMeter All Systems Explnation
RQ 1.1 Are highly change-prone classes also more fault-prone?
RQ 1.2 Are highly fault-prone classes also more change-prone?
RQ 2.1 Are larger classes also more fault-prone?
RQ 2.2 X Are highly fault-prone classes, usually the larger classes?
RQ 3.1 Are larger classes also more change-prone?
RQ 3.2 Are highly change-prone classes usually the larger classes?
Table 4.1: A summary of our findings.
4.1 Correlation Between Change- and Fault-proneness
To examine if there is a correlation between change-proneness and fault-proneness in classes, we investigated if the metrics that we used to measure these attributes are corre-lated. The Wilcoxon rank-sum test results show that both the number of bugs and defect densitymetrics are highly correlated to change-proneness in each system as well as in all systems combined. Similarly, with a p-value < 0.05, we found that both the number of changesand code churn metrics are highly correlated to fault-proneness in each system as well as all systems combined. Thus, change- proneness can be used as a significant indicator of fault-proneness, and vice versa.
4.2 Correlation Between Class Size and Change-proneness
One of the aims of the study is to examine if the class size (LOC) metric is correlated to change-proneness. This is done by investigating the relationship between LOC and the metrics involved in change-proneness, namely, the number of changes and code churn. The Wilcoxon test results show that a high correlation exists at a statistically significant p-level <0.05 for each system and all systems combined. Hence, the class size (LOC) metric can be used as a significant indicator to predict change-proneness, and vice versa. This conclusion agrees with that of a previous study [1], which concluded that size metrics showed a moderate or almost moderate ability to recognize change-prone classes from those that are not. Another study [17] exhibited that class size has a confounding effect on the association between OO metrics and change-proneness; this might help to further explain the results obtained here.
4.3 Correlation Between Class Size and Fault-proneness
The Wilcoxon rank-sum tests performed on class size (LOC) in relation to the number of bugsand defect density show a high correlation (p-value<0.05) between class size and both fault-proneness metrics in all systems except for JMeter, which yielded a p-value of 0.649 when comparing class size to defect density. However, class size in JMeter exhibited a high correlation with the number of bugs with a p-value <0.05. Thus, the study concludes that class size is also a significant indicator to predict fault-proneness and vice versa. This conclusion concedes with that of the study by Zhou [11], which showed that the LOC and WMC (weighted method McCabe complexity) metrics are better indicators of fault proneness in classes when compared to other OO metrics involved in that study.
5
Conclusion
This is an empirical study performed to investigate the relationship between change- and fault-proneness in object-oriented systems. We investigated whether class size has an impact on change- or fault-proneness. Five different open-source systems are analysed, and five metrics are either extracted or computed to answer three research questions. The results of the study are summarized as follows:
• There is a correlation between change- and fault-proneness for classes in object-oriented systems (RQ1).
• The class size (LOC) has an impact on a class change-proneness, and vice versa (RQ2).
• The class size (LOC) has an impact on a class fault-proneness, and vice versa (RQ3).
The findings above show that change-proneness, fault-proneness, and LOC can all be used by developers and team leaders as the indicators to predict how much effort will certain classes take. Thus, the team can plan and prioritize testing and maintenance efforts early in the development process.
5.1 Future Work
For future work, this study can be replicated using a different dataset extracted from systems written in languages other than Java or systems that are not open-source software. The type of change performed in the class can also be considered when relating changes to fault-proneness in order to obtain a better insight into how OO metrics can be employed to predict software behavior.
References
[1] H. Lu, “The ability of object-oriented metrics to predict change-proneness: a meta-analysis,” Empirical Software Engineering, vol. 17, no. 3, pp. 200–242,.
[2] L. Malhotra and A. J. Bansal, “Prediction of change-prone classes using machine learning and statistical techniques,” in Advanced Research and Trends in New Tech-nologies, Software, Human-Computer Interaction, F. V. C.-F. Communicability, Ed. Hershey, PA, USA: IGI Global, p. 193–202.
[3] F. Palma, L. An, F. Khomh, N. Moha, and Y.-G. Gueheneuc, “Investigating the change-proneness of service patterns and antipatterns,” in 2014 IEEE 7th Interna-tional Conference on Service-Oriented Computing and Applications.
[4] A. Føyen, “Dynamic coupling measurement for object-oriented software.”
[5] G. Pai and J. Dugan, “Empirical analysis of software fault content and fault prone-ness using bayesian methods,” IEEE Transactions on Software Engineering, vol. 33, no. 10, pp. 675,.
[6] F. Jaafar, “Evaluating the impact of design pattern and anti-pattern dependencies on changes and faults,” Empirical Software Engineering, vol. 21, no. 3, pp. 896–931,. [7] F. Khomh, M. Penta, Y.-G. Guéhéneuc, and G. Antoniol, “An exploratory study of
the impact of antipatterns on class change- and fault-proneness,” Empir Software Eng, vol. 17, no. 3, pp. 243–275,.
[8] L. Guerrouj, “Investigating the relation between lexical smells and change- and fault-proneness: an empirical study,” Software Quality Journal, vol. 25, no. 3, pp. 641–670,.
[9] R. Malhotra and M. Khanna, “Investigation of relationship between object-oriented metrics and change proneness,” International Journal of Machine Learning and Cy-bernetics, vol. 4, no. 4, pp. 273–286,.
[10] Y. Singh, A. Kaur, and R. Malhotra, “Empirical validation of object-oriented metrics for predicting fault proneness models,” Software Quality Journal, vol. 18, no. 1, pp. 3–35,.
[11] Y. Zhou, B. Xu, and H. Leung, “On the ability of complexity metrics to predict fault-prone classes in object-oriented systems,” Journal of Systems and Software, vol. 83, no. 4, pp. 660–674„ available: 10.1016/j.jss.2009.11.704 [Accessed 22 May 2020]. [12] A. Koru and H. Liu, “Identifying and characterizing change-prone classes in two
large-scale open-source products,” The Journal of Systems & Software, vol. 80, no. 1, pp. 63–73,.
[13] M. Borg, O. Svensson, K. Berg, and D. Hansson, “Szz unleashed: An open imple-mentation of the szz algorithm – featuring example usage in a study of just-in-time bug prediction for the jenkins project,” arXiv.org, 2019,.
[14] R.-projectorg. R: What Is R?. [online] Available at:. [Online]. Available: https://www.r-project.org/about.html
[15] D. Sheskin, Handbook Of Parametric And Nonparametric Statistical Procedures, 4th ed. Boca Raton, FL: Chapman & Hall/CRC.
[16] R. Yin, Case study research and applications: design and methods, 6th ed. Cali-fornia: SAGE Publications.
[17] Y. Zhou, H. Leung, and B. Xu, “Examining the potentially confounding effect of class size on the associations between object-oriented metrics and change-proneness,” IEEE Transactions on Software Engineering, vol. 35, no. 5, pp. 607–623„ available: 10.1109/tse.2009.32 [Accessed 22 May 2020].