Annual Report 2008: Activities and Findings
This has been a year of maintaining our central focus of studying the structure and function of the SGS ecosystem and addressing broader scientific initiatives important to our region, increasing synthetic activities, and initiating new experiments in response to the 2005 site review. Many of our activities and meetings this year were centered on the submission of the LTER renewal (LTER VI) with the project undergoing a change in scientific leadership and other substantial personnel changes. This annual report provides a summary of our A) Research Activities, B) Information Management, C) Education, Outreach and Training Activities, and D) Project Management.
A. Research Activities
During the last year, we produced 40 papers in refereed journals, 29 book chapters, four dissertations, five thesis and many abstracts from national and international meetings. Twenty-seven additional reports have been accepted by refereed journals, and five for book chapters. An additional 21 manuscripts have been submitted for publication. Six additional theses and one additional dissertation were completed by Danish students studying swift foxes on our research site. Most of our publications involved multiple authors, reflecting the collaborative spirit and interdisciplinary nature of the SGS-LTER research program. We are especially pleased to report that scientists of the SGS-LTER published the book entitled Ecology of the Shortgrass Steppe: A Long Term Perspective (Lauenroth and Burke, 2008). This volume is a comprehensive synthesis of our LTER research over the last 25 years, combining research and expertise of 23 primary authors, and further exemplifies the high degree of interaction and the interdisciplinary nature of research conducted throughout the SGS-LTER program.
Approximately 20 graduate students (including six from Denmark), 25 undergraduate students and two post-doctoral fellows worked on research related to the shortgrass steppe LTER. We continue to sample our long-term projects, as well as initiating some new short-term
experiments. Key research progress for 2007-2008 (the final year of this award cycle) is presented below for each of our three core areas: population dynamics, biogeochemical dynamics, and land-atmosphere interactions, as well as for integrated, synthetic and cross-site work.
1. Population Dynamics a. Plants
1) Plant Population and Community Dynamics On Conservation Reserve Program Lands in Northeastern Colorado: The USDA Conservation Reserve Program (CRP) converts formerly cultivated land to perennial vegetation and has included approximately a million hectares in Colorado, primarily in the shortgrass steppe, since the program began in 1985. CRP land is seeded with perennial grasses, many of which are introduced species and varieties that are not native to northeastern Colorado. Therefore, CRP fields can have a plant community that is compositionally very different from the shortgrass steppe. Understanding the variability of species composition on CRP land, relative to uncultivated shortgrass steppe is necessary to determine the extent and trajectory of plant community change, as well as the level of recovery from disturbance. Our objective was to determine how time since CRP enrollment and seed mix
(native and introduced species) interacted with environmental variability in the shortgrass steppe to affect the CRP plant community.
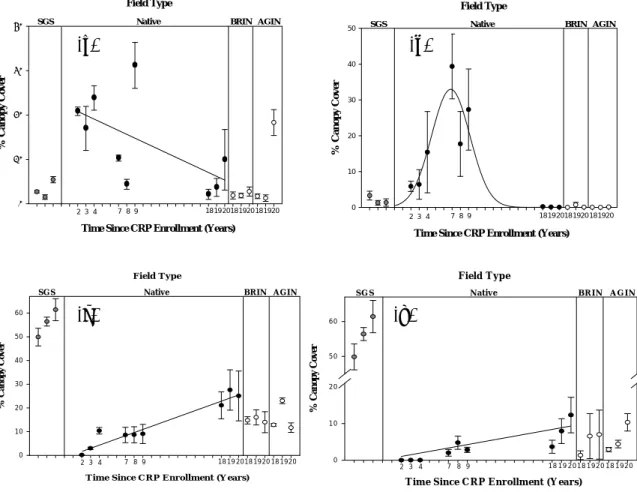
Our results show that canopy cover of functional types was affected by time since CRP enrollment. Annual and perennial forb canopy cover was high in the early CRP fields and decreased as time since CRP enrollment increased (collectively 0.9% per year, Fig. 1a). Annual forb canopy cover was approximately six times higher than annual forb canopy cover in CRP fields during the study. Annual grass canopy cover increased and reached a peak 7 years after CRP enrollment before declining to almost no canopy cover within 18 years after CRP
enrollment (Fig. 1b). Seeded perennial grass canopy cover increased 1.3% per year (Fig. 1c) and colonized (dispersed from neighboring fields) perennial grass canopy cover increased 0.5% per year as time since CRP enrollment increased (Fig. 1d). However, perennial grass canopy cover in CRP fields was under half the perennial grass canopy cover in the shortgrass steppe, which implies a lack of full recovery from CRP seeding practices.
% Canop y Cover 0 10 20 30 40 50
Time Since CRP Enrollment (Years)
2 3 4 7 8 9 181920181920181920
SGS Native BRIN AGIN
Field Type
Time Since CRP Enrollment (Years) % Canop y Co ve r 0 10 20 30 40 2 3 4 7 8 9 18 1920181920181920
SGS Native BRIN AGIN
Field Type % Ca n o py Co v er 0 1 0 2 0 3 0 4 0 5 0 6 0 T im e S in ce C R P E n ro llm en t (Y ea rs) 2 3 4 7 8 9 1 8 1 9 2 01 81 9 2 01 81 9 2 0 S G S N a tiv e B R IN A G IN F ield T y p e T im e S in c e C R P E n r o llm e n t ( Y e a r s ) % Canopy C o ve r 0 1 0 2 0 5 0 6 0 2 3 4 7 8 9 1 8 1 9 2 01 81 9 2 01 81 9 2 0 S G S N a t iv e B R I N A G I N F ie ld T y p e (b) (a) (c) (d)
Figure 1. Mean percent canopy cover (± SE) of (a) forbs, (b) annual grasses, (c) seeded perennial grasses, and (d) colonial perennial grasses (from neighboring fields) in undisturbed shortgrass steppe (SGS), and in relation to time since CRP enrollment in fields seeded with native perennial grasses (Native) and CRP fields seeded with introduced grasses: Bromus inermis (BRIN) and Agropyron intermedium (AGIN).
There were few differences in functional type canopy cover between 18-20 year old fields seeded with native and introduced perennial grasses (Bromus inermis and Agropyron intermedium). However, CRP fields seeded with introduced perennial grasses had lower species richness after 18 years (not shown). Amount and seasonality of precipitation influenced plant community dynamics. Annual and perennial forb canopy covers were correlated to annual precipitation, which influenced the species richness in CRP fields. Furthermore, a shift from high to low early growing season precipitation (April-June) during the study reduced the canopy cover of C3 species in CRP fields.
These findings contribute to our understanding of the regional variability of plant communities in the shortgrass steppe and how CRP landuse influences perennial grass recovery. This project involved several undergraduate students at Colorado State University (including two REU students) and local elementary students from Prairie School in New Raymer, CO.
2) Evaluation of limited grazing on succession and stability of CRP grasslands in shortgrass steppe of eastern Colorado: The purpose of this investigation is to determine if limited grazing of CRP fields in eastern Colorado will favor a greater presence of native shortgrasses, speed
succession, and increase belowground root biomass, thereby increasing soil organic matter and the sequestration of carbon by the system. Grazing of native shortgrass steppe reduces
abundance of weedy annual species in favor of perennial short grasses that have relatively higher allocation to soil-holding crown and root structures. However, the effects of gazing on early successional CRP have not been studied. Data is being collected in a recently planted (2004) “new” CRP field planted to native grass, an older (1989) “old” CRP field planted to mixed native and non-native grass and an adjacent native shortgrass steppe. Data collected in the first year of grazing (2007) included canopy and basal cover, aboveground plant biomass, root biomass, and selectivity of vegetation grazed.
It is too early in this study to comment on the newly imposed grazing treatment effects, but ANPP and root biomass data indicate initial differences among the native shortgrass and the old and new CRP fields. ANPP was greatest on the new CRP that was dominated by annual weed species, while allocation to roots was lowest in this treatment (Fig 2). Plant community dissimilarity of new CRP compared to native shortgrass was greater than 95%, while the
comparison for old CRP averaged 65%. Plant species richness declined from native, to old CRP, to new CRP pastures.
Grazed Grazed Ungrazed Grazed Ungrazed 350 300 250 200 150 100 50 0 Grazing Treatment Vegetation Treatment
Native Shortgrass Old CRP New CRP
A b o v egr ou n d N e t P ri m a ry P rod ucti on (g /m /y r) 2
Grazed Ungrazed Grazed Ungrazed Grazed
1100 900 700 500 300 100 Old CRP
Native Shortgrass New CRP
R o o t B iom as s ( g /m 35c m d e p th) 2
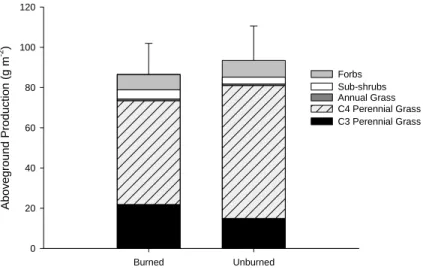
Figure. 2 Aboveground net primary production and root biomass for native shortgrass, grazed and ungrazed new CRP, and grazed and ungrazed old CRP fields in the shortgrass steppe of eastern Colorado. 3) Effects of prescribed burning on grazed shortgrass steppe: Over the past century, fire has been widely suppressed in the western Great Plains, in part due to potential negative effects on forage production for livestock. More recently, interest in the use of prescribed fire in shortgrass steppe has increased due to potential applications for wildlife management, control of unpalatable plant species and restoration of historic disturbance regimes. We studied the effects of prescribed burns conducted during late winter on herbaceous production, forage nitrogen content, and plant species composition of shortgrass steppe (Fig. 3). Late-winter burns conducted in moderately grazed sites under a wide range of precipitation conditions during 1997 – 2001 did not negatively affect forage production either in the first or second post-burn growing season. Burning
followed by a severe drought in 2002 reduced production by 19% in the second post-burn growing season of 2003. Burns temporarily suppressed the abundance of broom snakeweed (Gutierrezia sarothrae) and prickly pear cactus (Opuntia polyacantha), and enhanced forage nitrogen content during May and June of the first post-burn growing season. These findings suggest that except following severe drought, prescribed burns conducted during late winter in
grazed shortgrass steppe for objectives unrelated to livestock production can also have neutral or positive effects on livestock.
Burned Unburned Abov eground Produ ction (g m -2) 0 20 40 60 80 100 120 C3 Perennial Grass C4 Perennial Grass Annual Grass Sub-shrubs Forbs
Figure 3. Production of different plant functional groups during the first post-burn growing season on the Pawnee National Grassland, Colorado, averaged across all burned and unburned sites during 1997 – 2001. Error bars show 1 SE for total ANHP based on among-year variation.
b. Fauna
1) Ongoing long-term monitoring: We continued our long-term population studies of small mammals and carnivores. These data were updated, checked and revised and are available on the SGSLTER website. The small mammal data were the basis of a cross-site collaboration with researchers at other LTER sites, which was funded by a Network grant. A part of these
activities, we organized a symposium at the American Society of Mammalogists meeting in 2007, which led to the decision to publish papers from the symposium in a Special Feature in the
Journal of Mammalogy. Manuscripts from the five speakers, including our cross-site LTER
group, are expected to be submitted at the end of 2008. Both the rodent and rabbit studies continue to show lingering effects of the drought, with species typically associated with more arid conditions (kangaroo rats, black-tailed jackrabbits) still very abundant.
2) Ecology of plague in prairie dog colonies: Our studies of the ecology of plague in prairie dog colonies have been funded by a five-year NSF-EID grant, which ends in August 2008. Much of our efforts this year therefore were aimed at laboratory work, data analysis, and manuscript preparation and submission. We completed stable isotope analysis of fleas collected from
grasshopper mice, prairie dogs and burrows in an attempt to identify the source of blood meals to fleas, information that is needed to assess the importance of flea sharing in interspecific
transmission of plague. Heather Franklin, a MS student at CSUF, will use PCR-based genetic methods to identify blood meals of individual fleas.
3) Manipulating the density and flea-hosting abilities of grasshopper mice: In a new experiment conducted this year we tested the feasibility of manipulating the density and flea-hosting abilities of grasshopper mice to influence the likelihood that colonies are extirpated by plague. We determined that such a project would need to be conducted on a much larger spatial scale to be effective. In 2007, we examined the efficacy of using Frontline to remove fleas from
grasshopper mice, and used radiotelemetry to estimate home range size of grasshopper mice, information that is needed to parameterize models about the effects of grasshopper mice in plague epizootics.
Two MS students funded by the NSF-EID project but supported logistically by LTER completed or have nearly completed their theses. Abby Benson, who studied dispersal of thirteen-lined ground squirrels, completed her MS thesis in May. John Kraft, a MS student studying the
movements of grasshopper mice on prairie dogs, is writing his final drafts, with an expected Fall 2008 graduation date. In Summer 2007, we recruited an REU student, Amanda Boone, who was affiliated with the NSF-EID project. For her REU project and CSUF Honor’s thesis, she studied rates of removal of carcasses on and off prairie dog colonies to determine differences in
scavenging by carnivores, which could expose them to plague and help them spread the causative agent among prairie dog colonies. Amanda published her results in our college’s undergraduate research journal and we submitted a manuscript from her results for publication in
Vector-Borne and Zoonotic Diseases.
4) Effects of grazing manipulations on shortgrass steppe consumers: We have examined the effects of modifying intensity and seasonality of grazing on shortgrass steppe plant and consumer communities. Our studies expand upon the range of grazing intensities to include long-term cattle exclosures and grazed prairie dog colonies. Postdoctoral scientist Scott Newbold submitted a multi-authored manuscript to Oikos describing changes in vegetation, arthropod and small mammal communities during the first four years of the project. He is also preparing an additional manuscript on species-specific responses of tenebrionid beetles to these treatments.
In 2007 and early 2008, we focused our field sampling on estimating differences in avian nest densities and changes in vegetation structure and plant communities among the five treatments. These data continue to show slight differences in the nesting of Lark Buntings and Horned Larks among treatments. We decided to postpone additional sampling of arthropods and small
mammals until this project can be more fully integrated into the new LTER proposal.
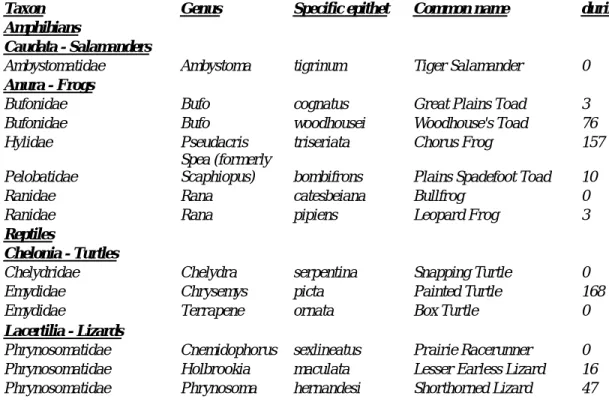
5) Survey of the amphibians & reptiles of the NREL Central Plains Experimental Range, Pawnee National Grasslands: Beginning in May 2007, we began extensive sampling of amphibians and reptiles across the SGS-LTER site. A total of 535 specimens, including 5 species of amphibians and 10 species of reptiles, were documented during the 2007 survey (Table 1). Based on
literature reports (summarized in Hammerson, 1999), 7 species of amphibians and 17 species of reptiles are expected to occur on or near the site; survey sampling therefore revealed 71% (amphibians) and 59% (reptiles) of the expected species diversity. However, this expectation is based on proximity to known records and potential availability of appropriate habitat. For example, 3/9 species of snakes expected to occur on the site had never been documented, and
this lack of presence may be due to lack of appropriate microhabitat (e.g, extensive sandy soils for Arizona) rather than sampling bias.
Amphibian species which were expected but not observed included the Tiger Salamander
(Ambystoma tigrinum) and the Bullfrog (Rana catesbeiana), an invasive introduced species. The Tiger Salamander is not often active on the surface except during rainstorms, and minimal survey efforts occurred during these conditions due to adverse driving conditions. It is expected to occur in areas with semipermanent standing water, such as in parts of the Owl Creek drainage. However, seining of ponds on the site did not reveal any larvae, which can take 6-12 months to mature, so it may not be commonly distributed on the site. The Bullfrog requires permanent bodies of water because it has a larval stage which matures over two seasons. Most areas of the SGS-LTER lack appropriate habitat for this species; however, it is common in many parts of the eastern plains, particularly in large stock ponds and in reservoirs, and is associated with declines in native ranid frog populations (Mackessy, 1998). Plains Spadefoot Toads (Spea bombifrons) were underrepresented in this survey. This species also shows limited surface activity and is commonly found only during breeding chorus formation following heavy rainfall. We have observed large breeding choruses on the PNG under such conditions (Mackessy, unpub. obs.), and because we found large tadpoles in midsummer on the SGS-LTER, we assume that this species is common on site. Reptile species which were expected but not observed included 2 turtles, 2 lizards and 3 snakes. Snapping Turtles (Chelydra serpentina) require permanent water and are not commonly observed away from major rivers or permanent ponds/lakes/reservoirs, so their absence is not unexpected.
Table 1. Amphibians and reptiles encountered on the SGS-LTER site during the active season in 2007. This list includes all species expected to occur on the site, but not all have been
documented.
Taxon Genus Specific epithet Common name
Documented during 2007 Amphibians
Caudata - Salamanders
Ambystomatidae Ambystoma tigrinum Tiger Salamander 0
Anura - Frogs
Bufonidae Bufo cognatus Great Plains Toad 3
Bufonidae Bufo woodhousei Woodhouse's Toad 76
Hylidae Pseudacris triseriata Chorus Frog 157
Pelobatidae
Spea (formerly
Scaphiopus) bombifrons Plains Spadefoot Toad 10
Ranidae Rana catesbeiana Bullfrog 0
Ranidae Rana pipiens Leopard Frog 3
Reptiles
Chelonia - Turtles
Chelydridae Chelydra serpentina Snapping Turtle 0
Emydidae Chrysemys picta Painted Turtle 168
Emydidae Terrapene ornata Box Turtle 0
Lacertilia - Lizards
Phrynosomatidae Cnemidophorus sexlineatus Prairie Racerunner 0
Phrynosomatidae Holbrookia maculata Lesser Earless Lizard 16
Phrynosomatidae Sceloporus undulatus Fence Lizard 1
Scincidae Eumeces multivirgatus Many-Lined Skink 0
Serpentes - Snakes
Colubridae Arizona elegans Glossy Snake 0
Colubridae Coluber constrictor Racer 1
Colubridae Heterodon nasicus Western Hognose Snake 4
Colubridae Lampropeltis triangulum Plains Milk Snake 0
Colubridae Pituophis melanoleucus Bullsnake 8
Colubridae Tantilla nigriceps
Plains Black-Headed
Snake 0
Colubridae Thamnophis elegans Wandering Garter Snake 1
Colubridae Thamnophis radix Plains Garter Snake 33
Viperidae Crotalus viridis Prairie Rattlesnake 7
Total 535
Box Turtles (Terrapene ornata) are much less commonly observed on the PNG generally
(Mackessy, 1998, 2004), and they are more frequently encountered in areas with well- developed sandy habitat, such as along the Platte River corridor; their absence is also not unexpected. We observe both the Prairie Racerunner (Cnemidophorus sexlineatus) and the Many-lined Skink (Eumeces multivirgatus), as these are both commonly observed on the northeastern plains. Their absence from the survey results is likely due to sampling bias. We would expect to observe the Racerunner in many areas of shortgrass prairie and the Many-lined Skink in sandy areas along drainages, such as along Owl Creek; however, Hammerson (1999) also shows no records for the site. The number of Earless Lizards (16) was also lower than expected, but this species may vary in population density from year to year depending on changes in primary productivity and insect population densities. In addition, there has been a suggestion (Taggert, 2006) that their numbers may be in decline. However, our recent observations of ~10 specimens during a Herpetology field trip to Coal Creek (Mackessy, unpub. obs., April 2008), south of the SGS-LTER site, suggest that in northeastern Colorado, they are at least locally abundant.
The three species of snakes not observed are all fossorial species, none of which have been documented on the site. The distribution of the Plains Blackheaded Snake (Tantilla nigriceps) in northeastern Colorado is not well known and it may be absent from the site. The Glossy Snake (Arizona elegans) and the Plains Milk Snake (Lampropeltis triangulum) are most commonly associated with sandy habitat, and the Glossy Snake is not known to occur in Weld County. We expect the Milk Snake to be uncommon on the site. One record of some interest is the
Wandering Garter Snake (Thamnophis elegans vagrans), as this species is largely replaced by the Plains Garter Snake on the eastern plains of Colorado. Only 7 Prairie Rattlesnakes (Crotalus
viridis viridis) were PIT-tagged in 2006-2007, and the numbers encountered were far less than
anticipated. This is also likely due to sampling bias; the numbers documented were expected for typical surveys, and it appears that in 2007 we missed the periods when snakes aggregate at hibernacular sites, such as at Prairie Dog town 35. Snakes appeared to have dispersed before survey efforts began, and unpredictable weather patterns on the plains make it difficult to know exactly when snakes will disperse in the spring. In fall 2007, funding limitations did not allow for surveys to extend into the fall (September-October) when snakes would be expected to aggregate at den sites prior to ingress.
2. Biogeochemistry
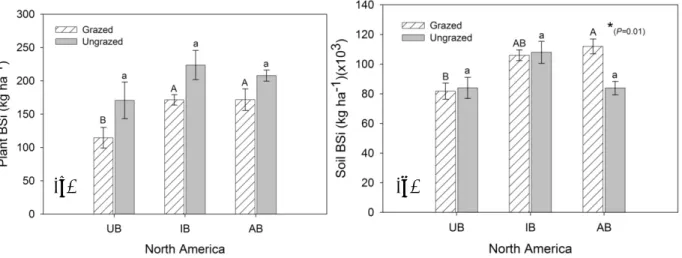
1) Fire and Grazing Impacts on Silica Production and Storage in Grass Dominated Ecosystems: Grassland ecosystems are an important terrestrial component of the global biogeochemical Si cycle. The structure and ecological functioning of these ecosystems are strongly influenced by fire and grazing; however, the role of these key ecological drivers in the production and storage of Si represents a significant knowledge gap, particularly since these drivers are being altered worldwide by human management activities. We evaluated the effects of fire and grazing on the range and variability of plant derived biogenic silica stored in plant biomass and soils of the North American grasslands and South African savannas (Melzer et al, submitted). Plant and soil samples were collected from long-term experimental plots with known fire and grazing histories on both continents. Biogenic silica totals from plants were determined gravimetrically after dry ashing and from soils by spectrophotometry after sodium carbonate dissolution. In North American soils, grazing and fire combined resulted in the greatest abundance of biogenic silica (figure 4a and 4b). In contrast, South African soils had the highest biogenic silica in burned plots in the absence of grazing (figure 5a and 5b). Plants and soils from grazed South African sites had up to 69% and 54% greater BSi totals, respectively, than grazed North American sites. These results indicate that South African plants and soils responded differently to ecological drivers with respect to Si cycling, and further, that grazed South African plants may require greater Si uptake than can be supplied by labile BSi reservoirs in soil. We conclude that fire and grazing management practices (as interactive and/or independent factors) promote increased Si production and storage and therefore may have implications for diatom production and global carbon dynamics.
(a) (b)
Figure 4. Mean plant Si concentration (kg ha-1) and Mean soil Si concentration (kg ha-1)(x103) for
unburned (UB), intermediately burned (IB), and annually burned (AB) plots that are grazed or ungrazed in North America. Capital- and lower- case letters are designated for grazed and ungrazed plots
respectively. A letter change indicates significant differences in means across fire treatments at α = 0.05. Asterisks indicate significance at α = 0.05 for grazed- ungrazed paired plots per fire treatment.
(b) (a)
Figure 5. Mean plant Si concentration (kg ha-1) and Mean soil Si concentration (kg ha-1)(x103) for the
unburned (UB), intermediately burned (IB), and annually burned (AB) plots that are grazed (Satara) or ungrazed (Ukulinga) in South Africa. Capital- and lower- case letters are designated for grazed (Satara) and ungrazed (Ukulinga) plots respectively. A letter change indicates significant differences in means across fire treatments at α = 0.05.
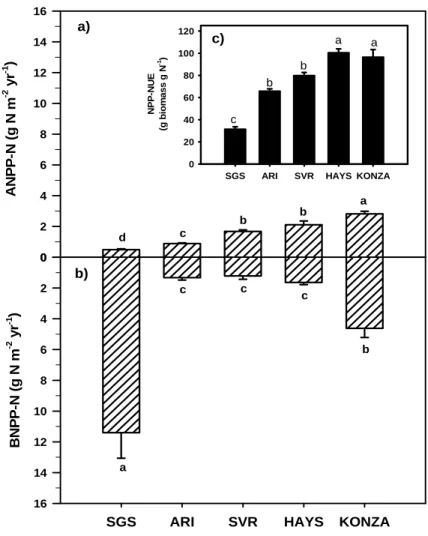
2) Conservation of nitrogen increases with precipitation across a major grassland gradient in the Central Great Plains of North America:Regional analyses and biogeochemical models predict that ecosystem nitrogen (N) pools and N cycling rates must increase from the semi-arid
shortgrass steppe to the sub-humid tallgrass prairie of the Central Great Plains, yet few field data exist to evaluate these predictions. In this study , we measured rates of net N mineralization, N in above- and belowground primary production, total soil organic matter N pools, soil inorganic N pools and capture in resin bags, decomposition rates, foliar 15N, and N use efficiency across a precipitation gradient. We found that net N mineralization did not increase across the gradient, despite more N generally being found in plant production, suggesting higher N uptake, in the wetter areas (Figures 6 and 7). Nitrogen use efficiency of plants increased with precipitation, and δ15N foliar values and resin captured N in soils decreased, all of which are consistent with
the hypothesis that N cycling is tighter at the wet end of the gradient. Litter decomposition appeared to play a role in maintaining this regional N cycling trend: litter decomposed more slowly and released less N at the wet end of the gradient. These results suggest that
immobilization of N within the plant-soil system increases from semi-arid shortgrass steppe to sub-humid tallgrass prairie. Despite the fact that N pools increase along a bio-climatic gradient from shortgrass steppe to mixed grass and tallgrass prairie, this element becomes relatively more limiting and is therefore more tightly conserved at the wettest end of the gradient. Similar to findings from forested systems, our results suggest that grassland N cycling becomes more open to N loss with increasing aridity.
SGS ARI SVR HAYS KONZA NP P-NUE (g bi om a s s g N -1) 0 20 40 60 80 100 120 A N PP-N ( g N m -2 yr -1 ) 0 2 4 6 8 10 12 14 16 Figure 1
SGS ARI SVR HAYS KONZA
B N P P -N (g N m -2 yr -1 ) 0 2 4 6 8 10 12 14 16 a) c) b) a b c c c a b b c d c b b a a
Figure 6. Nitrogen contained in (a) aboveground and (b) belowground net primary production for the 2000 growing season (ANPP-N and BNPP-N, respectively). The biomass and N content of both above- and belowground production measurements were used to calculate (c) net primary production nitrogen use efficiency (NPP-NUE). Values are means ± 1 S.E. Statistical differences (p < 0.0001) across sites are depicted by different letters in each panel.
Figure 7. For each site, seasonal trends (April – September) of in situ net N mineralization (N-Min), soil inorganic N pools (Inorganic), and inorganic N captured in resin bags (Resin) placed at the bottom of mineralization cores are shown for the 2000 growing season (arranged with the driest site (SGS) at the top of the figure and the wettest site (KONZA) at the bottom). Monthly air temperature (Temp) and
precipitation (Ppt) over this time period are shown in the inset panels for each site. Nitrogen values are means ± 1 S.E. NO3- was present in the inorganic N soil pools at all sites in all months, but often at very
low levels. Repeated measures ANOVA indicated significant site*month interactions (p < 0.001) existed across all measured N parameters. Bars marked with different letters indicate significant differences between months for each parameter measured (N-min, Inorganic, and Resin) at each site.
3) Assays of microbial activity and determination of soil microbial community composition: We developed and applied a chamber-based technique to make in situ measures of the activity of methane consuming (“methanotrophic”) bacteria. This is an important advancement because laboratory-based assays destroy the biophysical environment of the bacteria, severely limiting inference about their rates of activity in the field. Application of this technique in the SGS revealed steep declines in methanotroph activity associated with declining levels of soil
moisture. The nature of this relationship suggests new insights about the microhabitats exploited by methanotrophs. Although they might live deep within the soil matrix where water remains present under xeric conditions, our results suggest that methanotrophs live along soil pores, which become dry earlier but where methane concentrations remain relatively high. This tradeoff between methane supply through soil pores vs. soil water is interesting, and will be subject to further research.
4) Characterizing the composition of the methanotroph community: We discovered that the dominant strains of methanotrophs (JR2 and JR3) have been found in only one other place in the world: the dry annual grassland in Jasper Ridge, California. We presented these results at the 2007 annual meeting of the American Geophysical Union (Judd et al. 2007). We are intrigued by the notion that water stress may select for these JR strains, leading to biogeographic patterns in methanotrops along soil moisture gradients. To evaluate this idea further, we initiated a cross-site comparison of methanotroph community composition including Sevilleta and Konza LTER sites.
3. Land-Atmosphere Interactions
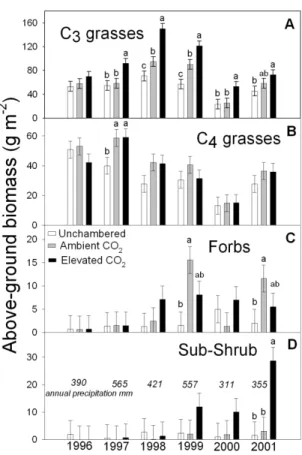
1) Increasing Atmospheric CO2 and species change on the shortgrass steppe: While grazing and
the removal of fire have likely been the dominant forces behind woody plant encroachment into many world grasslands, some have speculated that rising CO2 has been an important factor in
this process (Polley, 1997). Yet no direct evidence of this has yet been reported, leading some to question the importance of CO2 in this phenomenon (Archer et al., 1995). Research using large
open-top CO2-fumigation chambers placed over native shortgrass steppe in northern Colorado
showed that doubling CO2 over five years resulted in an approximately 84% increase in
productivity of a perennial native grass, Stipa comata (Morgan et al., 2004), and a 40-fold increase in aboveground biomass of Artemisia frigida (Figure 8), a common sub-shrub of some North American and Asian grasslands; none of the other 34 plant species responded to CO2.
These results illustrate that rising atmospheric CO2 can affect species changes due to differential
species sensitivities to CO2, and are the first evidence from a manipulative field experiment
implicating rising atmospheric CO2 in rangeland woody plant invasions. Land managers and
policy makers will need to consider the potential impact of rising atmospheric CO2 on plant
community shifts in the formulation of management practices and greenhouse gas emissions policy.
Figure 8. Within-year comparisons of above- ground biomass of functional groups of C3 and C4 grasses,
herbaceous forbs, and sub-shrub (A. frigida) as affected by growth in ambient (360 ppm CO2) and
elevated (720 ppm CO2) OTC plots and control plots conducted for 6 years, a base-line year (1996), and
5 years Of CO2 enrichment (1997-2001)
2) Impact of grazing on surface energy budgets: How the available energy (net radiation + soil heat flux) is partitioning between sensible and latent heat fluxes can affect the near-surface atmosphere through their impact on water vapor content and temperature. Eventually, this could influence cloud formation and precipitation processes. Variations in the characteristics of the underlying surface, like albedo, vegetation cover, leaf area index, soil wetness that occur at different time scales (i.e., 2-3 days after rainfall events, during the growing season, in dry and wet years) may also affect the energy balance and partition among fluxes. Grazing management practices can affect for instance biomass amount and albedo and consequently impact energy fluxes and near-surface climate. All these processes need to be accurately parameterized in numerical models of weather and climate to be able to use them to have a correct assessment of how different processes at the field level within SGS LTER site may affect the near-surface regional atmosphere. The goals of this analysis are to evaluate the impact of different levels of grazing and green biomass on near-surface climate and energy fluxes in the SGS region. This particular task is associated with one of the major hypotheses that drive the work in the Land Atmosphere Interactions: Disturbances of domestic livestock grazing and winter wheat cropping
systems at the field level affect the regional atmosphere and influence local weather patterns, through their influence on energy partitioning and balance.
We used 20-min averaged measurements of sensible, latent and soil heat fluxes using Bowen ratio flux towers located over three different grazing treatments (i.e., ungrazed, moderately and heavily grazed) plots during two growing seasons, May to October 2001 and 2002. Aboveground plant biomass was sampled monthly and separated into live (green) and standing dead (brown) biomass. Additional observations included 20-min averaged air temperature at two vertical levels, soil temperature, and water content.
There were clear interannual and seasonal variability in the energy fluxes. Mean annual
precipitation average 320 mm on the western side of the LTER site, but characterized by a high interannual variation (Lauenroth and Burke, 1995; Lauenroth and Sala 1992). Annual
precipitation during 2001 was 61% higher than in 2002, 262 mm and 163 mm respectively. The overall behavior of energy fluxes clearly reflected those differences: higher sensible heat (0.6Rn)
than latent heat flux (0.2Rn) during 2002 and an increase in latent heat fluxes during the
relatively wet year 2001 (0.4Rn) (Table 2).
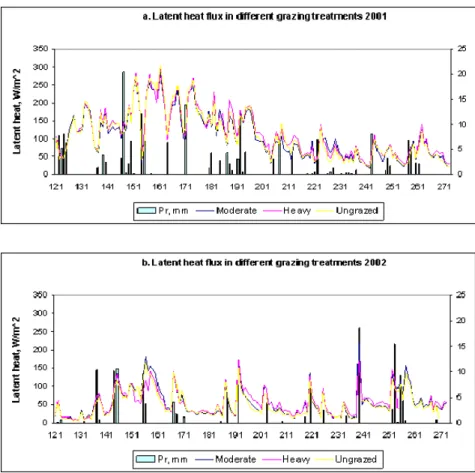
We found lower sensible and higher latent heat fluxes until the middle of the growing season consistent with high precipitation and available energy (see as an example Figure 19 for latent heat fluxes). At the end of growing season the pattern reversed, associated with a decrease in available energy and precipitation.
Overall, grazing treatments showed little impact on seasonal energy fluxes (Table 2 and Figure 9) and evapotranspiration rates. Heavy grazing tended to have the lowest live and total (green + standing brown) biomass as expected, but the impact of grazing level on green biomass was relatively small (results not shown). This could have influenced the overall response of energy and water (evapotranspiration) fluxes to grazing.
Table 2. Mean values of the components of energy balance and Bowen ration (H/Le) for each of the grazing treatments.
Figure 9. Seasonal variation in latent heat fluxes and precipitation (Pr) for 2001 and 2002, for each of the grazing treatments, Moderate, Heavy and Ungrazed.
Rainfall events have an impact over water losses at the shortgrass steppe (Parton et al. 1981): water loss is equal to potential evapotranspiration rate immediately after precipitation events, and then decreases rapidly after three to four days. We selected two to three days after each rain event and analyzed the possible impact of green biomass on energy fluxes and air and soil temperature. Significant effects of green biomass were found on fluxes and soil temperature: high evapotranspiration rates are expected to be found with high green biomass values during wet periods (Figure 10). No clear impacts of grazing treatments were found in the energy fluxes vs. green biomass relationship, but results suggest a significant potential impact of grazing on energy budgets if grazing treatments had a significant effect on live biomass.
During the wet periods after a rainfall event high green biomass were related to cooler soil temperatures (Figure 11). No effect was found for air temperatures at 2 m and 1m. This indicates that high green biomass tends to reduce the soil-air temperature differences after a rain event: the available energy is used in evaporation and transpiration, reducing soil temperatures and air-soil-air temperature differences
Figure 10. Latent (a) and sensible (b) heat flux versus green biomass during the wet periods in 2001 and 2002, for each of the grazing treatments: HG:
heavy grazing; MG: moderate grazing; UG: ungrazed.
Figure 11. Mean soil and air temperatures versus green biomass during the wet periods in 2001 and 2002.
In summary, we did not find a clear effect of grazing on the surface energy fluxes and
temperature when all the growing season information was considered. This could be significant in the days following a rainfall event, through the impact of green biomass on latent and sensible heat flux partitioning: our analysis showed a significant potential impact of grazing on energy budgets if the live biomass is very different in each of the grazing treatments.
Further analysis is needed to clarify some of the results. We recommend the following: • Albedo measurements collected at each grazing treatment plot would help assess albedo
impact on net radiation. Remote sensing technology could also be used to assess reflective differences of the surface.
• Estimation of evaporation and transpiration separately would allow addressing differential effects of soil and vegetation characteristics on latent heat fluxes.
• Remote sensing technology could be used to obtained high resolution vegetation greenness maps through vegetation indices like Normalized Difference Vegetation Index (NDVI). The indices could help in addressing spatial differences in surface energy budgets within the SGS LTER domain.
• Species composition, vegetation cover, and soil characteristics could be more thoroughly studied to clarify grazing treatment effects on energy fluxes in the SGS LTER domain. 3) Modeling of photosynthesis and energy fluxes: We also continued the refinement of the GEMRAMS and GEMLEAF modeling systems being used together with observations of water, energy, and CO2 fluxes to investigate land-atmosphere interactions at the Shortgrass Steppe
LTER. The photosynthesis parameterization in GEMLEAF was evaluated using leaf gas exchange measurements conducted over three growing seasons (1997 to 1999) collected using large open-top chambers that received ambient air (approx 360 mol mol-1 CO2). For a detailed
description of the chambers and the complete set of experiments see Morgan et al. (2001) and LeCain et al. (2003).
Previous evaluation of the photosynthesis submodel for the dominant C3 and C4 species in the
SGS LTER, Pascopyrum smithii (PASM) (C3) and for Bouteloua gracilis (C4) (Chen et al. 1996)
were performed with leaf gas exchange experiments data obtained from plants in growth chambers. Although this data represents controlled conditions of light, temperature, soil water conditions, and CO2, rarely are those conditions present in the field, especially in terms of water
stress. The parameters Vc,max (maximum rate of carboxylation by Rubisco), Jmax (saturated rate of
electron transport and quantum efficiency (α) required for the estimation of leaf photosynthesis were taken from LeCain et al (2003). We used data provided by D. LeCain and J. Morgan to evaluate the response of photosynthesis to intercellular CO2.
These data was divided according to temperature (Figure 12). For temperatures around 25°C, simulated photosynthesis was underestimated for high Ci values. For higher temperatures
Figure 12. Left: Leaf photosynthesis versus intercellular CO2 concentration for PASM measured
during the 1997 to 1999 growing seasons. Data was grouped according to mean temperature Modeled data is shown with lines, and with open triangles for temperatures higher than 30°C Right: Modeled vs. observed photosynthesis.
(30.7°C), the agreement was slightly better with the observed data for high Ci. During the mid-season (days of the year around 188 and 190) the typical mid-seasonal water stress developed, with leaf water potential of approximately -3 MPa. Water stress effect on assimilation rates is
incorporated using zero-to-one factor functions parameterized using plant water potential. Using plant water potential values of -2 MPa and -3 MPa greatly improved the response of assimilation rates to water stress.
In summary, the current photosynthesis submodel in GEMLEAF for PASM using the
information from leaf gas exchange field experiments in the SGS LTER accurately simulated the response of photosynthesis to intercellular CO2. We expect also that the C4 photosynthesis
submodel will satisfactorily reproduce the observed photosynthesis data for Bouteloua gracilis and will adequately reproduce the effect of doubled CO2 concentration on photosynthesis for
both C3 and C4.
The next step is to evaluate the C4 photosynthesis submodel and doubled CO2 effects in
photosynthesis rates and soil and plant water relations. In a second step, all the updated values and/or parameterizations will be incorporated into the land-surface model GEMLEAF and the 3-D spatial model GEMRAMS. Several model experiments will be conducted to address the effects of landscape heterogeneity (i.e., increasing the area covered by cropping systems), C3/C4 grasslands dominance and CO2 enrichment over the near-surface atmosphere. CO2 fluxes
collected using Bowen ratio flux towers for a mixed C3/C4 shortgrass site, winter wheat and corn will also be used to assess if GEMLEAF is able to capture the differences among those systems.
4) The influence of landscape heterogeneity on simulated energy fluxes and near-surface
atmosphere: A couple atmospheric-biospheric model GEMRAMS, composed of an atmospheric model, RAMS, and an ecophysiological process-based model, GEMTM was applied for a domain centered at the SGS LTER site. We simulated surface energy fluxes and atmospheric conditions for two clear days in early-summer with GEMRAMS over a model domain centered at the SGS site. The simulation experiments were set up for a 70x70 km grid domain centered at the SGS site, with 500mx500m grid spacing. As lower boundary conditions we used the National Land Cover Data (NLCD) 30mx30m dataset for vegetation type (Figure 13) and FAO dataset for soil texture specifications. The model was set up with 60 vertical levels, with the bottom level at 30m extending up to 23 km, and eight soil levels, up to a 3 m depth. Initial atmospheric
conditions were given by horizontally homogeneous profiles of temperature, horizontal wind speed and relative humidity from the National Center for Environmental Prediction (NCEP) Regional Reanalysis from the surface up to 10hPa. All the simulations were performed with the same initial atmospheric conditions. The model was run for 30 hours, for a clear day in June 2000, started at 6:00 Mountain Standard Time.
We performed several simulation experiments to address model sensitivity to land-cover and soil moisture conditions. Pairs of simulations were performed changing the land-cover and soil moisture specifications. A “natural” land-cover scenario was used in additional simulations where “crops” (i.e. wheat, corn, irrigated crops) in the “current” land-cover were replaced by a shortgrass type. Values in leaf area index, albedo, roughness length, displacement height, root depth and physiological parameters were changed accordingly. In the “control” experiments a
value of 15% of saturation volumetric soil moisture content was used for the entire domain. An additional pair of experiments was conducted using a constant 30% of saturation volumetric soil moisture profile (i.e., WET experiment). A mixed C3/C4 grassland was assumed in all the
simulations. We analyzed the simulation experiments in terms of differences in sensible (SH) and latent (LH) heat fluxes, lower first model level temperature and water vapor between “current” and “natural” vegetation patterns.
Figure 13. a) Location of the simulation domain. b) Vegetation types for a 70x70km grid centered at SGS, from a 30x30 m grid space National Land Cover Data (NLCD).
Daytime averaged simulated energy fluxes for the “current” and “natural” scenarios are shown in Figure 14 for the control run. Changes in landscape heterogeneity in the shortgrass steppe due to cropping incursions increased the spatial heterogeneity of the simulated fluxes compared to the native prairie. High LH values were found over corn and irrigated crop (in the southern part of the domain) and low values over grass and wheat. SH values presented the opposite pattern. Available energy (SH+LH) tends to be higher over the corn areas on the south of the domain, due to the lower albedo.
Figure 14. Daytime averaged SH and LH fluxes and lowest level temperature for the current (CURR) and natural (NAT) control run experiments.
The near-surface atmosphere tended to be cooler and more humid in the current simulated experiments than in the natural landscape runs in the southern side of the domain associated with the location of irrigated crops, consistent with a decrease in SH and increase in LH (Figures 14 and 15). Increasing initial soil moisture conditions (WET experiment) in general decreased the LH and SH fluxes differences between current and natural simulations respectively (Figure 15). In some cases, the pattern of differences reversed with respect to the control experiments: SH (LH) is higher (lower) in the current than in the natural scenario (see positive and negative values in SH and LH respectively in the center of the domain in Figure 3). In this case, evaporation is the predominant process under wet conditions and it is enhanced where bare ground is present. These changes translated to air temperature and humidity differences near the ground that extends up to 1500 m in the atmosphere (Figure 16). Cooler conditions still appeared in the southern part of the domain, consistent with negative differences in SH, but they decreased in the case of wet conditions. Also consistent with the LH and SH behavior in the wet experiment, warmer and drier conditions appeared with the current landscape than with the natural landscape.
Figure 15. Daytime averaged SH and LH differences between the current and natural experiments for the control (left) and WET (right) experiments.
In follow-up experiments we will update the soil texture values with the “Soil Survey Spatial and Tabular Data (SSURGO 2.2)" from the USDA and will perform additional simulations under late summer atmospheric and vegetation conditions. We will also evaluate the sensitivity of the near-surface atmospheric to spatial heterogeneity of vegetation distribution, for example variations in C3/C4 proportions and in grid spacing and number of vegetation patches, and to increase in CO2
Figure 16. Daytime averaged lowest model level air temperature and water vapor differences between the current and natural experiments for the control and WET experiments.
5) Response of plant parasitic nematodes to elevated CO2: Soil nematode communities were
assessed from three elevated CO2 experiments in grasslands, including one in the Colorado
shortgrass steppe. Grasslands are considered to be one of the most sensitive ecosystems to rising atmospheric CO2 concentrations, since, in addition to direct effects of elevated CO2 on plant
growth, indirect increases in water availability as an effect of elevated CO2 may enhance primary
production and alter plant community composition in these typically dry ecosystems. Moreover, grasslands support large populations of belowground herbivores that consume a major portion of plant biomass. The direct trophic link between herbivores and plants suggests that primary consumers may be particularly sensitive to rising CO2 concentrations; however, the responses of
belowground grassland herbivores have rarely been investigated. We reported the response of a range of herbivorous nematode populations to elevated CO2 concentrations from three distinct
grassland experiments. The three studies each involved 5–6 years of CO2 fumigation, utilized
natural or representative plant and soil communities, and were sampled at the end of the growing season. In the vast majority of cases, elevated CO2 did not affect the abundance of nematode
families (Ayres et al. 2008). Only two nematode families were significantly influenced by CO2
enrichment (Anguinidae increased in one case and Hoplolaimidae decreased in another).
Similarly, elevated CO2 did not influence the total abundance, family richness, diversity or plant
parasitic index of the herbivorous nematode community. These neutral responses to CO2
enrichment occurred despite increased root production in all three experiments, suggesting a simultaneous antagonistic mechanism may have operated, possibly decreased root quality and/or
changes in the soil environment (Ayres et al. 2008). Whatever the mechanism, our findings suggest that herbivorous nematodes in grassland ecosystems are resistant to rising atmospheric CO2 concentrations.
4. Integrated, Synthetic and Cross Site Research
1) Synthesis of Responses of Plant and Animal Production to Continuous and Rotational Grazing Systems: The experimental evaluation of grazing systems represents a highly visible and lengthy chapter in the history of the rangeland profession. Although experimentation has largely
concluded (Figure 17), contrasting interpretations still remain regarding the potential benefits of rotational grazing systems on rangelands. The overarching goal of this worldwide synthesis was to reconcile these contrasting interpretations by objectively evaluating the experimental evidence to establish a common ground for interpretation and to identify hypotheses to further clarify the potential benefits of grazing systems. The preponderance of experimental grazing research documents that weather variation and stocking rate affect vegetation and animal responses independently of grazing system. Therefore, experimental evidence does not support
implementation of rotational grazing to enhance production goals on rangelands. However, the experimental evidence does not effectively address all potential management benefits arising from rotational grazing systems because they have seldom been investigated as a component of the entire ranch enterprise. The continuation of conventional grazing systems research will yield little additional information if it is unable to disentangle the confounding effects of management objectives and capabilities, as well as personal goals and values (i.e., human dimensions), from the associated ecological effects. We hypothesize that the poorly examined interface between human dimensions and grazing systems represents the primary source of confusion regarding the purported benefits of grazing systems as managers have emphasized the socio-economic benefits of the ranch enterprise while experimental investigations have focused on ecological processes associated with soil-vegetation-herbivore interactions of individual management units.
A. Stocking Rate CG=RG 2 4 6 8 10 12 14 16 18 B. Stocking Rate CG<RG Plant Production/ Standing Crop
Numbe
r of Expe
rime
nts
1 2 3 4 5 6 7 CG>RG CG=RG CG<RG Livestock Production per Head Livestock Production per Land Area 2 4 6 8 10 12 14 16 1820 C. All Stocking Rates
Figure 17. Number of experiments evaluating plant and livestock production as a function of stocking rates.
2) Bird and rodent responses to livestock grazing related to plant community productivity and evolutionary history of grazing: The effects of domestic livestock grazing on bird and rodent communities and populations are often thought to be primarily mediated through herbivore impacts on plant community physiognomy, productivity, and species composition. Based on a large number of studies, grazing effects on plant communities across a broad geographic range of ecosystems have been shown to become more pronounced with increasing aboveground primary productivity and shorter evolutionary history of grazing by large generalist herbivores. We assessed (1) whether bird and rodent responses to grazing of North American rangelands are related to factors also important in describing how vegetation responds to grazing, and (2)
whether grazing is generally detrimental to less abundant or declining bird species and beneficial to abundant or increasing species (Figure 18).
Bird Com m unity D issi m ila rity 1.0 0.9 0.8 0.7 0.6 0.5 0.4 0.3 0.2 0.1 0 Shortgrass Steppe
Mixedgrass Prairie Tallgrass
Prairie Other Grassland Forest South West North West S Q C XMO M A H Communit GLB U y
Evolutionary History of Grazing
Long Short
Z notes{
Grazing Intensity Differential Low Moderate High Unknown * (W hitt aker index of c o m m u nity ass o c iati on) P
Figure. 18. -- Dissimilarity (Whittaker [1952] index of community association) of bird community species composition in relation to grazing intensities for plant communities of North America. Plant communities are grouped by type and evolutionary history of grazing, and grazing intensity differential within type. The short grass steppe, mixed grass prairie, tall grass prairie grouping represents a gradient of increasing primary productivity.
Livestock grazing in ecosystems with short evolutionary histories of herbivory was more likely to alter bird community composition, negatively affect abundance, and decrease species richness than in ecosystems with long histories of grazing. Rodent responses were more variable and less correlated with grazing history, although some patterns did emerge for rodents. Rodent
abundance was always negatively affected by grazing in Great Plains plant communities with a long history of grazing, and richness of rodent species was most often negatively impacted by grazing regardless of grazing history. Bird and rodent responses to grazing along gradients of above-ground primary production were also often different. Bird community composition changes due to grazing were positively correlated with primary productivity across grasslands of the Great Plains, but rodent community composition responses were not dependent upon primary productivity. Bird abundance responses to grazing were mixed across the plant productivity gradient in the Great Plains whereas rodent abundance was increasingly negative. Only a very weak suggestion was found that less abundant or declining bird species are generally more negatively impacted by grazing than are abundant and increasing species, and there was no such relationship for grassland bird species.
3) Carbon dioxide fluxes in western rangelands: In collaborative research with USDA-ARS, Bowen ratio energy balance (BREB) towers were installed and continuously measured fluxes of energy, water vapour, and CO2 from 1996 through 2001 on a variety of North American
rangelands. There were four Great Plains sites from Texas to North Dakota, including the shortgrass steppe, two Southwestern hot desert sites in New Mexico and Arizona, and two Northwestern sagebrush steppe sites in Idaho and Oregon. Results from this six-year
collaboration indicate that most sites could be a sink or source for C depending on the weather (Svejcar et al., in press). On an annual basis, the two desert sites were C sources, while three of the four Great Plains locations were C sinks (Table 3). Most locations were characterized by two to four months of high C uptake, and long periods in which net C fluxes were close to zero or represented small respiratory losses (Figure 19) shows results for shortgrass steppe and northern mixed grass prairie sites). Droughts limited periods of high C uptake, and resulted in some of the higher production sites being sources of C on an annual basis. High rates of C gain for the shortgrass steppe site were likely related to higher-than normal annual precipitation during the experiment.
Table 3. Average annual net ecosystem C exchange (NEE) for rangeland sites involved in the study.
Annual NEE (g C m-2 yr-1)
Location and
measurement years Vegetation type
Average Range Number of years with positive NEE Total measurement years Las Cruces, NM 1996-2001 Desert grassland -160 -254 to 94 1 6 Lucky Hills, AZ 1996-2001 Desert shrub -93 -162 to 55 1 6 Burns, OR 1995-2000 Sagebrush steppe 73 -61 to 229 4 6 Dubois, ID 1996-2001 Sagebrush steppe 83 -47 to 260 5 6 Mandan, ND 1995-2001 Northern mixed prairie 53 -27 to 119 6 7 Nunn, CO 1996, 1998-2001 Shortgrass prairie 107 4 to 227 5 5 Woodward, OK 1995-2001 Southern mixed prairie -11 -134 to 138 3 7 Temple, TX 1993, 1994, 1996-1999 Tallgrass prairie 99 -147 to 439 3 6
Nunn, CO - Short Grass Steppe Mont hl y N E E (g C m -2 mo -1 ) -100 -50 0 50 100 150 200 Month 1/9 5 1/9 6 1/9 7 1/9 8 1/9 9 1/00 1/0 1 1/02 Precipit a (mm m o -1 tion ) 0 100 200 300 Month 1/9 6 1/9 7 1/9 8 1/99 1/00 1/01 1/0 2 P re c ip ita tio (m m mo -1 n ) 0 100 200 300 (+) C gain (-) C loss
Mandan, ND - Mixed Grass Prairie
Mont hl y NEE ( g C m -2 mo -1) -100 -50 0 50 100 150 200
Figure 19. Monthly NEE in Colorado and North Dakota rangelands.
4) Soil Food Web Ecology: For 2007-2008 we continued our research on the patterns that we have observed in the structures and processes within soil food web of the shortgrass steppe that are important to its stability. What follows are annotations and excerpts from a recent
publication that highlights this work (Rooney et al. 2008).
Empirical patterns in food webs have consistently shown that the distributions of species and interactions in nature are more likely to be stable than randomly constructed systems with the same number of species and interactions. Food web ecology faces two fundamental challenges. First, the quantity and quality of food web data required to document the species richness and the interaction strengths among these species within food webs is largely prohibitive. The
description that we have compiled for the soils of the shortgrass steppe is by far one of the more comprehensive data sets available (Hunt et al. 1987; Moore et al 1988). Second, where food webs have been well-documented, spatial and temporal variation in food web structure has been ignored, and the research that has addressed spatial and temporal variation in ecosystems has generally ignored the full complexity of food web architecture (de Ruiter et al. 2005). We developed a simple landscape theory of food web architecture that incorporated empirical patterns, largely from macroecology and behavioral ecology, into a spatially implicit food web structure. The theory is based on the premise that the soil food web is compartmentalized into assemblages of species, termed energy channels that originate from plant roots (root energy channel), labile detritus (bacterial energy channel), and resistant detritus (fungal energy channel) (Moore and Hunt 1988, Rooney et al. 2006)). Our approach captured important architectural
features of food webs and allows for an exploration of food web structure across a range of spatial scales.
Our work led to the following results and conclusions:
Lower order consumers tend to specialize on specific basal resources, whereas higher order predators ultimately integrate energy from the distinct energy channels. As these energy channels show different biomass turnover rates (P:B ratios), the food webs are structured such that top predators couple energy channels that exhibit asymmetric energy fluxes. 1. Biomass turnover rates decrease with increasing body size (slope=-0.11, r2=0.67,
p=0.002).
2. Larger soil organisms tend to have higher trophic positions (slope=0.13, r2=0.21, p=0.11). 3. As body size increases, so does the spatial scale of movement. The more mobile taxa
also tend to feed higher in the food web.
4. Basic metabolic relationships differ between groups of organisms that occur in fast and slow energy channels. The relationship between body size and trophic position differs such that for a given trophic position, organisms within the slower energy channels are larger. This trend holds true for the shortgrass steppe ecosystem where the relationship between body size and trophic position within the bacterial channel (slope=3.1, r2=0.75, p=0.005) is significantly higher (ANCOVA p=0.02) than the slope for the same
relationship within the fungal channel, where the slope is not significantly different from 0 (p=0.55).
5. The energy channels also exhibit consistent and highly suggestive differences in the relationship between trophic position and biomass turnover. The slopes of this
relationship for the bacterial and fungal energy channels differ for the shortgrass steppe ecosystem where the relationship between body size and log(P:B ratio) within the bacterial channel (slope=-0.45 r2=0.86, p=0.003) is significantly more negative
(ANCOVA p=0.03) than the slope for the same relationship within the fungal channel, where the slope is not significantly different from 0 (p=0.73).
6. We demonstrate that food webs are hierarchically organized along the spatial and temporal niche axes of species and their utilization of food resources in ways that stabilize ecosystems.
B. Information Management
The SGS-LTER Information Management Team (IM Team) has focused on three main areas during the past year. First, the team has finished the design of our new website, supported by improvements in the underlying information architecture. The website is currently being
developed and a beta version implemented. Second, we’ve continued to work closely with SGS and other LTER site researchers and graduate students, on data discovery, integration and analysis. Third, we’ve consulted with telecommunications and information technology
professionals on cyberinfrastructure improvements for our SGS campus facilities and our field station.
The beta-version of the new SGS-LTER website (http://ccsbeta.colostate.edu/) will be ready for release shortly. The new SGS-LTER website was designed by LTER staff, researchers, and web development professionals at the Colorado State University (CSU) Creative Services. Results from ease of use studies and recommendations developed by the LTER Information Management committee were taken into consideration during the development process. New information architecture facilitates navigation throughout the rich content of the website. Our membership in the LTER network and our relationship with CSU are both features of our new home page. We used a revised data model for our relational database management system (RDBMS) to drive the new website content, which includes dynamic delivery of data and metadata, improved relationships between different types of information within the RDBMS, and more efficient navigation and search capacities for our ends users. Our new schema also contains metadata content to generate and harvest level 5 Ecological Metadata Language (EML) to the LTER Metacat, the Network-wide metadata catalog. Each attribute within each dataset and the
associated measurement units or codes are defined in accordance with the EML standard adopted by the LTER Network and that in use within the greater ecological research community.
As part of the new website, the IM Team is working closely with SGS-LTER Education and Outreach coordinators on incorporating information on education and outreach activities, and tools to communicate with SGS-LTER scientists and staff, such as the “ask an SGS-LTER scientist” online e-mail submittal form for questions from our end-users. In addition, we have implemented analytical functions to track data downloads and webpage hits throughout the website, which will enable the IM Team to gain a better understanding of our users’ behaviors on our website. The SGS-LTER website is large in scope, presenting an impressive amount of information that requires unique tools compared to other websites on the CSU campus. The tools we have built with web development professionals at CSU can be maintained and expanded by SGS-LTER staff and may be passed along to other LTER sites. Full implementation is planned for fall of 2008, allowing our research, education, and outreach community to work with improved tools online to access and exchange information as we engage in new research
activities and planning for future scientific endeavors.
The IM Team continues to work with researchers from the SGS, as well as other national and international LTER sites to provide data, expertise, and tools to facilitate integration and analysis for local, cross-site, and network-wide synthetic research projects. Information managers and researchers from the SGS, SEV, KNZ, and JRN LTER sites, Kruger National Park, in South Africa, and EcoTrends have worked together with computer scientists from The Evergreen State College on the Grasslands Data Integration Project (GDI). The GDI brings together ecologists, information managers and computer scientists to address the challenges of integrating long-term annual aboveground net primary productivity data sets, which were collected at different
temporal and spatial scales, with site-specific species nomenclature and codes, and applied various methodologies and experimental designs. Tools within the data warehouse allow data providers to standardize North American plant species codes according to the USDA Plants database (http://plants.usda.gov/), to document the unique experimental designs from each site
and to establish the comparable level of granularity of the data to perform statistically valid analysis. These datasets represent a core area of research within the LTER community, and an integrated data warehouse creates a powerful resource for ecologists from several sites to perform cross-site analyses.
At SGS-LTER, many new graduate students are collaborating with researchers and staff on publishing results from several long-term studies, including datasets produced from prescribed burns, applications of additional nutrients and water, and monitoring faunal population and community dynamics. Bob Flynn has provided support to the SGS-LTER community in various aspects of IT, programming and GIS, including writing scripts for data processing and quality assurance; developing GIS models; gathering data with GPS equipment and imagery; providing GIS data and maps for field work, modeling, planning and building the new SGS Field Station facilities. We also have extended existing GIS programs for analysis of SGS-LTER data, for example to study the movement of swift fox, visualize precipitation patterns across the greater region of the shortgrass steppe, and summarize growth patterns of plants within a square meter over ten years.
We continue to participate in planning future activities for the LTER IM committee. Nicole Kaplan serves as co-chair of the IM Committee, which establishes priorities and strategies to facilitate network-level and synthetic research that requires greater integration of information and interoperability of systems.
C. Educational, Outreach, and Training Activities
1) Research Experience for Undergraduates (REU): During the summer of 2007, two
undergraduate students worked on the SGS-LTER project as part of our REU program. Our REU students again participated in the Student Ecology Research Program (SERP) at CSU as well as conducting their own research. SERP provided a cohort of similar summer research interns and fellows with whom our REU students could discuss their research activities. Seminars on a variety of topics were provided to help undergraduate students integrate into the larger research community. Feedback from our students indicated that this was a worthwhile program for them and complimented their research experience.
Tyler Benton, Colorado School of Mines student
Mr. Benton worked with Dr. Bill Lauenroth and PhD candidate Mr. Seth Munson to investigate soil respiration following water pulses and nitrogen addition to native shortgrass steppe and on Conservation Reserve Program lands. Respiration was measured after addition of 2 mm, 5 mm and 10 mm pulses of water on replicate plots of native SGS and land that had been in the CRP for 4 and 20 years. Effects of soil moisture and temperature on respiration were also
investigated. Results suggest that water is the most limiting factor to soil respiration rates, and small precipitation events have the potential for large consequences on the carbon balance of semiarid grasslands. Mr. Benton presented his results in a talk “Soil respiration following pulse precipitation events in a semiarid grassland” at the 2008 Front Range Student Ecology
Symposium in February in Fort Collins, CO, where he was recognized for the ‘Best