Chemical Engineering
10 credits (C-level) Bachelor Thesis, spring 2005
Identification and determination of NH
4+ions
in “D-Ala-NH
2∙HCl” drug substance by
Ion Chromatography (IC)
Zenith Khan and Sara Salim
Instructor: Lena Svensson, PolyPeptide Laboratories, Malmö Mentor: Monica Lundberg, Malmö Univeristy
Sammanfattning
Inom kvalitetskontrollavdelningen på PolyPeptide görs bestämningar av negativa joner (acetat, klorid, jodid etc) med hjälp av jonkromatografi. Sedan en tid har det funnits önskemål om, att även göra jonkromatografiska bestämningar av positiva joner som ammoniumjonen. Uppgiften var att ta fram en jonkromatografisk metod för bestämning av ammoniumjoner i aminosyraderivat, D-Ala-NH2∙HCl som kopplas ihop och bildar peptider. Dessa peptider används som aktiva läkemedelssubstanser. Det är mest troligt att finna ammoniumklorid i aminosyraråvaror som innehåller amidgrupp, som D-Ala-NH2∙HCl . Ammoniumklorid bildas under syntes av dessa aminosyraderivat.
Grunden till att man vill analysera ammoniumjoner är att vid höga halter av ammoniumklorid i råvaran finns risken att under kemisk peptidsyntes få en oönskad förorening i produkten som inte är lätt att ta bort. För identifiering av ammoniumjonen användes en ammoniumstandard.
För att kunna specificera ammoniumtoppen och visa att andra katjoner inte interfererar med ammoniumjonen användes en katjonstandard som innehöll Li+, Na+, K+, NH
4, Mg2+ och Ca2+ joner. Under utveckling av metoden försökte man separera alla dessa toppar med god
resolutionsfaktor, Rs mer än 1.
Utvecklingsfasen har grundat sig på ”trial-and-error” försök. Olika metoder har analyserats på jonkromatografen och ett underlag för validering har gjorts. Validering innebär att olika parametrar skall vara innanför vissa gränsvärden. Dessa gränsvärden ska fastställas i ett protokoll av företaget (PolyPeptide Laboratories) själv.
Med den fastställda metoden som kallats Ad Hoc 345-NH4 cal-6 kan förutom
ammoniumjonen även andra katjoner som Li+, Na+, K+, Mg2+ och Ca2+ joner separeras och identifieras. Metoden Ad Hoc 345-NH4 cal-6 resulterade i en ammonium standardkurva med korrelations faktor R2 = 0,999 och visade sig vara lämplig för användning.
De parametrar som bestämts som underlag för validering är detektions- och kvantifieringsgränserna (LOD och LOQ), specificitets test, linjäritet, noggrannhet, repeterbarhet och provstabilitet.
Provets (D-Ala-NH2∙HCl) ammoniumhalt bestämdes till 4 %. Alla erhållna resultat för validerings parametrar har redovisats.
Abstract
The quality control laboratory at PolyPeptide has been performing analysis based on ion chromatography (IC) of peptides. A method for separation of negative ions (acetate, chloride etc) is already in use. Lately there has been a need for developing a method to separate positive ions, like ammonium ions, in peptides.
The task of this project was to develop a method for ion chromatography, suitable for determination of ammonium ions in the substance D-alanine amide, hydrochloride
(D-Ala-NH2∙HCl). The D-alanine amide, hydrochloride is an amino acid derivative used as starting material for chemical synthesis of peptides. These peptides are used as active pharmaceutical substances. It is most possible to find ammonium chloride in amino acids substances which content amid group, as D-Ala-NH2∙HCl. The ammonium chloride is formed during the synthesis of these amino acid derivatives.
The reason for analysing ammonium ions is that there is some risk to find undesired impurities in the product. These impurities are difficult to remove.
A standard solution of six cations which contained the ions (Li+, Na+, K+, NH4+, Mg2+ and Ca2+ ions) was used to specify the peak of the ammonium ion and to show that the other cations did not interfere with ammonium ion. These six cations were separated with a good peak resolution factor, Rs > 1.
The development was based on “trial-and-error” attempts. Different methods have been analysed by ion chromatography and a foundation of method validation has been determined. The validation consists of different parameters which shall be within certain limits. These limits shall be determined in a protocol by the company (PolyPeptide Laboratories) itself. The best method for separation of ammonium ions was determined to be
Ad Hoc 345-NH4 cal-6. This method is also useful to separate and identify other cations as Li+, Na+, K+, Mg2+ and Ca2+ ions. The method Ad Hoc 345-NH4 cal-6 resulted in an
ammonium ion standard calibration diagram with a correlation coefficient R2 = 0.999 which makes this method appropriate for use.
The parameters which have been determined as the foundation of method validation are limit of detection (LOD), limit of quantification (LOQ), specificity test, linearity, accuracy, precision and sample solution stability.
The ammonium ion content of the sample (D-Ala-NH2∙HCl) was determined to be 4 %. The obtained validation parameters are presented in this report.
Acknowledgments
Our work experience at PolyPeptide Laboratories has been very interesting and inspires us for further work within the pharmaceutical industry in the future. The environment and the staff have been very co-operative.
We would like to thank our supervisor Lena Svensson for being such a great help with our work at PolyPeptide Laboratories and for guiding us about the procedures and method used in the pharmaceutical industry. Lena has put lots of effort and time to help us complete our thesis.
We would also like to thank our examinator Johanna Nygren Spanne for providing great amount of help and guidance through out the whole journey of our education at Malmö University. We very much appreciate Johanna’s kind effort to always be there for us and encourage us to face difficulties with responsibility.
We are grateful to Monica Lundberg of being helpful with our report and Lars-Åke Tudesson, for making analytical chemistry seem so interesting and exciting, this goes for all the teachers at Malmö University for giving us the useful knowledge.
At last, but not the least we thank our families for showing great understanding and always supporting and encouraging us to complete this work.
Table of contents
Summary……….………...…….. I Acknowledgments….…….………..II
1. Introduction ... 7
1.1 General ... 7
1.2 Aim of this project ... 8
1.3 PolyPeptide Laboratories Group ... 9
1.3.1 Generic peptides ... 11
2. Background and theory ... 12
2.1 The chemistry of Amino acids and peptides ... 12
2.2 D-alanine amide, hydrochloride (D-Ala-NH2·HCl) ... 13
2.2.1 Explanation to why use the amino acid derivative and not the free amino acid in synthesis of peptides ... 14
2.2.2 Statement concerning the presence of NH4Cl in starting materials ... 14
2.3 The Ion chromatography ... 19
2.3.1 The Columns ... 21
2.3.1.1 Guard column ... 21
2.3.1.2 Separator column ... 21
2.3.2 The Eluent and the Eluent Generator ... 22
2.3.3 The Suppressor ... 24
2.3.4 The Detector ... 25
2.3.5 The Software ... 25
2.4 GMP and validation of analytical procedures ... 31
2.5 The validation parameters ... 32
2.5.1 Deviations (errors) ... 32 2.5.2 Specificity test ... 33 2.5.3 Linearity test ... 33 2.5.4 Precision ... 33 2.5.4.1 Injection repeatability ... 33 2.5.4.2 Analysis repeatability ... 33 2.5.4.3 Intermediate precision ... 33
2.5.5 Sample solution stability test ... 33
2.5.6 Accuracy test ... 34
2.5.7 Limit of detection (LOD) ... 34
2.5.8 Limit of quantification (LOQ) ... 34
3. Method and material ... 35
3.1 Chemicals ... 35
3.2 Standard ... 35
3.3 Apparatus ... 35
3.3.1 Instruments and equipment ... 35
3.3.2 Column and instrument parameters ... 35
3.4 Procedure ... 37
3.4.1 Explanation to the name of the methods ... 37
3.4.2 Method development ... 37
3.4.4 Preparation of 5 ppm Na+ ion standard solution ... 39
3.4.5 Preparation of ammonium ion standard solutions ... 40
3.4.6 Preparation of sample (2004-2169) solution in Ad Hoc 345-NH4 cal 3 ... 42
3.4.7 Preparation of sample (2004-2169) solution in Ad Hoc 345-NH4 cal 6 ... 42
3.4.8 Isocratic elution by the program Ad Hoc 345 test 3-1 ... 43
3.4.9 Gradient elution by the program Ad Hoc 345 test 2 ... 45
3.4.10 Gradient elution by the program Ad Hoc 345 test 2-3 ... 47
3.4.11 Gradient elution by the two programs Ad Hoc 345 test-lena 1&2 ... 49
3.4.12 Gradient elution by the program Ad Hoc 345-NH4 cal-3 ... 51
3.4.13 Gradient elution by the program Ad Hoc 345-NH4 cal-6 ... 53
4. Determination of the validation parameters of Ad Hoc 345-NH4 cal-6 ... 55
4.1 Specificity test ... 55
4.2 Linearity test ... 56
4.3 Injection repeatability ... 56
4.4 Analysis repeatability ... 57
4.5 Intermediate precision ... 57
4.6 Sample solution stability test ... 57
4.7 Accuracy test ... 58
4.8 Limit of detection (LOD) ... 59
4.9 Limit of quantification (LOQ) ... 60
5. Calculation and formula ... 61
5.1 Calculated concentration in ammonium ion standard solutions ... 61
5.2 The standard calibration diagram and calculation of ammonium ion content in sample (2004-2169) solution by Ad Hoc 345-NH4 cal-3 ... 61
5.3 The standard calibration diagram and calculation of ammonium ion content in sample (2004-2169) solution by Ad Hoc 345-NH4 cal-6 ... 63
5.4 The calculation of validation parameters ... 65
5.4.1 Calibration diagram for linearity test ... 65
5.4.2 Calculation of Injection repeatability ... 66
5.4.3 Calculation of Analysis repeatability ... 66
5.4.4 Calculation of Intermediate precision ... 66
5.4.5 Calculation of Sample stability test ... 67
5.4.6 Calculation of Accuracy test ... 67
5.4.7 Calculation of LOD ... 69
5.4.8 Calculation of LOQ ... 69
6. Results ... 70
6.1 Isocratic elution by the program Ad Hoc 345 test 3-1 ... 70
6.2 Gradient elution by the program Ad Hoc 345 test 2 ... 70
6.3 Gradient elution by the program Ad Hoc 345 test 2-3 ... 71
6.4 Gradient elution by the program - Ad Hoc 345 test-lena 1&2 ... 72
6.5 Gradient elution by the program Ad Hoc 345-NH4 cal-3 ... 74
6.6 Gradient elution by the program Ad Hoc 345-NH4 cal-6 ... 75
6.7 Result of validation parameters ... 76
7. Discussion and Conclusion ... 78
8. References and Literature ... 81
9. Abbreviations ... 83
1. Introduction
1.1 General
A major part of financial investments are done in biotech and other pharmaceutical
companies. The biotechnical area is a fast growing and dynamically progressing sector. A lot has been achieved during the twentieth century, especially the last twenty years. A very good example is the Human Immunodeficiency Virus (HIV), which is the virus that causes AIDS. HIV takes over the T-cells and turns them into virus factories that produce thousands of viral copies. As the virus grows, it damages or kills T-cells, weakening the immune system. This virus was used to be incurable and caused early death, but with today’s medical treatment this virus can be controlled and it is practically possible to reduce the death factor. All credit goes to the fast developing bio technical research.
Manufacturing a product for medical purposes is not just a complicated process but it also requires huge amount of money, knowledge, research and time. The analytical/analysing part in developing a pharmaceutical substance is critical to obtain the best and optimal results. Analysis is performed at every stage of the process. But in pharmaceutical industry the important analyses are made at a very early stage, where the critical responses can determine whether the product or substance will function as it was expected or not. These analyses can be physical, biological or chemical. But in real life some of these analyses depend on each other and scientists have to work and understand more than just “their” area to solve the problem. Today controls and analyses (chemical) are made with a very good quality and accuracy due to the advanced technology and precise instruments.
In thequality control department of PolyPeptide laboratories an ion chromatograph (IC) is used to determine negative ions as acetate, chloride and iodide. To determine positive ions like ammonium ion with a cation chromatographic method has been desired for a time.The focus of this project is on the chemical analysis of the substance
“D-alanine amide, hydrochloride (D-Ala- NH2∙HCl)” which is an amino acid derivative used as starting material for chemical synthesis of peptides.
1.2 Aim of this project
The aim of this thesis can be divided in two parts. The first and main part was to develop a cation chromatographic method for detecting and quantifying ammonium ion in the amino acid derivative, HCl∙H2N-CH (CH3)-CONH2.D-alanine amide, hydrochloride
Thesecond part includes the determination of basic data for the foundation ofmethod validation. Parameters such as limit of detection (LOD), limit of quantification (LOQ), linearity, accuracy, repeatability and the stability of the samples, are to be calculated.
1.3 PolyPeptide Laboratories Group
PolyPeptide Laboratories (PPL) Group is one of the world’s leading manufacturers of custom and generic peptides. The generic peptides are some of the commonly used peptides for therapeutic applications. A custom made peptide is designed to match the customers requirement, or an purchase order made by an other company. Being involved in industrial scale of pharmaceutical peptide manufacturing for over 40 years makes this company a leading specialist in this particular area. The PolyPeptide Laboratories Group employs more than 300 people worldwide at manufacturing facilities in Torrance (California), Hillerod (Denmark), Malmo (Sweden), Prague (Czech Republic) and Wolfenbüttel (Germany). The facilities in Hillerod and Malmo have good experience in developing solid and solution phase processes for custom peptides on any scale depending on customers' requirements. The facility in the USA is devoted mainly to solid phase synthesis.
The Group offers experience in all aspects of solid and solution phase peptide chemistry and provides a variety of purification techniques, including reverse-phase HPLC and ion exchange chromatography. Polypeptide Laboratories routinely apply solid phase peptide synthesis (SPPS), liquid phase peptide synthesis (LPPS) or a combination of both strategies depending on the nature of the peptide and the quantities of material required. Smaller annual requirements (gram to kg) are typically manufactured by SPPS for early (pre-Phase III) clinical development, whereas a LPPS strategy may be needed later for larger batches (1kg-100 kg). (22).
Most clinical trials are designated as phase I, II, or III, based on the type of questions that study is seeking to answer. In Phase III studies, the study drug or treatment is given to large groups of people (1,000-3,000) to confirm its effectiveness, monitor side effects, compare it to commonly used treatments, and collect information that will allow the drug or treatment to be used safely
The quality is very important and that is why the products are manufactured according to cGMP for Active Substances according to ICH Q7A 1. (21)
Polypeptide Laboratories follows GMP on FDA level, from standard operating procedures (SOPs) and production documentation to facility design.
Table 1. Regulatory and document for pharmaceuticals purposes and their equivalents in different regions
Country/region Authority Regulatory Document
USA FDA CFR § 210 and
211 Chapter 2
Europe European Commission
Pharmaceutical Unit
EudraLex Volume 4
International ICH ICH Guidelines
(GMP)
Q7A, Q2A etc
1 This document (guideline) is intended to provide guidance regarding Good Manufacturing Practise (GMP) for the manufacturing of Active Pharmaceutical Ingredients (APIs).
1.3.1 Generic peptides
Generic peptides have become increasingly important therapeutic agents for the treatment of a number of conditions, including various types of cancer, hormonal deficiencies and
osteoporosis. PPL offers a comprehensive list of generic peptides, manufactured under cGMP conditions at industrial scale. The active pharmaceutical ingredients (API) of these peptides are manufactured in Europe and the US, and sold on the bulk market worldwide.
Here are some of the generic peptides APIs that are produced from PPL.
- Buserelin is used for the suppression of testosterone in treatment of malignant neoplasms of the prostate; and as an adjunct to ovulation induction with gonadotrophins in the treatment of infertility.
- Calcitonin is the drug of choice for the treatment of osteoporosis, and is also used for the treatment of hypocalcaemia and Paget’s disease.
2. Background and theory
2.1 The chemistry of Amino acids and peptides
The amino acid is a molecule that contains a base and an acid. Molecules like this are called amfolytes. In general amino acids have the formula of H2N-C(R)H-COOH. Each amino acid consists of a central tetrahedral carbon atom linked to an amino group, a carboxylic group and hydrogen. The amino group (NH2-group) of the amino acids functions as the base and the carboxylic group (COOH-group) as the acid.
All amino acids except for Glycine, are optically active which means that these molecules are chiral. These are chemically identical but bends polarized light either to the left (L) or to the right (D). These molecules exist in both forms but the L-form is found to be the more stable form found in nature. (3)
The mean molecular weight of an amino acid residue is about 110 u (mass unit). A peptide is formed when two (or more) amino acids are connected. The carboxylic group from one amino acid reacts with the amino group of another amino acid and forms a peptide bond. The reaction is a condensation reaction, which means that a water molecule is released/splits off. See figure 1.
In general the peptides made of small numbers of amino acids are called oligopeptides or simply peptides. A peptide, which is edified by two amino acids, is called a dipeptide. If more than 10 amino acids are connected together, that is called a polypeptide. Most naturally existing polypeptide chains contain between 50 and 2000 amino acid residues and are commonly referred to as proteins. Proteins are made of amino acids just like peptides. The difference between the proteins and peptides is in the amount of amino acids. Proteins are macro molecules with a mass between 6000 and 1 000000 u. (12)
The amino acids can be arranged (placed) in different order and different amounts. There are 20 different amino acids and depending on their order and structure they form different proteins. The primary structure refers to the amino acid sequence. The secondary structure refers to the conformation adopted by local regions of the polypeptide chain. Tertiary
structure describes the overall folding of the polypeptide chain. And the quaternary structure refers to the association of multiple polypeptide chains to form multi subunit complexes. (3)
2.2 D-alanine amide, hydrochloride (D-Ala-NH
2·HCl)
D-alanine amide, hydrochloride is an amino acid derivative used as starting material for chemical synthesis of peptides. The chemical formula is HCl∙H2N-CH (CH3)-CONH2. D-alanine amide, hydrochlorideis a white powder with a molecule weight of about 124.54 u. The raw material is durable at 2-8 ºC. (24)
D-Ala-NH2·HCl had a special batch number on PPL “2004-2169”.
According to the sample specification the ammonium ion content in D-Ala-NH2·HCl (2004-2169) shall be < 3.0 % (w/w). This value was taken from a sample
2.2.1 Explanation to why use the amino acid derivative and not the free amino acid in synthesis of peptides
One almost never uses free amino acids in chemical synthesis; each amino acid has an
amino function and an acid function, as the name states. If two free amino acids where mixed and a coupling reagent added, then they would link up randomly and in variable chain lengths - in short polymerise. As this (naturally) is undesirable, one always couple between two amino acid derivatives, where one has the amino function blocked (called protected, in this case with a Z-group) and the other has the acid function blocked, e.g. as an amide or an ester. Amide really is not a protection group, as it is often a desired function in the finished peptide. So while the coupling to an amide derivative may be the first performed, the amino acid amide is the last amino acid in the peptide as such.
One does not add the amide function after the coupling to the preceding amino acid. This is perfectly feasible from a chemical standpoint, but the two ways, in which this can be
performed, have undesirable side-reactions. Treatment of a peptide (ending on an ester) with ammonia in high concentrations can harm the peptide bonds, and as it never proceeds in a 100 % yield impurities such as a peptide ending on a free acid would have to be removed
afterwards, and this can be tricky and will cost in overall yield. It is much cheaper to have a purified amino acid amide to start with. (2 & 11)
2.2.2 Statement concerning the presence of NH4Cl in starting materials
In table 2 the chemical formula and the function of each subject “which are concerned in the chemical reaction during the synthesis of the desire peptide” have been presented
Table 2. The chemical formula, the abbreviations2 and the function of each subject used in this case are shown.
(13)
Subject chemical formula Abbreviation function
N-hydroxysuccinimide C4H5NO3 HONSu coupling reagent Di-cyclohexylcarbodiimide C13H22N2 DCC coupling reagent N-Methylmorpholine C5H11NO NMM organic base Benzyloxycarbonyl- (C6H6) -CO-O-NH-R-
A benzene ring attached to -CO-O-NH-R-, where NH-R is the amino part of the amino acid
Z-3 protection
group
N-Benzyloxycarbonyl-L-phenylalanine
C6H5CH2CH(NHCOOCH2C6H5)COOH Z-Phe-OH Z- amino
acid N-Benzyloxycarbonyl-L-proline C13H15NO4 Z-Pro-OH Z- amino acid
Z- phenylalanine amide C20H23N3O4 Z-Phe-Ala- NH2 intermediate
product Z- Prolinephenyl amide C22H25N3O4 Z-Pro-Phe-NH2 impurity
L-Alanine methyl ester hydrochloride
H-Ala-OMe.HCl intermediate product
2 In the IUPAC nomenclatures mentioned above all amino acids have been assigned their own three-letter
abbreviation. Some protection groups often used have also got their own abbreviations, since they are too cumbersome to write in full all the time. (7)
3 Almost all amino acid are commercially available as Z-derivatives. The sulphur containing ones (Cys and Met)
are not, as the normal removal procedure for Z-groups - catalytic hydrogenation - does not work with these two; the sulphur inactivates the catalyst. (2)
NH4Cl in amino acid derivatives
The presence of substantial amounts of NH4Cl or other ammonium salts in amino acid derivatives used as starting materials for chemical synthesis of peptides is always critical. The ammonium chloride get deprotonated with a base “which is used during the chemical
coupling reaction of the amino acid derivatives” and forms ammonia. The ammonia will act as a nucleophil during the chemical coupling resulting in an incorporation of an amide4 function instead of the amino acid required. This side reaction is particularly undesirable when the peptide has a C-terminal amide function as illustrated below:
Desired reaction:
1. Z-Phe-OH + H-Ala-NH
2∙HCl + HONSu/DCC + NMM → Z-Phe-Ala-NH
2+ NMM∙HCl
Side reaction:2. Z-Phe-OH + NH
4Cl + HONSu/DCC + NMM → Z-Phe-NH
2+ NMM∙HCl
When proceeding with the coupling step after de-protection (hydrogenation) of the Z-Phe-Ala-NH2 with for example Z-Pro-OH the following two products will be formed:
Z-Pro-Phe-Ala-NH2 (desired product) and Z-Pro-Phe-NH2 (impurity)
The peptide chain is prolonged towards the finished product, which often is at least 10 amino acids long. The longer the desired chain the smaller the difference between impurity and product will become, and the more difficult it will be to remove it.
The impurity above is called a deletion sequence, which translates into correct sequence missing one amino acid (can be any position in the chain). These are among the most undesired impurities, as they are often difficult to detect and remove.
A “normal” deletion sequence at the C-terminal end of a peptide chain can depend on a coupling reaction not running to completion. In the case above this would result in an impurity ending on -Pro-Phe-OH, which is not nearly as difficult to remove as an impurity ending on –Pro-Phe-NH2. The free acid group at the end of the first impurity gives the impurity very different pH properties compared to the desired peptide, and makes it easier to
4 Amide: R-CO-NH
2, an organic compound containing the CONH2 group, closely related to the organic acids
remove. Therefore deletion sequences of the type, which can be formed with NH4Cl present in a starting material, are among the most undesired ones.
Unfortunately NH4Cl is most likely to be found in the amide starting materials as H-Ala-NH2∙HCl. This is due to the way these derivatives are synthesised; generally in the following way as an example using alanine:
Free alanine (H-Ala-OH) reacts with HCl as catalytic amounts and forms alanine methyl ester hydrochloride (H-Ala-OMe∙HCl). Afterwards the H-Ala-OMe∙HCl reacts with NH3 in large excess and forms alanine amide (H-Ala-NH2) and ammonium Chloride (NH4Cl).
1. H-Ala-OH + MeOH + HCl → H-Ala-OMe∙HCl
2. H-Ala-OMe
∙HCl + NH
3→ H-Ala-NH
2+ NH
4Cl
Even more NH4Cl is formed during neutralisation of the reaction product. The amino acid derivative is very hydrophilic and so removing all of the NH4Cl can be a problem for the suppliers.
Two other facts must also be considered:
I. The molecular weight of NH4Cl is small (53.45 g/mol) compared to that of most amino acid derivatives and peptides, so even a small content in % (w/w) may represent a significantly bigger content on a molar basis, and it is this content, which must be considered in connection with synthesis calculations.
II. Fortunately NH3 is a poorer nucleophil than the α-amino group of an amino acid derivative, so some help in the form of a better ability to react on the part of the amino acid derivative is available. Therefore a certain content of NH4Cl can be allowed, but too much will be a problem.
A reliable method for determining the content of NH4Cl is consequently desirable. Testing for content of chloride is not a possibility, as the amino acid derivatives ending on an amide function are almost always available as HCl salts.
Testing for ammonia by conventional pharmacopoeia (USP/Ph. Eur) methods (called limits tests) showed matrix effects from the amino acid derivative, meaning that the tests were
always positive, mainly because they take place at a pH high enough to hydrolyse the amide function and thus liberating ammonia (NH3).
Ion Chromatography has therefore been the preferred method of analysis, as it is selective and possesses good sensitivity in the form of a low Limit of Quantification (LOQ). (2 & 11)
2.3 The Ion chromatography
The Ion Chromatography (IC) apparatus used in this project is made by Dionex. (14) This instrument uses the latest technology for faster analyze and better resolution of positive ions. Initially the IC instrument was ordered by PolyPeptide for seperation of negative ions (anions). In this experiment the same apparatus has been used but some essential parts have been reordered, such as the coloumns and eluent to convert the IC to separate the cations instead of anions. Dionex has provided the all the needed hardware and performed a regular service and installation before attempting the experiments.
According to the Dionex manual ICS-2000 (14) the ion chromatography system typically consists of a liquid eluent, a high-pressure pump, a sample injector, a guard and separator column, a chemical suppressor, a conductivity cell and a data collection system, as shown in figure 2.
The eluent is pumped from the eluent generator through the injection valve to the column.
The exact volume of the sample is also injected through the injection valve. The eluent carries the sample ions through the separation column “stationary phase” in the ion chromatography (IC) system. Different samples interact differently and stay for different times in thestationary phase because different ions have different affinity for the ion exchange pack material.
Before the ions reach the detector they pass through the suppressor that transforms the eluent and the ions. The ion chromatography system is equipped with a suppressor that converts the ions from the solvent into molecules that have no charge, making the signal from the analyte ion more sufficient. The function of the suppressor is to decrease the background conductivity of the eluent and to increase the ion sensitivity.
When an ion reaches the detector it increases the voltage between the electrodes in the detector and a signal will be registered and evaluated on a printer as a chromatogram. (14) The ion chromatographic separation process can be explained in the following steps. See Figure 2
1) The eluent is a liquid that helps to separate the sample ions and carries the sample through the ion chromatography system.
2) The liquid sample is loaded into a sample loop either manually or
automatically. When triggered, the ICS-2000 injects the sample into the eluent stream. (14)
2.1) Guard column: The main function of the guard column is to trap contaminants and remove particles (e.g. carbonate ions in water) that might damage the separator column. (15)
3) In the separator column the sample ions are separated. The stationary phase detains the ions until they are separated. (16)
4) The function of the suppressor is to decrease the background
conductivity of the eluent and to increase the ion sensitivity. The suppressor removes the eluent ions and exchanges the analyte ion for H+ ion (cations), so that conductivity can be used for detection. (4)
5) By using conductivity detector the ion is detected by concentration changes, which leads to changes in the conductivity when passing through the detector. (14)
6) The detector is connected to a printer. When sample ions are passed through the detector, the conductivity will rise and show a peak in the chromatogram. (14)
2.3.1 The Columns
2.3.1.1 Guard column
To protect and increase the lifetime of the separation column, a guard column is often used. The guard column is a short section of column, is about 0.4 to 1.0 cm long. The guard column is usually filled with the same stationary phase as the analytical column and attached
immediately in front of it. The guard column acts as a filter and provides some separation as well. The main function of the guard column is to trap contaminants and remove particles (e.g. carbonate ions in water) that might damage the separator column. The guard column is inexpensive and can be changed periodically. (8 & 15)
2.3.1.2 Separator column
In the separator column the sample ions are separated. All separator columns have different pack material, but they have one thing in common, that they contain charged functional groups, which are bound to the pack material.
The stationary phase detains the ions until they become separated. Different samples stay for different time in the stationary phase. The mobility of the ions depends on their mass and charge. High charge leads to a low dissociation constant and a longer retention time. Large mass leads to a low mobility and a longer retention time. The condition for separation is that different ions have different affinity for the ion exchange pack material. The pH of the sample has an affect on separation. (16)
Ion chromatography is based upon the separation of ions by ion exchange. See figure 3
Figure 3: The ion exchange between the sample cations in the carrier phase and the functional group of the
stationary phase is the essential interaction for separating the cations. This takes place in the separator column. The equilibrium formula for the ion exchange is:
Resin-COO– H+ + M+ Resin-COO– M+ + H+, (M+ = Cations, ex: NH
2.3.2 The Eluent and the Eluent Generator
The eluent is a liquid that helps to separate the sample ions and carries the sample through the ion chromatography system. The eluent patron used in the separation of cations by IC, is methane sulfonic acid (MSA) with empiric chemical formula CH3-SO3-H.
The product ion of MSA is methane sulfonate (MSA-) with empiric chemical formula CH3-SO3-.
The eluent generator generates the desired concentration of the eulent (MSA). The eluent generator is based on:
• The MSA- electrolyte reservoir, low pressure (see figure 4) • The pump
• The MSA generator chamber • The Anion exchange connector
In the MSA- electrolyte reservoir there is a Platinum (Pt) cathode where the water undergoes electrolysis and is reduced to form hydroxide ions and hydrogen gas.
2 H2O + 2e- →2OH- + H2↑ (g)
Generated OH- displaces MAS- ions and MAS- ions migrate across the anion exchange connector into the MSA generation chamber.
The pump has been placed before the MSA generation chamber to pump in deionised water into the MSA chamber.
In the MSA generation chamber a Pt anode is placed. Deionised water is pumped in and oxidizes at the anode to form hydronium ion (H+) and oxygen gas.
H2O + 2e- →2 H+ + ½ O2↑(g)
H+ combined with MAS- ions produce the methanesulfonic acid solution, which is used as the eluent for cation chromatography.
A current (DC) is applied between the anode and cathode to control the electrolysis of water of the device. The applied current is controlled by the given carrier flow rate and the
concentration of MSA. (17) See figure 4.
2.3.3 The Suppressor
The function of the suppressor is to decrease the background conductivity of the eluent and to increase the ion sensitivity. The suppressor removes the eluent ions and exchanges the analyte cation for H+ ion, so that conductivity can be used in the detector. (4)
The suppressor used in the IC apparatus is CSRSII, as mentioned in Dionex reference library. (18)
In the cathode chamber water undergoes electrolysis to form hydrogen gas (H2) and hydroxide ions (OH-). By electrolysis of water oxygen gas (O
2) and hydronium (H+) ions are formed in the anode chamber. Anion exchange membranes only let negative ions pass through the membrane. Hydroxide ions move from the cathode chamber into the eluent chamber and react with hydronium ions and form water.
In the eluent chamber the analyte in dissolved in the eluent (H+ MSA-). Methane sulfonate (CH3-SO3-) is the anion in the eluent MSA. Methane sulfonate (MSA-) is attracted by an electrical potential applied to the anode and moves across the membrane towards the anode and preserves the electric neutrality. The ions (CH3-SO3- and H+) from the system go to the waste.
After this the analyte is dissolved in water and moves on to the detector. In this way only sample ions will be detected in the chromatogram. See figure 5 (18)
Figure 5: The chemical reaction in the suppressor. This is auto suppression with cation self-regenerating CSRS
2.3.4 The Detector
The conductivity detector is the most common type of detector used in ion
chromatography. This is because the electrolytic conductivity is a universal character among ions. All ions have the capacity to conduct electron flow (current).
When the sample ions separate they go through the suppressor into a flow cell that is connected to the detector. Here the ions generate a signal that is detected and evaluated. The detector is connected to a printer.
The eluate is passed through a flow cell, in which there are two electrodes. Between the two electrodes there is a voltage. The ability of the solution to transfer electrons increases when the sample ions reach the cell. The increase of the current is proportional to the increase of conductivity.
The distance (space) between the electrodes is called d, and the area of the electrodes is called A.
Quotient d/A is the detector’s cell constant, K [cm-1].
Conductance G between the electrodes is measured continuously and is dependent on the size of the ion charges and the concentration.
The conductivity, which is an intrinsic character of the solution, can be calculated from the conductance. In this way, when sample ions pass through the detector, the conductivity will rise and create a peak in the chromatogram.
Conductance G = 1/R [units: S (Siemens) or Ω-1] The electrolytic conductivity [S cm-1]
k = K G = (d/ A)*G (25)
2.3.5 The Software
The software system used in this analysis is called Dionex Chromeleon 6.60. (19)
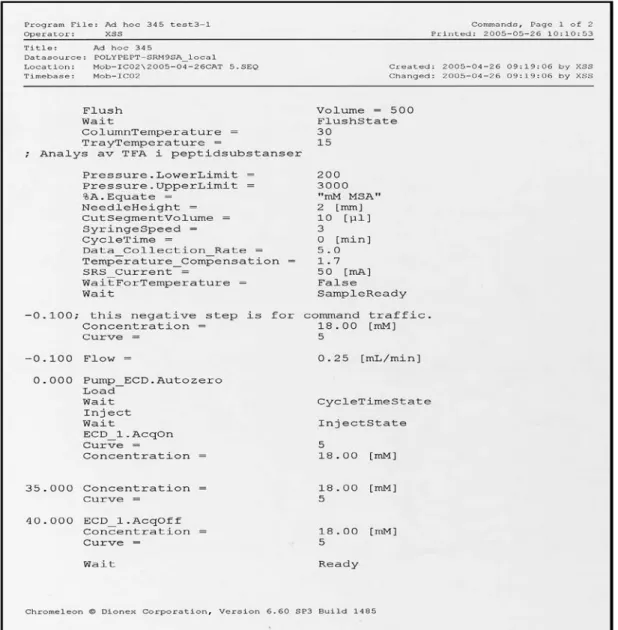
This software program sets all the determining parameters to fixed values for the separation of the ions. This program contains all the information regarding instrument parameters, for example the pressure of the pump, the column temperature (see table 5 in 3.3.2) and the elution concentration during the time. See figure 6.1
Data Analysis
• The conductivity cell transmits the signal to a data collection system.
• The data collection system (for the ICS-2000, this is Chromeleon®) identifies the ions based on retention time, and quantifies each analyte by integrating the peak area or peak height. The data is quantitated by comparing the sample peaks in a
chromatogram to those produced from a standard solution. The results are displayed as a chromatogram and the concentrations of ionic analytes can be determined.
Figure 6.1 Shows a typical table of the parameters created by the software, Chromeleon
This creates the program of how the test will be running. After completing the program description, a sequence is made.
Sequence is a list where different samples in different order are set for testing. All this is
done through the software Chromeleon. When the samples are put in the sample tray of the IC apparatus the experiments is ready to run. If several samples are to be processed successively, they are included in a sample list (sequence table), together with the instrument control and evaluation information. The sequence collects the data regarding the standard solutions or sample solutions and how many times of each sample shall be injected.
See the sequence in figure 6.2
Figure 6.2 Shows a sequence created by the software, Chromeleon
The analysis starts as soon as the chromatographic conditions, the samples to process, and their order have been defined during sequence creation.
Once the program starts to run it generates the chromatograms. The sample preparations, which are done manually, sequence and the program are the main parts of each testing. Different tests (experiments) have different set up of sample preparation, program or sequence.
Sample preparation + Program + Sequence Method
The method and the development of it will be further explained in 3.4.2 Method
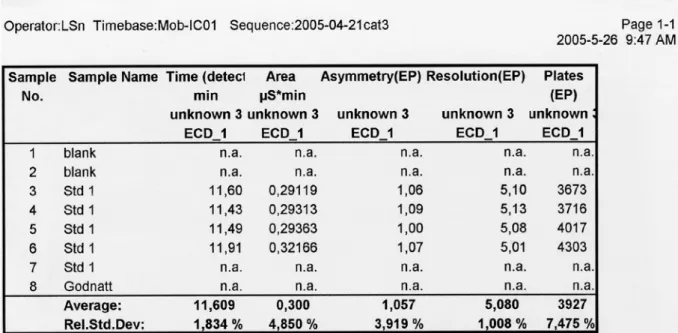
A report template (chromatogram) contains several special sheets for different print data. The Peak Analysis and Summary sheets are included in the default report template.
The Peak Analysis tab provides a summary of the characteristics of the single peaks such as the peak width, peak height, peak type, resolution, asymmetry, and the number of theoretical plates. Peaks are typically identified by the retention time. In contrast to the peak analysis, the
summary includes all samples in the sequence. The Summary always refers to the current
peak. See the summery table in table 3. (19)
Table 3. Summary of peaks is a part of Chromeleon chromatography software.
Important factors as asymmetry, resolution and plate count of the chromatography analyses, which are defined below, are calculated:
Figure 7.1: Chromatogram where tm for the solute peak and tR for the analyte are shown. (5) The chromatogram in figure 7.1 is described in details below:
• The retention time (tR) “time required for the analyte peak to appear” measured in minutes [min]. tm is the time it would take for an unretained solute peak to appear.(4)
• The height of peak measured (by the Chromeleon software) in micro Siemens unit
[µS], (see 2.3.4)
• The width of peak measured in cm or mm on the chromatogram. By using the printing speed (of the printer) the width of the peak is calculated to time [min]
• The area bellow the peak measured in micro Siemens ⋅ minutes [µS ⋅ min]
• The resolution (Rs) of two chromatographic peaks is defined by the following formula: ) ( ) ( 18 . 1 2 1 1 2 W W R R R t t s + − =
Rs, the resolution is the retention time measured from time of injection to time of elution of peak maximum
Rt, the retention time for the analyte peak [min]
W, the width of the peak measured at 50% of the peak height. (4) • The plate count, N is the number of plates of a column toward a particular compound.
Theoretical plate number is a measure of column efficiency. That means how many peaks can be located per time unit of the chromatogram. (4)
2 t W R x .54 5 N = • Asymmetry factor As = A / B A + B = W0.1
W0.1 is the Peak widths at 10% of peak height. A is the widths from tR to the left side.
B is the widths from tR right side of the symmetric peak. (4) See figure 7.2
2.4 GMP and validation of analytical procedures
Good manufacturing practice (GMP) regulations require a quality approach to
manufacturing, enabling companies to minimize or eliminate instances of contamination, mix-ups, and errors (fitness for use). GMP is regulatory promulgated by the US Food and Drug Administration (FDA), and contains guidelines to assure high quality of manufacturing active pharmaceutical ingredients (API). GMP does not ensure a high level safety of using the product. The international authority, International Conference on Harmonisation (ICH) of
technical requirements of pharmaceuticals for human use, uses guidelines to keep the good
standard of quality. GMP is among those guidelines that are used to support the good quality work of bio technical processes and pharmaceutical manufacturing. (1 & 20)
The factors that have to be analyzed to validate an analytical process are shown in table 4.
Table 4. Lists typical validation characteristics regarded for the validation of different types of analytical
procedures (6)
Detailed interpretations of the symbols in table 4 are listed below: - Signifies that this characteristic is not normally evaluated. + Signifies that this characteristic is normally evaluated.
(1) In cases where reproducibility has been performed, intermediate precision is not needed.
(2) Lack of specificity of one analytical procedure could be compensated by other supporting analytical procedure(s).
(3) May be needed in some cases.
In analytical chemistry there are two very important parameters, which are quality and reliability. Quality ensure that the analysis fulfil the highly placed requirements and is of
2.5 The validation parameters
2.5.1 Deviations (errors)
Systematic errors: A systemic error affects the accuracy. This can be for example an
error in the apparatus. (9)
Random errors: A random error affects the repeatability of the analysis. This error is
dependent on the analyst. Practically it could be the dilutions and weighing of the sample. (9)
Three statistics factors “average, standard deviation and relative standard deviation” are used in this project.
The average result (X ): is calculated by summing the individual results and dividing
this sum by the number (N) of individual values. (9)
X is calculated as in formula 2. N Xi X N
∑
= 1 The standard deviation (SD): is a statistic that tells you how tightly all the variousexamples are clustered around the mean in a set of data. With other words the standard deviation is a measure of how precise the average is, that is, how well the individual numbers agree with each other. It is a measure of a type of error called random error. (9) SD is calculated as in formula 3. SD = 1 ) ( 1 2 − −
∑
N X Xi NThe relative standard deviation (RSD): is often more convenient. It is expressed in percent and is obtained by multiplying the standard deviation by 100 and dividing this product by the average. (9)
RSD is calculated as in formula 4. RSD = SD · 100 / mean value
2.5.2 Specificity test
The investigation of specificity is performed to show that no peak of other possible impurities interferes with the ammonium ion peak. (6)
2.5.3 Linearity test
The investigation of linearity is done to show that the analytical procedure, within a given range, gives test results that are directly proportional to the ion content (in this case NH4+ ion). A correlation coefficient “R2”(how well the experimental point fit a straight line) will be obtained. (6)
2.5.4 Precision
Precision of the method is a measure of how close the data values are to each other for a number of measurements under the same analytical conditions. The precision is determined by injection repeatability, analysis repeatability and intermediate precision. (6)
2.5.4.1 Injection repeatability
Injection repeatability expresses the precision under the same operating conditions over a short interval of time and with the same solution.
2.5.4.2 Analysis repeatability
Analysis repeatability expresses the precision under the same operating conditions over a short interval of time
2.5.4.3 Intermediate precision
Intermediate precision expresses within-laboratory variations. It is tested by repeating the analysis described in the method, by two different analysts. (6)
2.5.5 Sample solution stability test
This investigation is performed to support sample solution stability under normal laboratory conditions for the duration of the test procedure. This test was done to determine if/how the ammonium ion content in the sample solution changes over time (6).
2.5.6 Accuracy test
Accuracy expresses the closeness of agreement between the true value and the value found. This test was done to observe the closeness of agreement between the true value and the value found of the ammonium ion content in the sample. (6)
2.5.7 Limit of detection (LOD)
The limit of detection (LOD) is the lowest concentration of analyte in a sample that can be detected under the stated experimental conditions. The limit of detection is determined as a signal to noise ratio of 3:1. The noise is determined from a blank injection around the retention time of NH4+ ion. (6)
2.5.8 Limit of quantification (LOQ)
The limit of quantification (LOQ) is the lowest concentration of analyte in a sample that can be determined with acceptable precision and accuracy under the stated experimental
conditions. The limit of quantification is determined as a signal to noise ratio of 10:1.The noise is determined from an injection of a blank solution around the retention time of NH4+ ion. (6)
3. Method and material
3.1 Chemicals
1 Methanesulfonic Acid (MSA) 2 Milli-Q water
Chemicals of equivalent quality may be used.
3.2 Standard
1 Standard solution of six cations which contained the ions (Li+, Na+, K+, NH4+, Mg2+ and Ca2+) and the NH4+ ion concentration was almost 400 mg/l or 400 ppm, see the concentration of the other ions in Appendix 1.
2 Ammonium ion standard solution, (concentration: 997 ± 2 µg/ml, see Appendix 7 for more standard specifications).
3 Na+ ion standard solution, 10 mM NaOH Standards of equivalent quality may be used.
3.3 Apparatus
3.3.1 Instruments and equipment
1 Autosampler Dionex AS50 2 Detector and pump Dionex IC25 3 Eluent generator Dionex EG40 4 Column oven Dionex AS50
5 Software system Dionex Peak Net 6.3 (Chromeleon) or higher Equivalent equipment may be used.
3.3.2 Column and instrument parameters
The basic parameters such as the following were given fixed values.
All these parameters were the same for the experiments of method development, and therefore called basic parameters. But in some experiments there had been some changes to optimize the result 5. See table 5
Table 5. The fixed value of the IC parameters is shown.
Suppressor Dionex CSRS-Ultra-II-2mm
Column Dionex CS12A, 2 mm
Guard column Dionex CG12A, 2 mm
Trap column Dionex ATC-1 9 x 24 mm. 4 mm
Pressure limit Lower: 200 bar Upper: 3000 bar Injection volume 25 µl
Flow rate 0.25 ml/min.
Suppressor current 50 mA
Temperature5 Auto sampler: 15 °C or 20 °C Column: 30°C
Peak measurement Area
5Auto sampler /tray temperature was not constant in all experiments.
The tray/auto sampler temperature was 15 °C in 3.4.8, 3.4.9, 3.4.10, 3.4.11, 3.4.12.
The tray/auto sampler temperature had only been changed in 3.4.13 (Ad Hoc 345-NH4 cal-6) to 20 °C.
See the cation-exchange column specifications for CS12 in table 6
Table 6. The IonPac CS12A cation-exchange column specifications as mentioned in Dionex reference library.
Dimensions IonPac CS12A Analytical Column: 2 × 250 mm
IonPac CG12A Guard Column: 2 × 50 mm Maximum operating pressure 4000 psi (27 MPa)
Mobile phase compatibility Acidic eluents; 0–100% acetonitrile. Alcohols should be avoided.
Substrate characteristics Bead Diameter: 8 µm (2 and 4 mm), 5 µm (3 mm) Functional group characteristics Ion-Exchange Groups: Grafted carboxylic acid and
phosphonic acid
Surface Characteristics: Medium hydrophilic
3.4 Procedure
3.4.1 Explanation to the name of the methods
Regarding to the name of methods like Ad Hoc 345-NH4 cal-6 should be explain that the Ad Hoc is the term for all investigation works that are analysed outside the GMP at
Polypeptide. Every test is assigned a chronological Ad Hoc number. Our examination work was the 345:th investigative work at the company and therefore called Ad Hoc 345. The later designation was an abbreviation that could be easier to save the name of method by the computer and to remember. For example NH4 represented ammonium ion, cal represented calibration curve and number 6 represented the number of experiment.
3.4.2 Method development
The results of the program and method were evaluated to either be rejected or accepted. The method with the acceptable responses was later on validated. The acceptable method is
Method development
Gradient elution
Isocratic elution
Ad Hoc 345 test 2-3
Was rejected
Ad Hoc 345 test 2 Ad Hoc 345 test 3-1
Ad Hoc 345 test –lena 1& 2
Ad Hoc 345-NH4 cal-3 Determination of validation parameters Ad Hoc 345-NH4 cal-6
Was accepted
Using a 0.2 ppm NH4+ ion instandard solution for six cations Increasing eluent concentration (1-35 mM)during 40 minutes
Using a 0.8 ppm NH4+ ion in
standard solution for six cations Eluent gradient starts and ends at the same concentration (3 mM)
Using a 0.8 ppm NH4+ ion in
standard solution for six cations Constant eluent concentration (18 mM) during 40 minutes
Using a 0.4 ppm NH4+ ion in standard solution for six cations
Establish a NH4+ ion standard calibration diagram
Determination of NH4+ ion in D-Ala-NH2·HCl
Changing the tray/auto sampler temperature
Establish a new NH4+ ion standard calibration diagram
Determination of NH4+ ion in D-Ala-NH2·HCl
Using a 4.0 ppm NH4+ ion in
standard solution for six cations Eluent gradient starts and ends at a higher concentration (20 mM)
the method with good separation of different cations and integratable peaks with good asymmetry factor value (≈ 1) and a tailing factor close to the value of 1.
The optimal eluent (MSA) concentration to carry the cations to the column and separate them with a high resolution was tested by two different pathways:
• isocratic elution: with constant eluent concentration • gradient elution: with increasing eluent concentration
3.4.3 Preparation of standard solutions for six cations
The standard solution of six cations ((Li+, Na+, NH
4+, K+, Mg2+ and Ca2+ ) was bought from Dionex. This standard solution was used to specify the peak of the ammonium ion and to show that the other cations did not interfere with ammonium ion. The concentration of NH4+ ions in the standard solution was 400 ppm. To prepare different concentration of NH4+ ions, the standard solution was diluted with distilled water. See paragraph 3.2 and Appendix 1 for more standard specifications.
The preparation of 0.2 ppm NH4+ ion in standard solution of six cations (std 1) 1.000 ml of the standard solution for six cations was transferred to a 100 ml flask.
The 100 ml flask was filled to volume with Milli-Q-water and mixed. 1.000 ml of the above solution was transferred to a 20 ml flask.
The 20 ml flask was filled to volume with Milli-Q-water. The solution was mixed and filled into a vial.
Concentration of NH4+ ion was: 400 ppm / (100 * 20) = 0.200 ppm
The preparation of 0.8 ppm NH4+ ion in standard solution of six cations (std 2) 1.000 ml of the standard solution for six cations was transferred to a 500 ml flask.
The 500 ml flask was filled to volume with Milli-Q-water. The solution was mixed and filled into a vial.
Concentration of NH4+ ion was: 400 ppm / 500 = 0.800 ppm
The preparation of 4.0 ppm NH4+ ion in standard solution of six cations (std 3) 1.000 ml of the standard solution for six cations was transferred to a 100 ml flask.
The 100 ml flask was filled to volume with Milli-Q-water. The solution was mixed and filled into a vial.
Concentration of NH4+ ion was: 400 ppm / 100 = 4.000 ppm
The preparation of 0.4 ppm NH4+ ion in standard solution of six cations (std 5) 1.000 ml standard solution for six cations was transferred to a 1000 ml flask. The 1000 ml flask was filled to volume with Milli-Q-water.
The solution was mixed and filled into a vial.
Concentration of NH4+ ion was: 400 ppm / 1000 = 0.400 ppm
3.4.4 Preparation of 5 ppm Na+ ion standard solution Stock slution = 10 mM NaOH
MNa /M NaOH = 23.0 /40 = 0.575 %
10 mM NaOH= 0.4 g /1000 mL = 400 mg /l = 400 ppm 400 mg/l · 0.575 = 230 mg/l Na+ ions = 230 ppm Na+ ions 230 ppm ·X assumption ml= 5 ppm ·200 ml
X assumption = 4.35 ml NaOH
The 200 ml flask was filled to volume with Milli-Q-water. The solution was mixed and filled into a vial.
3.4.5 Preparation of ammonium ion standard solutions
The ammonium standard was bought from Alltech Associates where the concentration of ammonium ions was 997 ± 2 µg/ml. The purpose of using this standard was to quantify the ammonium ions in the sample.
Stock solution
1.00 ml of the NH4+ ion standard solution (997 ± 2 µg/ml) was transferred to a 100 ml flask.
The 100 ml flask was filled to volume with Milli-Q-water. The solution was mixed.
1.000 ml stock solution was transferred to a 250 ml flask. The 250 ml flask was filled to volume with Milli-Q-water. The solution was mixed and filled into a vial.
Standard 1
0.500 ml stock solution was transferred to a 100 ml flask. The 100 ml flask was filled to volume with Milli-Q-water. The solution was mixed and filled into a vial.
Standard 2
0.500 ml stock solution was transferred to a 50 ml flask. The 50 ml flask was filled to volume with Milli-Q-water. The solution was mixed and filled into a vial.
Standard 3
2.000 ml stock solution was transferred to a 100 ml flask. The 100 ml flask was filled to volume with Milli-Q-water. The solution was mixed and was filled into a vial.
Standard 4
2.000 ml stock solution was transferred to a 50 ml flask. The 50 ml flask was filled to volume with Milli-Q-water. The solution was mixed and was filled into a vial.
Standard 5
4.000 ml stock solution was transferred to a 50 ml flask.
The 50 ml flask was filled to volume with Milli-Q-water and mixed.
Standard 6
5.000 ml stock solution was transferred to a 100 ml flask. The 100 ml flask was filled to volume with Milli-Q-water. The solution was mixed and filled into a vial.
3.4.6 Preparation of sample (2004-2169) solution in Ad Hoc 345-NH4 cal 3
The sample which was examined was called “2004-2169” by PPL. See paragraph “2.2” for more information on the sample.
Since the concentration of the ammonium ion was unknown in the sample, the sample was diluted to different concentrations and tested by different programs. Once the NH4+ ions were separated and a stable peak was shown in the chromatograms, the sample concentration was fixed.
This fixed sample concentration was tested by two different programs
“Ad Hoc 345-NH4 cal 3 and Ad Hoc 345-NH4 cal 6” to obtain the optimal separation of ammonium ions.
20.00 mg (± 0.5 mg) of the sample was weighted into a 20 ml volumetric flask. The content of this flask was dissolved and filled to volume with Milli-Q-water. The solution was mixed and named “Sample 1a” with a concentration of 1 mg /ml.
1.00 ml of “sample 1a” was transferred to a 100 ml volumetric flask.
The 100 ml flask was filled to volume with Milli-Q-water and mixed (Sample 1b). This sample was used to determine ammonium ions.
The solution (Sample 1b) was filled into a vial.
3.4.7 Preparation of sample (2004-2169) solution in Ad Hoc 345-NH4 cal 6
10.00 mg (± 0.5 mg) of the sample was weighted into a 10 ml volumetric flask. The content of this flask was dissolved and filled to volume with Milli-Q-water. The solution was mixed (Sample 1a, it had the same name as in 3.4.6 because the concentration was 1 mg/ml).
1.00 ml of Sample 1a was transferred to a 100 ml volumetric flask.
The 100 ml flask was filled to volume with Milli-Q-water and mixed (Sample 1b). This sample was used to determine ammonium ions.
3.4.8 Isocratic elution by the program Ad Hoc 345 test 3-1
The development of the method began with isocratic elution trial. During this test the MSA concentration was constant. The target of this experiment was to determine whether an
isocratic elution should be used to separate the cations or not. The standard solution used in isocratic elution was std 2 from paragraph 3.4.3, which had a concentration 0.800 ppm standard solution for six cations.
Figure 7.1: The isocratic elution placed in the flow chart as described in paragraph “3.4 Procedure”
Some of the tests done by Dionex (the makers of the IC used in this project) were also tested in this project. The column size used at Dionex was 3 mm and in this project the column size was 2 mm. The isocratic program was called Ad Hoc 345 test 3-1, see Appendix 2.
The standard solution used in this experiment was standard solution of six cations. The concentration of ammonium ions in the standard solution of six cations was 400 ppm. The standard solution was diluted 500 times to get the suitable ammonium ion concentration for the experiment.
The standard concentration of NH4+ ions corresponds to: 400 ppm / 500 = 0.800 ppm. This standard concentration was named as “std 2”.
A sequence was prepared with two injections of blanks and four injections of “std 2”. See Appendix 2
The basic parameters were remained unchanged as in paragraph 3.3.2 Table 5 as listed below.
The tray/auto sampler temperature was 15 °C.
The MSA concentration was 18 mM during the time of 40 minutes. See table 7 and the program in Appendix 2
Table 7. The change in MSA concentration during time.
MSA (mM) 18 18 18
Time (min.) 0 35 40
3.4.9 Gradient elution by the program Ad Hoc 345 test 2
The development of the method continued with gradient elution by the program Ad Hoc 345 test 2, see Appendix 4.
Figure 7.2: The gradient elution placed in the flow chart as described in paragraph “3.4 Procedure”
The target of this experiment was to:
• Determine whether the gradient elution should be used to separate the cations or not. • Determine the appropriate concentration of standard solution for six cations by testing
0.2 ppm NH4+ ion in standard solution for six cations.
The standard solution used in this experiment was standard solution for six cations. See Appendix 1
The concentration of ammonium ions in the standard solution for six cations was 400 ppm. The standard solution was diluted 2000 times to get the suitable ammonium ion concentration for the experiment.
The standard concentration of NH4+ ions corresponds to: 400 ppm / 2000 = 0.200 ppm
A sequence was prepared with two injections of blanks and four injections of “std 1”. See the sequence in Appendix 4
The basic parameters were remained unchanged as in paragraph 3.3.2 Table 5 as listed below.
The tray/auto sampler temperature was 15 °C.
The MSA concentration was 1-35 mM during the time of 40 minutes. See table 8 and the program in Appendix 2
Table 8. The change in MSA concentration during time
MSA (mM) 1 5 10 15 20 25 30 35 Time (min.) 0 05 10 20 25 30 35 40
3.4.10 Gradient elution by the program Ad Hoc 345 test 2-3
This program was a further development of gradient elution (see the flow chart in 3.4) of program Ad Hoc 345 test 2, see Appendix 5.
The target of this experiment was to:
• Obtain better separated peaks by changing the gradient.
• Stronger concentration of standard solution for six cations to detect all ions (especially Mg2+ and Ca2+ ions)
The standard solution used in this experiment was standard solution for six cations. See Appendix 1
The standard concentration of standard solution for six cations used in this experiment was “std 2”. See 3.4.3
A sequence was prepared with two injections of blanks and eight injections of “std 2”. See the sequence in Appendix 5
The basic parameters were the same as in 3.3.2. The tray/auto sampler temperature was 15 °C. The MSA concentration (gradient) was changed more often during the time interval.
The MSA concentration was 3-50 mM during the time of 40 minutes. The gradient ended with 3 mM.
See table 9 and the program in Appendix 5.
Table 9. The change in MSA concentration during time
MSA (mM) 3 5 25 30 35 40 45 45 50 50 3 Time (min.) 0 3 10 13 15 20 23 25 30 35 40
3.4.11 Gradient elution by the two programs Ad Hoc 345 test-lena 1&2
The program Ad Hoc 345 test- lena 1 & Ad Hoc 345 test-lena 2 (see the flow chart in 3.4) were almost similar. Both programs began and ended with a MSA concentration about 20 mM. See Appendix 6
The target of this experiment was to:
• Detect and determine the peak (cation) in the blank.
• Obtain better separated peaks by changing the gradient, with two similar programs. • To detect Mg 2+ and Ca 2+ ions with a stronger concentration of standard solution for
six cations
The standard solution used in this experiment was: • Standard solution for six cations, see 3.2 • Na+ ion standard solution, 10 mM NaOH
The concentration of ammonium ions in the standard solution for six cations was 400 ppm. The standard solution was diluted 100 times to get the suitable ammonium ion concentration for the experiment.
The standard concentration corresponds to: 400 ppm / 100 = 4.00 ppm This standard concentration was named as “std 3”, see 3.4.3.
A 5.0 ppm Na+ ion standard solution was prepared as 3.4.4.
In this way the blank (Milli-Q-water) was spiked with 5.0 ppm Na+ ion standard solution.
See the sequence in Appendix 6
The basic parameters were remained unchanged as in paragraph 3.3.2 Table 5. The tray/auto sampler temperature was 15 °C.
Ad Hoc 345 test-lena 1: the time duration of 25 minutes. MSA gradient, see table 10
Table 10. The change in MSA concentration during time
MSA (mM) 20 20 40 20 20
Time (min.) 0 15 19 20 25
Ad Hoc 345 test-lena 2: the time duration of 30 minutes. MSA gradient, see table 11
Table 11. The change in MSA concentration during time
MSA (mM) 20 20 40 60 20 20
3.4.12 Gradient elution by the program Ad Hoc 345-NH4 cal-3
Program: Ad Hoc 345- NH4cal-3 (see the flow chart in 3.4 and Appendix 9) The target of this experiment was to:
• Obtain better separated peaks by changing the gradient.
• Establish a standard calibration diagram for determining the ammonium ion content of the sample D-Ala-NH2∙HCl.
• Determine the ammonium ion concentration in sample 2004-2169 (D-Ala-NH2∙HCl). The standard solution used in this experiment was:
• Standard solution for six cations, see 3.2 • NH4+ ion standard solution, see 3.2
The concentration of ammonium ions in the standard solution for six cations was 400 ppm.
The standard solution was diluted 1000 times to get the suitable ammonium ion concentration for the experiment. The standard concentration of NH4+ ions corresponds to: 400 ppm / 1000 = 0.400 ppm
To establish a standard calibration diagram for determining the ammonium ion content in the sample D-Ala-NH2∙HCl prepared four different concentrations of NH4+ ion (standard 1, 2, 3 & 4) from NH4+ ion standard solution. See 3.4.5
A standard calibration diagram received when the peak area of all four NH4+ ionsstandard solutions were plotted against the different concentration of NH4+ ions. See 5.1 and the diagram in figure 8 in 5.2.
To determine the ammonium concentration in sample 2004-2169 (D-Ala-NH2∙HCl) a sample solution as 3.4.6 was prepared.
See the sequence at Appendix 9
The basic parameters were the same as in 3.3.2. The tray/auto sampler temperature was 15 °C. MSA gradient, see table 12
Table 12. The change in MSA concentration during time
MSA (mM) 1 3 5 8 10 12 20 22 23 25 27 28 29 1 Time (min.) 0 3 7 10 12 13 21 23 26 30 35 37 39 43
3.4.13 Gradient elution by the program Ad Hoc 345-NH4 cal-6
In this experiment the eluent gradient was analysed by program Ad Hoc 345-NH4 cal-6 (see the flow chart in 3.4 and Appendix 11).
The target of this experiment was to:
• Obtain better separated peaks by changing the gradient.
• Establish a standard calibration diagram for determining the ammonium ion content in the sample 2004-2169 (D-Ala-NH2∙HCl).
• Determine the ammonium ion concentration in 2004-2169 (D-Ala-NH2∙HCl). • See if the ammonium ion content of the sample was lower at a higher
tray/auto-sampler temperature.
Figure 7.3: The method Ad Hoc 345-NH4 cal 6 placed in the flow chart as described in paragraph
“4.3 Procedure”.
The standard solution used in this experiment was: • Standard solution for six cations, see 3.2 • NH4+ ion standard solution, see 3.2