An Adaptive Assessment of the Flushing Flow Needs of the Lower
Poudre River, Colorado: First Evaluation
1 Robert T Milhous
Hydrologist. Fort Collins, Colorado 80526
Abstract. Adaptive assessment of a riverine system is a continual learning process and probably never reaches a state of full knowledge. Adaptive assessment also includes the principle that continuous adaptation of improved knowledge to the work at hand is the normal state of affairs. The application of adaptive assessment presented in this paper is a first step in an adaptive process that uses readily available discharge measurement summary data available for some gaging stations to determine the flushing flow needs of a river. The process presented is useful 1) when little money is available for a flushing flow study and 2) in guiding more extensive studies that might be done later in the adaptive process when additional or more detailed information may be needed. In this paper, discharge measurement summary data and limited field data were used to develop a relation between a substrate movement parameter and the discharge for a USGS gage on the Poudre River above Boxelder Creek just downstream from Fort Collins, Colorado. The relation substrate movement parameter was combined with a value of the substrate movement parameter critical for movement of sand and fines known from other studies to find the discharge in the Poudre River in the Fort Collins reach required to flush sand and fines from the river. The discharge - sediment transport parameter relation determined from the analysis is β = 0.000320 Q ^ 0.549 where Q is the discharge and β is the substrate movement parameter. From previous studies, the critical value of the substrate movement parameter is 0.021, resulting in a flushing flow calculated to be 2050 cfs. There are 32 years of record at the Fort Collins gage with 12 years where the channel was flushed and a current run of at least 7 years without flushing of the channel.
1. Introduction
Adaptive assessment of a riverine system begins with the central tenet that any assessment involves a continual learning process and probably never reaches a state of full knowledge about the riverine system. Adaptive assessment also includes the principle that continuous adaptation of improved knowledge is the normal state of affairs. Adaptive assessment is a repeating series of speculation, collaboration, testing, and learning. This dynamic cycle provides for continuous learning and adaptation to the emergent state of knowledge about the riverine system (McLain and Lee 1996, Walters 1997, Wikipedia 2007a, and Wikipedia 2007b).
The application of adaptive assessment presented in this paper is a process of using discharge measurement summary data available for some gaging stations to determine initial flushing flow needs of a river. The process presented is useful 1) when little money is available for a flushing flow study and 2) in guiding more extensive studies
1Retired Hydrologist, US Geological Survey
1812 Marlborough Court; Fort Collins, Colorado 80526 Phone: 970 484 9760 Email: rtm80526@yahoo.com
later in the adaptive process when additional information may be needed in the analysis to learn about the river.
This paper presents an analysis of the flushing flow needs of the Poudre River in the vicinity of Fort Collins, Colorado. The movement of fines and sand through a river is a natural process. If the streamflows are changed the riverine environment will change unless the transport capacity is adequate to continue moving the fines and sand. The flushing flows calculated in this paper are considered to be critical for the continued movement of the sand and fines with well recognized ecological benefits (see Bunn and Arthington, 2002, and Anderson et al., 2006)
2. Materials and Methods
The concepts and assumptions of this paper are:
1. Measurements made at gaging stations during the process of calibrating the discharge to river stage can be used to calculate the shear stress on the streambed.
2. Measurements of the surface bed material are relatively easy to make in many small to medium size rivers.
3. A substrate movement parameter (dimensionless shear stress) can be calculated as the ratio of the bed shear stress and the downward force of the bed
particles.
4. A relation between the substrate movement parameter and the discharge can be determined.
5. A critical value of the substrate movement parameter exists for the removal (flushing) of fines and sand from the stream channel.
An outline of the steps followed in the analysis follow. Details of the steps are presented in the various sections as they are applied.
1. Collect discharge measurement summary data for two gaging stations near Fort Collins (USGS-NWISWeb).
2. Analyze the velocity, width, and cross-sectional area data in the discharge measurement summary to determine a relation between streambed shear stress and the discharge.
3. Measure, or estimate, the median size of the bed-surface material.
4. Use results from step 2 and substrate median size (D50) to determine a substrate movement parameter for each data set.
5. Develop a relation between the substrate movement parameter and the discharge.
6. Select a critical substrate movement parameter.
7. Combine results from the previous steps to determine the discharge needed to flush sediment from the river channel.
Most of the analysis presented in this paper uses data for one station the Cache la Poudre River above Boxelder Creek, near Timnath, Colorado (USGS Station
06752280). The period of discharge record for the station is from 1979-10-01 to 2006-09-30. The common name of the river is simply ‘Poudre River’ and will be used in the rest of this paper. Data from a second station will be used to check the results from the first station and for time series analysis because of a longer record of streamflows. The second station is the Cache la Poudre River at Fort Collins, Colorado (06752260). The period of record for the Fort Collins gage is from 1975-04-08 thru 2006-09-30. There are abstractions and outfalls between the ‘Fort Collins’ and the ‘above Boxelder Creek’ gages. The intervening watershed area is mostly urban.
The data used in the analysis of flushing flow needs was obtained from the web (USGS-NWISweb) and is called ‘Surface-water: Measurements’. The ‘Surface-water: Measurements’ are summaries of the discharge measurements made to calibrate the discharge at the gage to the measured stage. The summaries include the average cross-sectional velocity at the time and location of the measurement, the width of the river, and the cross-sectional area. The measurements are not always at the same cross section. The average depth is calculated as the ratio of the measured cross-sectional area and the measured stream width.
3. Computational equations
There are three important equations in this paper. The first is Manning’s equation: 2 / 1 3 / 2 49 . 1 v R S n =
where v is the velocity, R is the hydraulic radius, S is the energy slope, and n is the Manning’s roughness.
The second is the equation for shear stress on a streambed: S
R γ τ=
where τ is the shear stress, γ is the unit weight of water, and the other terms are as above.
The third is the dimensionless shear stress equation:
(
Gs-1)
D50 γτ β =
where β is the dimensionless shear stress, Gs is the specific gravity of the bed sediment,
and D50 is the median size of the surface (armour) sediment on the stream bed.
In this paper the dimensionless shear stress is called a substrate movement
parameter to convey the idea that the objective is substrate movement in contrast to the more common use of dimensionless shear stress as a stability factor.
Combining these three equations and assuming the depth, d, is a reasonable approximation of the hydraulic radius give us:
(
)
⎥⎦⎤ ⎢ ⎣ ⎡ = 50 s 1/3 2 2 1 -G d 2.22 v n D βThere are five zones of sediment movement in gravel-bed rivers (Milhous, 2000 and 2003). These five zones are:
Substrate Movement
Zone Parameter
Lower Upper
Bound Bound
Fines and sand are stored: 0.009
Fines and sand moved: 0.009 0.021
Surface cleaning: 0.021 0.035
Movement of armour: 0.035 0.084
General movement of substrate: 0.084
The objective of a flushing flow is to have a flow with a substrate movement parameter of at least the lower bound of the surface-cleaning zone.
4. Hydraulic geometry at the gaging stations
The hydraulic geometry relations are a relation between discharge and velocity, discharge and width, and discharge and depth. The form of the relation is
b aQ
F =
where F is average velocity, average depth, or channel width, a and b are regression coefficients and Q is the discharge. In general, one is interested in the value of
exponent, b, for each factor, F.
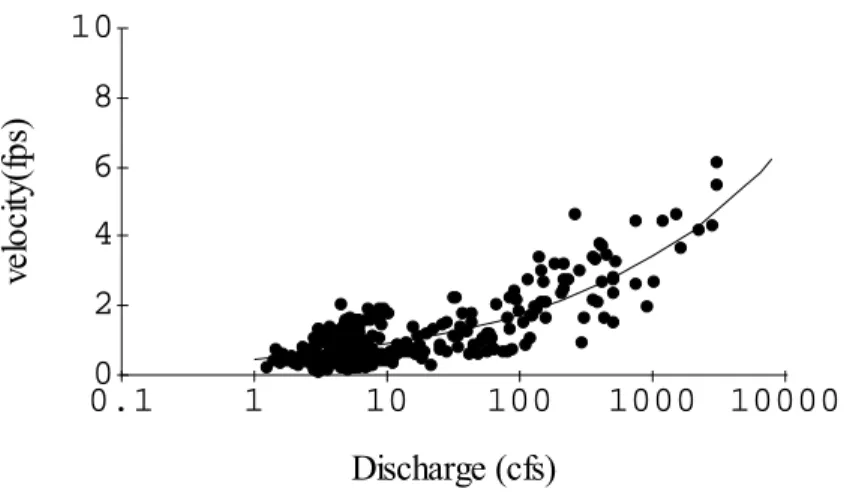
The velocity, depth and width relations for the Poudre River above Boxelder Creek are presented in Figures 1 through 3. A bridge exists just above the gage and higher flows have been measured using a bridge crane. A review of the data indicated that the bridge influences the data for discharges above 1000 cfs. Therefore, the data for 1000 cfs and below was used to determine the coefficients in the hydraulic geometry
0 2 4 6 8 10 0.1 1 10 100 1000 10000 ve lo ci ty (f ps ) Discharge (cfs)
Figure 1. Velocity versus discharge relation for the Poudre River above Boxelder Creek. Only the data
for discharges less than 1000 cfs was used to fit the relation shown to the data.
0 1 2 3 4 5 6 7 8 0.1 1 10 100 1000 10000 de pt h ( fee t) Discharge (cfs)
Figure 2. Depth versus discharge relation for the Poudre River above Boxelder Creek. Only the data for
discharges less than 1000 cfs was used to fit the relation shown to the data.
0 40 80 120 160 200 0.1 1 10 100 1000 10000 wi dt h ( fe et) Discharge (cfs)
Figure 3. Width versus discharge relation for the Poudre River above Boxelder Creek. Only the data for
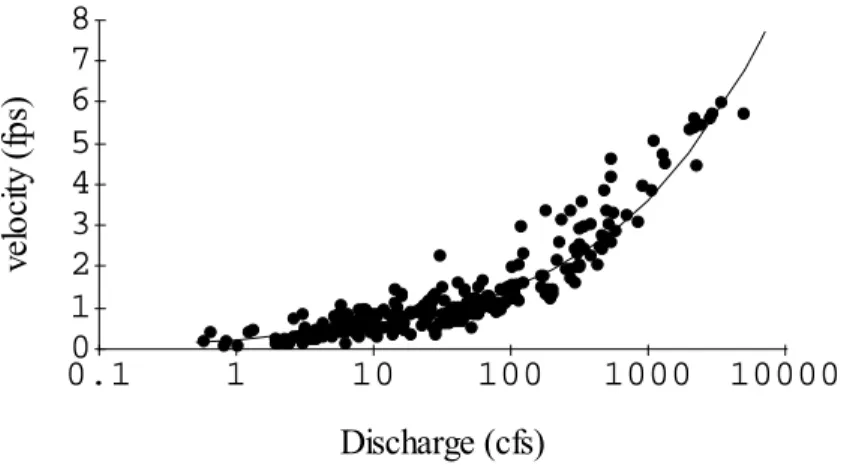
The velocity relation for the Fort Collins gage is presented as Figure 4. A bridge is close by and relations were fit to the data below 1000 cfs.
0 1 2 3 4 5 6 7 8 0.1 1 10 100 1000 10000 ve lo ci ty ( fp s) Discharge (cfs)
Figure 4. Velocity versus discharge relation for the Poudre River at Fort Collins. Only the data for
discharges less than 1000 cfs was used to fit the relation shown to the data.
A summary of the hydraulic geometry exponents is presented in Table 1.
Table 1. Hydraulic geometry exponents for the Poudre River in the vicinity of Fort Collins, Colorado.
Location Width Depth Velocity
at Fort Collins 0.42 0.18 0.39
above Boxelder 0.34 0.36 0.29
“theory” 0.50 0.27 0.23
mid-west US 0.26 0.40 0.34
(theory and mid-west US from Leopold, Wolman, and Miller, 1964) 5. Surface bed material (armour)
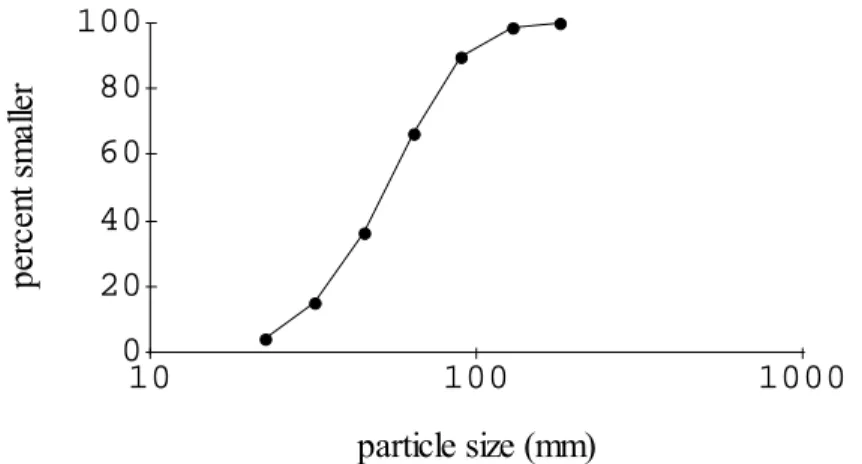
The armour of the river just downstream of the bridge was measured using the Wolman count procedure (Wolman, 1954). The results are presented in Figure 5. The median size of the armour (D50) was found to be 54 mm.
6. Flushing Flow Needs of the Poudre River
At this point there is only one unknown in the equation derived in the section on equations for the substrate movement parameters and that is the Manning’s roughness, n. The Manning’s roughness is related to the size of the surface bed material and the channel form. The Strickler equation was used to estimate the grain roughness; the equation is:
(
(1/6))
50 015 . 0 ' D n=where n’ is the roughness caused by the bed material. D50 is the median size of the
equation in Wigham (1970). The calculated value of n’ is 0.029 based on a D50 of 54
mm. The channel of the Poudre River is reasonably straight with some obstructions and channel variation. The form roughness was assumed to be 0.011. This value of form roughness is consistent with a table of form roughness values in Wigham. The sum of the bed-material roughness plus the form roughness gives a Manning’s roughness along the Poudre River of 0.040.
0 20 40 60 80 100 10 100 1000 per ce nt s m al le r particle size (mm)
Figure 5. Particle size distribution of the bed-surface material of the Poudre River just downstream of the
gage above Boxelder Creek. The measurements were made using the Wolman procedure (Wolman, 1954).
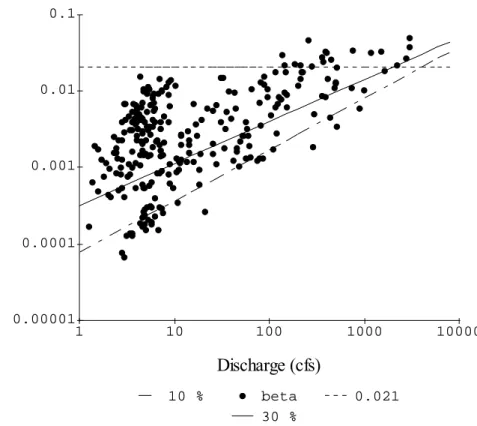
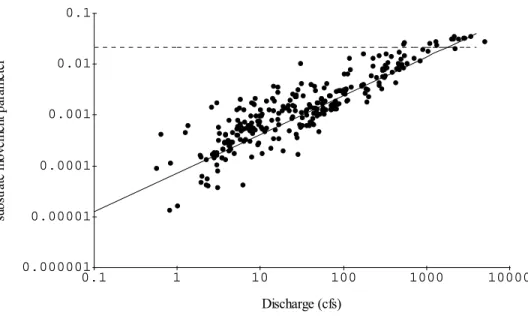
The substrate movement parameter was calculated for each data set available from the discharge measurement summaries. The results are the points in Figure 6. The points on Figure 6 are the calculated values of the substrate movement parameter where each point represents the velocity and depth for each discharge measurement. The data in Figure 6 plots is a scatter of points with a well-defined curve as a lower bound. Cade and Noon (2003) showed that this tends toward a wedge and is formed when there is more than one variable related to the dependent variable. One of the variables is the location of the cross section where the measurements are made. The goal of a hydrographer is to make good discharge measurements; as a result, the selection of a cross section by the hydrographer is probably one of the variables not related to
discharge causing the wedge in Figure 6. This is because the hydrographer will tend to select a measurement section deeper and narrower than average at low flows, wider (and more wadeable) at for some flows, and at the bridge for the higher flows. A second possible variable is changes in the gravel bar just downstream of the gage and a third is the impacts on the calculated substrate movement parameter of the bridge upstream of the gage.
The 10% quantile line fit to the data would be the lower bound on the substrate movement parameter for a specific discharge. This lower bound intercepts the line minimum value (0.021) of the substrate movement parameter needed to flush fines and sand at the discharge of 4120 cfs. A common fit of an equation to the data would be least squares regression between the substrate movement parameter and discharge. The intercept of the least squares fit and the 0.021 line is at a discharge of 1300 cfs.
If the intercept of the critical substrate movement parameter for flushing (0.021) and the 10% quantile line (4120 cfs) is used as the critical discharge in the Fort Collins
reach the fines and sand would certainly be flushed through the reach. The upper limit on the critical discharge represented by the 10% quantile line is probably too
conservative because most of the calculated points are to the left of the bounding relation at the higher discharges. Use of the least squares intercept (1300 cfs) is
probably an underestimate of the critical discharge because of the impact on the relation caused by the large values of the substrate movement parameter for discharges below 10 cfs that probably result from the way the hydrographer selects measurement cross sections. The relation most representative of the reach is probably somewhere between the least squares fit and the limit represented by the 10% quantile. For this reason, the 30% quantile line shown in Figure 6 was used as the relation giving more of an estimate of the expected conditions in the reach. The 30% quantile regression line intersects the 0.021 limiting substrate movement parameter at a discharge of 2050 cfs. The equation for this line is beta = 0.00032 discharge ^ 0.55. The discharge selected as critical for the flushing of fines and sand from the Poudre River in the vicinity of Fort Collins is then 2050 cfs.
The results are sensitive to the assumption of the value of the Manning’s roughness and to the selected level of the quantile regression. A sensitivity analysis was made and the results presented in Figure 7. The roughness is probably not larger than 0.042 (form roughness of 0.013) in Fort Collins reach and the best quantile regression value is probably 30% which means the lower limit on the flushing flow is 1720 cfs. The smallest value of the flushing flow is probably 0.032, which means the upper level of a flushing flow is probably 4620 cfs. A flushing flow need of 2050 cfs and limits on the expected value of 1720 -4620 cfs is a good initial estimate of the flushing flows needed in the Fort Collins reach of the Poudre River.
The results for the above Boxelder location were tested using the discharge
summary data for the gage upstream at Fort Collins (Figure 8). The roughness used was 0.040. The substrate movement parameter is 0.021 at a discharge of 1720 cfs for the 30% quantile regression line.
7. Frequency and Strength of Flushing Flows
How frequent do flushing flows occur? And how strong are the flushing flows? These are questions that are worth investigating.
An index to the strength of the flushing flow (FSI) was used to look at both frequency and magnitude of the flushing flow. The index (Milhous, 1998) is:
∑
− = ( 2) qref q qcrt q FSIwhere q is the daily discharge, qcrt is the minimum discharge required for flushing (2050 cfs) and qref is a reference discharge used to make FSI dimensionless (1000 cfs). The summation is over all days in a water year where q > qcrt.
The flushing flow strength index was calculated for the daily data at the Fort Collins gage of the Poudre River because that gage has the longest record of the two gages in the Fort Collins reach. The results presented in Figure 9 show that flushing flows do occur in the Fort Collins with long periods (7-8 years) with little flushing. The
1999 but the cumulative effects of more days at high flow make 1983 the peak in terms of flushing. 0.00001 0.0001 0.001 0.01 0.1 1 10 100 1000 10000 su bs tr at e mo ve me nt p ar ame te r Discharge (cfs) 10 % beta 0.021 30 %
Figure 6. The substrate movement parameter (beta) as related to discharge for the Poudre River above
Boxelder Creek. The solid line is the results of quantile regression where 30% of the data is below or on the line. The horizontal lines are for a critical substrate movement parameter of 0.021. The lowest line
(dashed) is the 10% quantile line.
0 1000 2000 3000 4000 5000 6000 0.028 0.032 0.036 0.040 0.044 0.048 cr iti cal di sc ha rg e ( cf s) Manning's roughness
Figure 7. Comparison of the critical discharge for flushing of fines and sand from the Poudre River
above Boxelder Creek for alternative assumptions of the Manning’s roughness and for a quantile regression relation of 30%.
0.000001 0.00001 0.0001 0.001 0.01 0.1 0.1 1 10 100 1000 10000 su bs tr at e mo ve me nt p ar ame te r Discharge (cfs)
Figure 8. The substrate movement parameter as related to discharge for the Poudre River at Fort Collins.
The line is the results of 30% quantile regression where 30% of the data are below or on the line.
0 50 100 150 200 250 300 350 400 450 1975 1985 1995 2005 F lus hi ng F lo w S tr eng th I nd ex Water Year
8. Discussion
In this paper an adaptive analysis approach has been used to evaluate the flushing flow needs of the Poudre River in the Fort Collins reach. The approach used gaging station data to show that the flushing flow needs are 2050 cfs with reasonable bounds of uncertainty of 1720-3550 cfs.
The process of using limited data can give a useable estimate of flushing flows when time and/or money prevents a more detailed study. A detailed study would use the same principles but a much improved data set. The general concept of using adaptive assessment in the analysis of fluvial systems should be considered in any research or in the decision process related to water management approach when resources are limited and there is still a needed to have some idea of the flushing flow needs.
Acknowledgements. This paper was completed prior to retirement of the author from the U.S. Geological Survey.
References
Cade, B.S. and B.R. Noon. 2003. A gentle introduction to quantile regression for ecologists. Frontiers in Ecology and Environment 1(8):412-420.
Leopold, L.B , M.G. Wolman, and J.P. Miller. 1964. Fluvial processes in geomorphology. W.H. Freeman and Company. San Francisco. 522 pages.
McLain, R. J. and R.G. Lee. 1996. Adaptive Management: Promises and Pitfalls. Environmental Management Vol. 20, No. 4, pp. 437-448
Milhous, R.T. 1998. Modelling of Instream Flow Needs: The Link Between Sediment and Aquatic Habitat. Regulated Rivers: Research & Management. Volume 14. pp 79-94. Milhous, R.T. 2000. Numerical Modeling of Flushing Flows in Gravel-Bed Rivers. in
Klingeman,P.C., R.L. Beschta, P.D. Komar, and J.B. Bradley, editors. Gravel-Bed Rivers in the Environment. Water Resources Publications. Littleton, Colorado. pages 579-608. Milhous, R.T. 2003. Reconnaissance – Level application of physical habitat simulation in the
evaluation of physical habitat limits in the Animas Basin, Colorado. U.S. Geological Survey. Fort Collins Science Center, Fort Collins, CO: Open File Report 03-222. 16 p. Walters, C. 1997. Challenges in adaptive management of riparian and coastal ecosystems.
Conservation Ecology [online]1(2):1. Available from the Internet. URL: http://www.consecol.org/vol1/iss2/art1/
USGS-NWISWeb. 2007. US Geological Survey National Water Information System: Web Interface. Accessed various times in January 2007.
Wigham,J.M. 1970. Section VIII. Peak Flow - Rainfall Events. in Gray, D.M. Editor in Chief. Handbook on the Principles of Hydrology. National Research Council of Canada. Reprinted in 1973 by Water Information Center. Port Washington, New York.
Wikipedia. 2007a. Adaptive management.
http://en.wikipedia.org/wiki/Adaptive_Management downloaded 23 January 2007 Wikipedia. 2007b. Adaptive Software Development.
http://en.wikipedia.org/wiki/Adaptive_Software_Development downloaded 23 January 2007
Wolman, M.G. 1954. A method of sampling course river-bed material. American Geophysical Union Transactions v. 35, no 6, pp 951-956.