Faculty of Veterinary Medicine and Animal Science Department of Animal Nutrition and Management
Field study of the drought’s impact on
feeding strategy and biological parameters in
early lactation dairy cattle
Fältstudie av torkans inverkan på utfodringsstrategi och
biologiska parametrar hos mjölkkor i tidig laktation
Field study of the drought’s impact on feeding strategy and
biological parameters in early lactation dairy cattle
Fältstudie av torkans inverkan på utfodringsstrategi och biologiska parametrar hos mjölkkor i tidig laktation
Mikaela Würtz
Supervisor: Anna Edvardsson Rasmussen, Swedish University of Agricultural Sciences, Department of Animal Nutrition and Management
Assistant Supervisor: Kjell Holtenius, Swedish University of Agricultural Sciences, Department of Animal Nutrition and Management
Examiner: Sigrid Agenäs, Swedish University of Agricultural Sciences, Department of Animal Nutrition and Management
Credits: 30 credits
Level: A2E
Course title: Degree project in Animal Science
Course code: EX0872
Course coordinating dep: Department of Animal Breeding and Genetics
Programme: Master’s Programme in Agriculture – Animal Science
Place of publication: Uppsala
Year of publication: 2019
Cover picture: Mikaela Würtz
Online publication: https://stud.epsilon.slu.se
Keywords: dairy cattle, drought, energy balance, feeding, metabolism
Swedish University of Agricultural Sciences
The summer of 2018 was unusually warm and dry. For animal production, this resulted in poor pastures, reduced harvests of crops, such as roughage and grains, and increased risk for heat stress in the animals. The drought led to problems as in shortage of animal feed, which made the feeding of dairy cattle difficult. This field study was performed to research how Swedish dairy farmers handled the drought and feed situation. Eleven farms were visited, and the farmers were asked questions from a questionnaire, regarding whether they experienced that they were affected by the drought and feed situation or not, questions about the feeding strategy on the farm, if alternative feedstuffs were used and if the farmers had been required to sell or slaughter animals because of the feed situation. The farmers had different experi-ences of the drought where some of them tried feeding alternative feedstuffs as bean straw, peas, whole crop silage, silage from fallow land or a complementing compound feed. Some farmers needed to slaughter or sell animals due to the lack of feed. In total, 59 primiparous cows in their early lactation were included. The exam-ined cows were of the breeds Swedish Holstein (SH), Swedish Red (SRB) and Jersey cattle. In addition to the questionnaire, feed samples were collected from the roughage used, to see if relations could be found between the result of feed samples and other studied parameters. Milk- and blood samples were collected from 3-10 cows from each farm. These cows were also body condition scored. It was studied if a relation could be found between any experienced problems caused by the feed situation, and the studied biological parameters. These parameters were levels of myristic acid (C14:0), palmitic acid (C16:0), stearic acid (C18:0) and oleic acid (C18:1 cis-9) in milk, and levels of b-hydroxybutyrate (BHB), non-esterified fatty acids (NEFA), glucose, insulin and insulin-like growth factor 1 (IGF-1) in blood plasma, body conditions and feed samples. The feed samples were analysed for contents of dry matter (DM), metabolizable energy (ME), ash, crude protein (CP) and neutral detergent fibre (NDF). The majority of the examined cows (93%) had body conditions between 3.0 and 4.0 of a scale of 1-5, where 1 is emaciated and 5 is obese. Approximate energy balances on herd level were estimated via the software IndividRAM which showed that the herds were between 92 and 109%. Relations were found between some of the studied parameters, with different parameters identified on the different farms. Statistical analyses showed significant correlations between C14:0 and C18:1 cis-9; NEFA and C18:1 cis-9; BHB and C18:1 cis-9; BHB and C14:0; BHB and glucose; BHB and NEFA. An analysis of variance (ANOVA) showed significant differences between the farms regarding the levels of the milk fatty acids C14:0, C16:0, C18:0, plasma components BHB, NEFA, glu-cose, IGF-1 and body conditions.
Keywords: dairy cattle, drought, energy balance, feeding, metabolism
Abstract
Sommaren 2018 var ovanligt varm och torr. Detta resulterade bl.a. i försämrade beten, minskade skördar av grödor, såsom grovfoder och spannmål. Torkan orsa-kade problem som exempelvis djurfoderbrist, vilket försvårade utfodringen av mjölkkor. Denna fältstudie gick ut på att undersöka hur svenska mjölkbönder hante-rat torkan och fodersituationen. Elva gårdar besöktes och lantbrukarna fick frågor från en frågeenkät som handlade om huruvida de påverkades av torkan och fodersi-tuationen eller inte, frågor om utfodringsstrategin på gården, om alternativa medel använts och om lantbrukarna behövt sälja eller slakta djur till följd av foder-situationen. Lantbrukarna hade olika upplevelser av torkan, där en del testade att utfodra alternativa fodermedel som bönhalm, ärter, helsädesensilage, ensilage från trädad mark eller ett kompletterande pelleterat foder. En del av lantbrukarna behöv-de slakta eller sälja djur till följd av fobehöv-dersituationen. Totalt ingick 59 kor som var i tidig laktation och nyligen fått sin första kalv. De kor som undersöktes var av raser-na Svensk Holstein (SH), Svensk rödbrokig boskap (SRB) och Jersey-boskap. Utö-ver frågeenkäten togs foderprov från det grovfoder som användes för att se om samband fanns mellan foderprovsanalysen och andra studerade parametrar. Mjölk- och blodprover togs från 3-10 kor från varje gård. Dessa kor hullbedömdes även. Det undersöktes om samband kunde finnas mellan eventuella upplevda problem på grund av fodersituationen, och de studerade biologiska parametrarna. Dessa para-metrar var koncentrationer av myristinsyra (C14:0), palmitinsyra (C16:0), stearin-syra (C18:0) och oljestearin-syra (C18:1 cis-9) i mjölk, och koncentrationer av blod-plasmakomponenterna b-hydroxybutyrat (BHB), icke-esterifierade fettsyror (NEFA), glukos, insulin och insulinliknande tillväxtfaktor (IGF-1), hull och foder-prover. De grovfoderprover som togs analyserades för torrsubstans, innehåll av smältbar energi (ME), aska, råprotein (CP) och fiber (NDF). Majoriteten av de undersökta korna (93%) hade hull mellan 3,0 och 4,0 på en skala från 1-5, där 1 är undernärd och 5 är överviktig. Ungefärliga energibalanser på besättningsnivå upp-skattades med datorprogrammet IndividRAM som visade att besättningarna var mellan 92 och 109%. Samband fanns mellan en del parametrar. Vilka parametrar som hade ett samband varierade mellan gårdarna. Statistiska analyser visade signi-fikanta korrelationer mellan C14:0 och C18:1 cis-9; NEFA och C18:1 cis-9; BHB och C18:1 cis-9; BHB och C14:0; BHB och glukos; BHB och NEFA. En variansa-nalys (ANOVA) visade signifikanta skillnader mellan gårdarna gällande koncent-rationer av mjölkfettsyrorna C14:0, C16:0, C18:0, plasmakomponenterna BHB, NEFA, glukos, IGF-1 och hull.
Nyckelord: energibalans, metabolism, mjölkkor, torka, utfodring
Sammanfattning
Abbreviations 6
1 Introduction 8
1.1 The drought and its consequences 8
2 Literature study 9
2.1 Alternative feedstuffs and possible solutions 9
2.2 Milk fatty acids 9
2.2.1 Milk fatty acids as markers of metabolic status 10
2.3 Blood plasma components 10
2.3.1 Energy balance 11
2.4 Body condition 11
2.5 Impact of feeding on blood plasma components and milk fatty acids 12
2.6 Aims of the study and questions 13
3 Materials and methods 14
3.1 Experimental design 14
3.2 Questionnaire 16
3.2.1 Estimation of energy balances 17
3.3 Feed analysis 17
3.4 Milk samples 18
3.5 Blood samples 18
3.6 Body condition score 18
3.7 Statistical analyses 19
4 Results 20
4.1 Questionnaire’s result 20
4.2 Feed analyses 23
4.3 Milk analyses 24
4.4 Blood plasma metabolites and hormones 25
4.5 Body condition 29
4.6 Energy balance on herd level 30
4.7 Correlations between milk fatty acids and blood plasma components 30
4.8 Differences between the farms 31
5 Discussion 32
5.1 The eleven farms 32
5.2 Limitations and potential errors of the study 35
6 Conclusions 37
References 38
AMS Automatic milking system BCS Body condition score BHB b-hydroxybutyrate CP Crude protein DIM Days in milk DM Dry matter DMI Dry matter intake EB Energy balance FA Fatty acid
IGF-1 Insulin-like growth factor 1 IVOMD In vitro organic matter digestibility LCFA Long-chain fatty acids
ME Metabolizable energy NDF Neutral detergent fibre NEB Negative energy balance NEFA Non-esterified fatty acids OMD Organic matter digestibility PMR Partly mixed ration
SH Swedish Holstein SRB Swedish Red TMR Total mixed ration
1.1 The drought and its consequences
The summer of 2018 was one of the warmest and driest summers in Sweden in a long time. In 2017 the summer was cold and rainy (SMHI, 2018) with low rough-age crops, which caused problems when the summer 2018 did not enable farms to compensate for the low crop yields the previous year. The last time there was such a cold and rainy year with a following warm and dry summer in Sweden, was in year 1867 and 1868 respectively (SMHI, 2017). In 2018, there was only 50-75% of the usual rainfall in the middle and south areas of Sweden (SMHI, 2018). Pro-duction of cereals and roughage was markedly hampered in the driest areas where the groundwater degree was low. A warm and dry weather condition can also cause slow regrowth of pasture. An estimation made in September 2018 showed that many farmers only had been able to harvest 50% of the production compared to earlier harvests. This consequently led to a shortage of feed e.g., which resulted in difficulties in feeding of dairy cattle for some farmers around the country (LRF, 2018). In August and September, the precipitation finally increased in many parts of Sweden (SMHI, 2019), which contributed to regrowth of the pastures (LRF, 2018). The drought and its consequences are important to investigate since it is a current topic and the feeding is very crucial on dairy farms.
2 Literature study
2.1 Alternative feedstuffs and possible solutions
When the pasture is dry and there is a poor growth, an alternative is to move the animals to forests, where they can eat brushwood, fern and leaves (Dahlström et al., 2018). Fallow land, which is arable land that is resting from production of crops, can be harvested, ensilaged and fed to the cows as well (Jordbruksverket 2018). However, this is not a suitable feeding strategy for high-producing cows and therefore, farmers may need to buy alternative feedstuffs, either as a comple-menting feed or as a replacement. As Växa Sverige, farmers’ cooperative advisory service and cow database, states on their website, cereals and legumes can be har-vested as whole crops. Växa Sverige also underline the importance of accuracy in the ensiling process, especially when ensiling smaller amounts of roughage. Grass from fallows may be more suitable for older animals, dry cows and suckler cows. A long pasture period is advantageous to save feed, which can be possible when the pastures are good.
To be prepared for further dry summers where the result can be a lack of feed, it can be positive to arrange a storage of larger quantities of roughage. The animal owners may need more forward planning for slaughter of animals to avoid queues (Växa Sverige, 2018). Otherwise farmers may need to cull animals due to lack of feed which can result in lowered prices on the market for slaughter animals (Shrum et al., 2018).
2.2 Milk fatty acids
Approximately 50% of the milk fatty acids (FA) are produced in the mammary gland. The remaining FA are preformed and comes from triglycerides in circulat-ing chylomicrons or very low density lipoproteins (Sjaastad et al., 2010). The milk
fat in ruminants mostly consists of triglycerides. An approximately distribution of them is that 70% are saturated, 25% monounsaturated, 2.3% polyunsaturated and 2.7% trans FA (Månsson, 2008). The saturated and long-chained FA are mostly myristic acid (C14:0), palmitic acid (C16:0) and stearic acid (C18:0) (Mansbridge & Blake, 1997), where C16:0 stand for around one third of the FA taken up from the blood. Most of the remaining preformed FA are carbon chain length of 18 such as C18:0, oleic (C18:1 cis-9) and linoleic acid (Sjaastad et al., 2010).
2.2.1 Milk fatty acids as markers of metabolic status
In a study by Jorjong et al. (2014) it was investigated if milk FA could be used as indicators to discover detrimental levels of non-esterified fatty acids (NEFA) in blood plasma, where ³0.6 mmol/L was defined as threshold. A conclusion was that milk fat C18:1 cis-9 could be useful to early discover detrimental blood plas-ma levels of NEFA in dairy cattle in the second week of lactation, since increased level of C18:1 cis-9 in milk was positively correlated with an increase in NEFA in blood plasma. However, it was also concluded that the positive correlation be-tween NEFA and milk fat C18:1 cis-9 concentrations was moderate and that more research is needed (Jorjong et al., 2014).
Martin et al. (2015) performed a study where a part of it was to investigate if milk FA could be possible as predictors of onset of luteal activity (OLA). It was found that cows with late OLA were in deeper negative energy balance (NEB). These animals also had a lower proportion of the milk FA C14:0 and C16:0, compared to the early OLA group. The concentrations of C18:0 and C18:1 cis-9 were lower in the early OLA group compared to the late (Martin et al., 2015).
2.3 Blood plasma components
The metabolism is reflected by metabolites and hormones in blood plasma. The monosaccharide glucose is a major nutrient for the cells in the body. Glucose is utilized for energy or stored as glycogen in liver and skeletal muscle cells and can also be converted to triglycerides in the liver. Insulin is the most important hor-mone in the regulation of the metabolism of glucose, amino acids and lipids. b-hydroxybutyrate (BHB) is produced in the liver as a result of partial oxidation of FA in virtually all mammals but in ruminants BHB can also be produced in the rumen epithelium by oxidation of butyrate produced by fermentation of dietary carbohydrates in the rumen. Insulin-like growth factor 1 (IGF-1) is a peptide that
mediates the growth-stimulating effect of growth hormone, a hormone which has a direct effect on the metabolism of tissues in the body (Sjaastad et al., 2010).
2.3.1 Energy balance
The concentration of NEFA partly reflects the metabolic state and degree of mobi-lization of adipose tissue in dairy cattle. High levels of NEFA is related to a NEB (Pullen et al., 1989). It is well known that deep NEB the period after calving can increase the risk for postpartum diseases (Suthar et al., 2013). The degree of NEB is characterized by the increase of NEFA and BHB and decrease of glucose and IGF-1 level in blood plasma (Esposito et al., 2014). At the onset of lactation, glu-cose synthesis by the liver increases and gluglu-cose oxidation by peripheral tissues decreases. These are important metabolic adaptions in this phase. After the parturi-tion the cow is usually in a NEB as a result of the transiparturi-tion from pregnancy to lactation. The energy demands that are needed for milk production normally out-paces the energy intake (Overton, 2003). The lipolysis occurs to compensate the energy requirements, which results in a release of NEFA into the bloodstream (Herdt, 1997). The mobilization of NEFA from adipose tissue increases after par-turition (Bauman & Currie, 1980). When the cow is in NEB the liver becomes refractory to growth hormone (GH) and a decrease of the level of IGF-1 occur, which is further related to a decrease of insulin (Bell et al., 2000).
2.4 Body condition
Body condition scoring (BCS) of cattle is an important management tool since it may reflect the welfare of the animal. An optimum calving body condition is thought to be 3.0 to 3.25 of a 5-point scale which is usually applied in BCS of cattle. According to Roche et al. (2009), a low BCS is in relation to a reduced production and reproduction, while a BCS of ³3.5 can be associated with a reduc-tion of dry matter intake (DMI) and milk producreduc-tion and increased risk of meta-bolic disorders. As mentioned in the study by Roche et al. (2009), cows that are in 50 to 100 days after calving usually have a lower body condition than the optimal. It is also stated that the impact of management and feeding on early post-calving (1-4 weeks post-calving) BCS loss is small until after the natural period of insulin resistance and when the somatotropic axis is activated (Roche et al., 2009).
2.5 Impact of feeding on blood plasma components and
milk fatty acids
In a study by Obese et al. (2018), the diet’s impact on some blood plasma metabo-lites in early lactation cows was investigated. It was shown that the intake of dry matter (DMI) and metabolizable energy (ME) density had an impact. Four differ-ent diets, differing in DMI and ME contdiffer-ent, were fed to the cows. One with low DMI and ME (called LL), one with low DMI and high ME (called LH), one with high DMI and low ME (called HL) and one with high DMI and high ME (HH). A conclusion was that the levels of BHB, glucose, IGF-1 and urea in blood plasma were affected by the different diets. The BHB concentration was higher in the cows consuming the HL and LL diets, compared to the other diets. With the HH and LH diets, the concentration of glucose was higher. The level of IGF-1 was higher with the HH diet. The cows that were eating the LL diet had higher urea concentrations in the blood plasma. However, the concentrations of NEFA were similar in the four diets (Obese et al., 2018).
In a study by Douglas et al. (2007) periparturient cows were fed different diets; two control diets, one fed to meet 120% of the energy requirements (called CA) and one fed to meet 80% of them (called CR). The third diet was supplemented (called S) with mostly saturated free FA. The diet contained 47% of C16:0, 36% of C18:0 and 14% of C18:1 cis-9 and were fed to meet 120% of the requirements. The last diet (called U) was similar to the diet with saturated free FA (called S) but where the cows additionally were abomasally infused with soybean oil (which would make the diet plus infused fat meet 120% of requirements). It was conclud-ed that the groups fconclud-ed S, U or CR had higher concentrations of NEFA in blood plasma before calving. The cows fed U had decreased concentrations of BHB after calving. Moreover, the cows consuming diet U had lower levels of 16:0 and 18:0, compared to the cows fed diet S. Prepartal feed restriction had an impact on long-chain fatty acids (LCFA) profiles (Douglas et al., 2007).
2.6 Aims of the study and questions
This study aimed to investigate how Swedish dairy farmers managed the drought and lack of feed during and after the summer of 2018 and give examples of alter-native feedstuffs that were used. Furthermore, the study aimed to analyse if rela-tionships could be found between the farmers’ experiences of the drought and feed situation, based on the answers of a questionnaire, and the estimated energy bal-ances (EB) on herd level, the nutrient composition of used feeds, levels of some blood plasma components and milk FA, and body conditions of early lactating primiparous cows. In addition, it was investigated if certain milk FA reflected the metabolism of primiparous cows in early lactation.
Questions to be answered are following:
• How was the drought and feed situation handled on the eleven included dairy farms? Which alternative feedstuffs were used?
• Where there any relationships between the farmers’ experiences of the drought and feed situation and the actual EB on herd level, nutrient com-position of used feeds, levels of blood plasma components and milk FA, and body conditions of the examined primiparous cows?
3.1 Experimental design
Eleven farm visits were performed during September and October 2018, where information regarding the feeding strategies were obtained, and feed-, blood- and milk samples were collected. The farms that were available for the present study were linked to a research project focusing on tools to identify optimal calving in-terval in individual primiparous cows. Thus, only primiparous cows in their 3rd to
28th day in milk were included in the blood- and milk sampling and BCS.
In total, 59 primiparous cows were included. The participating farms had dairy cattle of the breeds Swedish Red (SRB), Swedish Holstein (SH), and a few cross-breds, Jersey cattle and Swedish mountain cattle (SMC). The examined cows were of the breeds SRB, SH and Jersey cattle. Eligible farms were those that fulfilled the criteria stated in Table 1. The farms had 100 or more dairy cows and the herds were included in Swedish milk recording system. On the farms the milk yields of the cows were measured daily to keep records of the production. All of the farms had a milk production of 9000 kg ECM or more. The farms had loose-housing systems. Lastly, the mean value of calving interval was 14 months or less, the reproduction index was >22 (2017) and gestation percentage on the farms was 31-90% (2017). Milk- and blood samples were collected, and body condition was scored from between three to ten animals from each farm. The number of exam-ined cows from each farm differed because of the variation of number of primipa-rous cows in early lactation on the farms at that time. In addition to this a feed sample was taken from the roughage that was used on each farm.
Information about the farms in the present study, regarding milking- and feeding systems are presented in Table 2. The number of lactating cows on the farms in September 2018, number of examined cows and proportion of breeds of all the cows on the farms are shown in Table 3.
Table 1. Criteria for the farms to participate in the study Criteria
At least 100 dairy cows
The herd is included in Swedish milk recording system Continuous measuring of milk yield
A milk production not less than 9000 kg ECM Loose-housing
Mean value of calving interval <14 months
Reproduction index >22 (2017), gestation percentage 1st calf 31-90% (2017)
Table 2. Information about the farms regarding if they had an automatic milking system (AMS) or
milking parlour as milking system, and whether the feed was a total mixed ration (TMR) or partly mixed ration (PMR)
Farm Milking system TMR/PMR
A AMS PMR B Milking parlour PMR C AMS PMR D AMS PMR E AMS PMR F AMS PMR G AMS PMR H AMS PMR I Milking parlour TMR J AMS PMR K AMS PMR
Table 3. Information about the farms regarding number of lactating cows at that time (both
primipa-rous and multipaprimipa-rous cows), number of cows examined in the present study and proportion of breeds (SH, SRB, crossbreed, Jersey cattle or SMC)
Farm Lactating cows Examined cows SH SRB Crossbr. Jersey cattle SMC A 124 4 52% 27% 21% B 103 4 16% 81% 3% C 120 3 76% 29% 5% D 228 10 77% 19% 4% E 139 8 46% 3% 51% F 210 4 54% 32% 14% G 149 8 31% 23% 26% 19% 1% H 121 6 98% 2% I 116 4 68% 6% 26% J 134 3 5% 55% 40% K 203 5 92% 3% 5%
3.2 Questionnaire
On the visits the farmers were asked questions concerning the feeding strategy on the farms and if this summer’s drought had an impact on the feeding and choice of feedstuffs. The farmers were asked questions from a questionnaire, as a semi-structured interview. The questions are presented in Table 4. Regarding the feed-ing strategy, the farmers were asked if they experienced if they were affected by the drought and feed situation. They were also asked if changes in choices of feedstuffs had been carried out. The questions 4, 5, 6 and 8 were included to col-lect information for the software IndividRAM, that was used to estimate energy balances on herd level.
Table 4. Questions asked on the farm visits, regarding the feeding strategy applied on the farms
1. Were you required to make changes in the feeding strategy because of the drought and feed situation?
2. If yes; What alternative feedstuffs do you feed the cows?
3. Have you sold or slaughtered animals as a consequence of the drought?
4. How much and what kind of roughage is fed to the herd per day (kg or kg DM)? 5. How much and what kind of concentrate is fed to the herd per day (kg)?
6. How much and what kind of minerals is fed to the herd per day (g)? 7. Are animals fed a TMR or PMR?
3.2.1 Estimation of energy balances
Information regarding the milk production (milk delivery amount and contents of fat, protein and urea) on the farms was collected from the receipt from the latest milk delivery. The concentrates, cereals, roughages and minerals used on the farms and the amount of each of them fed to the herd per day were noted. Moreo-ver, information regarding residues on the feed tables and the amount of milk con-sumed on farm were collected. This information was then applied in the software IndividRAM, a Nordic feed evaluation system. With this information IndividRAM estimates approximate EB for the herds (IndividRAM, 2018).
3.3 Feed analysis
From each farm, a feed sample of approximately one kilogram was taken from the roughage or feed used. These samples were desirably collected from the feed mix-er or close to the feed table, but not directly from the feed table to avoid that the feed components were separated by the cows which would generate unrepresenta-tive samples. The samples were collected by hand (with protecting plastic gloves on) and put in plastic bags that were carefully sealed. During the transport from the farm to the lab the samples were chilled in a portable cooler (+1 to +8°C) and thereafter stored in a freezer (-22°C) at the department for approximately 6 weeks. The roughage was analysed on the department’s laboratory, for DM density, con-tent of ME, neutral detergent fibre (NDF), crude protein (CP) and ash. To calcu-late the moisture and DM content, an in-house method was used. For the NDF analysis, a standard operation procedure, amylase neutral detergent fibre method (aNDFom) was applied (Chai & Udén, 1998). For the determination of total nitro-gen per CP, the Kjeldahl method was used. The rumen In Vitro Organic Matter Digestibility (IVOMD) was determined with a standard operation procedure where the sample is incubated with rumen fluid-buffer mixture. With this method the IVOMD can be calculated and the ME content and organic matter digestibility (OMD) can be estimated (Lindgren, 1979). Ash percentage were determined via the AOAC official method 942.05 (Jennische & Larsson, 1990).
3.4 Milk samples
The milk samples were collected at different times of the day regardless the time of milking (in the AMS or milking parlour) and feeding. From each examined individual a milk sample was collected from one quarter of the mammary gland. First the teat was disinfected, and 3-4 squirts of milk were discarded before milk was collected, by hand-milking, into test tubes with bronopol (2-bromo-2-nitropropane-1,3-diol). Samples were directly cooled in a portable cooler (+1 to +8°C) during transport and later stored in a refrigerator (+4°C) at the laboratory at the Department of Animal Nutrition and Management until the analysis was per-formed. The analysis was completed within seven days from sampling. The milk samples were carefully warmed-up to 38°C before analysis and then analysed for fat content and FA composition, which was performed with the FTIR-spectroscopy (Fourier Transform Infrared Spectroscopy) analysis with a Combi-Scope FTIR 300. The fat content was used to calculate gram FA (C14:0, C16:0, C18:0 and C18:1 cis-9) per gram total fat.
3.5 Blood samples
After disinfection, blood samples were collected from the coccygeal artery or vein into 10 mL vacuum tubes containing lithium heparin as anticoagulant. The blood samples were centrifuged within one hour after the sampling and plasma harvested were stored in a refrigerator at -20°C. The thawed plasma samples were analysed for BHB, NEFA, glucose, insulin and IGF-1 at the laboratory at the Department of Animal Nutrition and Management. The concentrations of BHB were analysed using a kinetic enzymatic method (BHB Assay kit, MAK041; Sigma-Aldrich, St. Louis, MO). When analysing the NEFA concentrations, an enzymatic colorimetric test (NEFA C, Wako Chemicals GmbH, Neuss, Germany) was used. The glucose levels were analysed with an enzymatic method (Boeringer Mannheim D-Glucose, UV-method, Kit no: 10716 251 035 (r-biopharm, Roche), Food diagnostics). For the insulin concentrations, a commercial enzyme immunoassay method adapted for bovines was applied (Mercodia Bovine Insulin ELISA, Mercodia AB, Uppsala, Sweden). The concentrations of IGF-1 were analysed with a commercial immuno-assay (Human IGF-1 ELISA, Mediagnost).
3.6 Body condition score
visits, the selected primiparous cows were scored for body condition with a scale of 1 to 5 with 0.25 points increments according to Edmonson et al. (1989). The lowest score (1) indicates an emaciated condition while the highest score (5) indi-cates obese condition. The shape of the spine, the area between the hooks, between pins and hooks and between tail head to pins were observed (Figure 1). Photos were also taken of each examined cow.
Figure 1. The sheet which was used for BCS (Edmonson et al., 1989).
3.7 Statistical analyses
The statistical analyses were carried out using the software Minitab 17. It was studied if correlations between the milk FA C14:0 and C18:1 cis-9 and the blood plasma components BHB, NEFA, glucose, insulin and IGF-1, could be found in the examined individuals. Mean values were calculated and correlation coeffi-cients between the milk FA and blood plasma components were obtained. The results of the statistical analyses that were shown to have a correlation coefficient of >±0.50 were discussed. A statistical analysis of variance (ANOVA) was per-formed to study if significant differences could be found between the farms re-garding levels of C14:0, C16:0, C18:0, C18:1 cis-9, BHB, NEFA, glucose, insulin and IGF-1.
4.1 Questionnaire’s result
In Figure 2, Yes/No-answers from the questions are presented. Seven of eleven farmers experienced that they were affected by the drought. Eight farmers tried feeding alternative feedstuffs, regardless if they experienced that they were affect-ed by the drought and feaffect-ed situation or not. Four of the farmers that triaffect-ed alterna-tive feedstuffs bought in a supplementary compound feed to either complement the roughage because of its poor nutrition value or to partly replace it because of the lack of roughage. Three farmers were required to sell or slaughter animals.
Figure 2. Number of farmers that answered ‘Yes’ or ‘No’ regarding if they experienced that they
were affected by the drought and its consequences, if they tried feeding alternative feedstuffs and how many of these that bought in a supplementary compound feed, and if they were required to sell
0 1 2 3 4 5 6 7 8 9 Yes No Affected by
the drought Used alternativefeedstuffs
Bought in a supplementary compound feed Required to sell or slaughter animals
4 Results
On most of the farms, the ordinary feed ration consisted of a concentrate, minerals, roughage, and wheat, barley and/or oats, normally mixed and smashed. Of the farmers that experienced that they were affected by the drought, there was farm C that tried feeding bean straw which they mixed with the silage. Farm E, F, G and J were farms where they also expressed that they were affected. On these four farms they bought in a complementing compound feed. Feeds that were used on these farms was for example “Rosa Grönmix” from Svenska foder, that can replace parts of the ration of roughage. A complementing feed as “Komplett Grov” from Lantmännen, was fed to the cows on three of these farms. On farm E they added silage from fallows and on farm I and J they added whole crop silage to the ration. Farm H was a farm where they were only able to harvest 70% of the usual rough-age production and the farmer experienced that they were affected by the drought. On this farm they had a large storage of roughage and they did not need to buy feed despite the poor harvest caused by the drought.
Four farmers experienced that they were not affected by the drought and feed situ-ation. However, two of them tried with feeding alternative feedstuffs this year. Farm B added peas to the feed ration this year. On farm A they added whole crop silage. Taking advantage of all of the harvest, like whole crops, is one way to save up roughage. Farm D and K were not affected by the drought and feed situation and made no changes in the feeding strategy.
Most of the farmers expressed that they were especially careful with not discard-ing any feed because of the feed situation and made sure the feed table was empty before they added new feed. A common concern among the farmers was the queues for slaughtering animals, as a consequence of the drought. When they needed to slaughter animals due to the lack of feed this summer, the queues were longer than usual, which made it difficult to send animals to slaughter. In some cases, farmers kept animals with poor milk production instead of slaughter them because they knew about the slaughter queues. It was shown that three of the elev-en farmers had beelev-en required to sell or slaughter animals because of the feed situa-tion. Some of the farmers expressed that a concern is if the next summer would be as dry as the summer 2018.
When the farm visits took part, in September and October, the areas of the farms had finally received rain. This resulted in regrowth of grass on the pastures which also contributed to a longer pasture period. In Table 4, data of precipitation and mean temperature from SMHI are presented to get an overview of the weather of the summer year 2018 and earlier years. It can be seen that there was a decrease in
precipitation and increase in temperature on most of the farms in May to Septem-ber year 2018, compared to the five years before.
Table 4. The mean precipitation (in millimetre) in May to September year 2013 to 2017, and in the
same period year 2018, and mean temperature (in °C) in May to September year 2013 to 2017 and in the same period year 2018, in the areas of the farms (SMHI, 2019)
Farm Experience of drought Prec. 2013-2017 Prec. 2018 Temp. 2013-2017 Temp. 2018 A Not affected 59.7 55.1 14.2 13.9 B Not affected 59.6 51.3 14.1 16.5 C Affected 67.9 53.6 15.2 17.5 D Not affected 73.8 60.0 13.6 15.9 E Affected 77.1 32.8 14.4 16.6 F and G Affected 45.0 32.7 14.5 16.7 H Affected 36.9 32.8 14.4 16.8 I Affected 54.4 54.6 13.7 15.9 J Affected 73.9 43.1 13.6 16.2 K Not affected 70.9 48.8 15.1 17.4
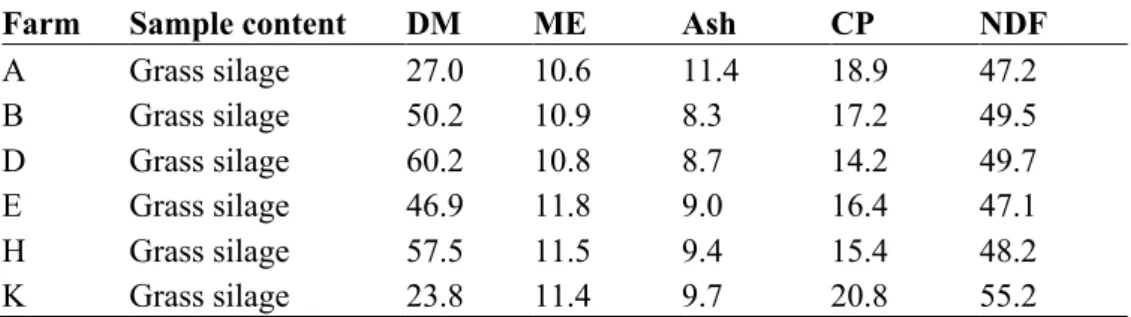
4.2 Feed analyses
From each farm a sample was taken from the roughage fed to the cows at that time. The roughages varied in DM contents. It can be observed that the feed sam-ple from farm C had a low content of ME. The feed samsam-ples that contained grass silage only are presented in Table 5. The feed samples that contained grass silage mixed with bean straw, whole crop silage and/or a supplementary compound feed can be seen in Table 6.
Table 5. Result of DM content, ME (MJ/kg DM), ash, CP and NDF (% of DM) in the feed samples
consisting of grass silage only.
Farm Sample content DM ME Ash CP NDF
A Grass silage 27.0 10.6 11.4 18.9 47.2 B Grass silage 50.2 10.9 8.3 17.2 49.5 D Grass silage 60.2 10.8 8.7 14.2 49.7 E Grass silage 46.9 11.8 9.0 16.4 47.1 H Grass silage 57.5 11.5 9.4 15.4 48.2 K Grass silage 23.8 11.4 9.7 20.8 55.2
Table 6. Result of DM content, ME (MJ/kg DM), ash, CP and NDF (% of DM) in the feed samples
consisting of roughage mixed with bean straw, whole crop silage or a complementing compound feed (complement).
Farm Sample content DM ME Ash CP NDF
C Grass silage, bean straw 57.0 5.3 7.6 13.6 43.9 G Grass silage, complement 85.4 12.1 7.9 18.9 44.0 F Grass silage, complement 47.5 12.0 6.7 16.9 44.7 I Grass silage, whole crop silage
47.3 11.2 9.1 13.3 47.4
J Grass silage, complement, whole crop silage
4.3 Milk analyses
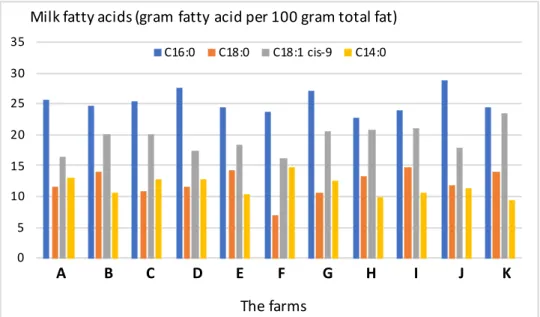
In Figure 3 the levels of the milk FA C16:0, C18:0, C18:1 cis-9 and C14:0 are presented. The level of C18:0 on farm F was low (6.89 g FA per 100 g total fat). The level of C18:1 cis-9 was low on farm A and F (16.5 and 16.17 g FA per 100 g total fat). Further, the level of C14:0 on farm H and K (9.93 and 9.49 g FA per 100 g total fat) were low compared to the other farms. In Figure 4 the average milk yields on the farms the years 2016, 2017 and 2018 in the period May to September are presented. It can be seen that there are no extensive decreases in milk yield on the farms as an possible consequence of the feed situation.
Figure 3. The levels of C16:0, C18:0, C18:1 cis-9 and C14:0 in g FA per 100 g total fat. They are
presented as mean values for each farm. 0 5 10 15 20 25 30 35 The farms C16:0 C18:0 C18:1 cis-9 C14:0 A B C D E F G H I J K
Figure 4. The average milk yield (L) on the farms in the period May to September the years 2016,
2017 and 2018 (data from Swedish milk recording system).
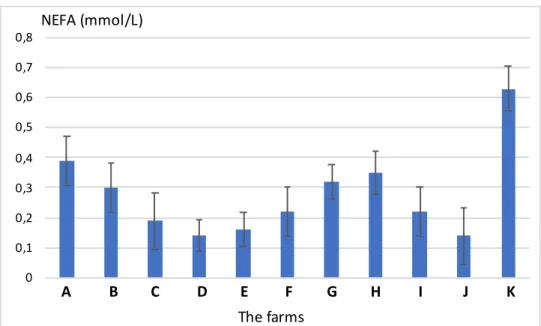
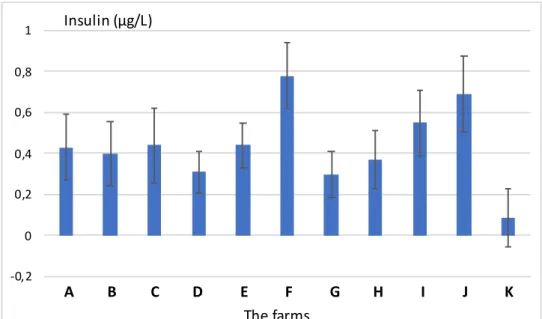
4.4 Blood plasma metabolites and hormones
The statistical analysis of variance (ANOVA) showed that there were significant differences between the farms regarding the BHB levels in plasma. In Figure 5 it can be seen that farm K had the highest concentration of BHB (1.55 mM). Farm K also had the highest level of NEFA (0.63 mmol/L), seen in Figure 6. It can be ob-served that farm D, E and J had low levels of NEFA (0.14, 0.16 and 0.14 mmol/L) compared to the other farms. Regarding the NEFA levels in plasma, there were significant differences between the farms. Concerning the glucose levels, present-ed in Figure 7, farm H and K had the lowest levels (2.84 and 2.79 mmol/L) and farm A and I the highest (3.97 and 3.85 mmol/L). Further, there were significant differences between the farms considering the glucose levels. Regarding the insu-lin levels, presented in Figure 8, farm K had the lowest (0.08 µg/L). There were no significant differences between the farms concerning the insulin level in plasma. The levels of IGF-1 are showed in Figure 9. Concerning the concentrations of IGF-1 there were significant differences between the farms. Farm J had the highest level (173.5 ng/mL) and farm K the lowest (57.21 ng/mL).
0 5 10 15 20 25 30 35 40 45
Average milk yield (L)
2016 2017 2018
Figure 5. The levels of BHB in blood plasma (mM) presented as mean values for each farm, and
standard error (SE) of the means.
Figure 6. The levels of NEFA in blood plasma (mmol/L), presented as mean values for each farm,
and SE of the means. -0,2 0 0,2 0,4 0,6 0,8 1 1,2 1,4 1,6 1,8 2 BHB (mM) A B C D E F G H I J K The farms 0 0,1 0,2 0,3 0,4 0,5 0,6 0,7 0,8 NEFA (mmol/L) A B C D E F G H I J K The farms
Figure 7. The levels of glucose (mmol/L), presented as mean values for each farm, and SE of the
means.
Figure 8. The levels of insulin in blood plasma (µg/L), presented as mean values for each farm, and SE of the means. 0 0,5 1 1,5 2 2,5 3 3,5 4 4,5 Glucose (mmol/L) A B C D E F G H I J K The farms -0,2 0 0,2 0,4 0,6 0,8 1 Insulin (µg/L) A B C D E F G H I J K The farms
Figure 9. The levels of IGF-1 in blood plasma (ng/mL), presented as mean values for each farm, and SE of the means. 0 50 100 150 200 250 IGF-1 (ng/mL) A B C D E F G H I J K The farms
4.5 Body condition
Figure 10 shows the means of BCS on each farm, and standard errors (SE) where it can be observed that the means of body conditions ranged from 3.0 to 3.75 of the scale of 1-5. The body conditions of all the examined cows ranged from 2.5 to 4.25. Most of the individuals (93%) were between 3.0 and 4.0. The statistical analysis showed significant differences between the farms regarding the means of body conditions.
Figure 10. The means of BCS on the farms on the scale of 1-5, and SE of the means.
0 0,5 1 1,5 2 2,5 3 3,5 4 4,5 Means of BCS (1-5) A B C D E F G H I J K The farms
4.6 Energy balance on herd level
The calculated EB on herd level, that are presented in Figure 12, were estimated using the software IndividRAM. The EB were ranging from 91.6 to 109.2%.
Figure 12. The EB (%) on herd level calculated via IndividRAM.
4.7 Correlations between milk fatty acids and blood plasma
components
In Table 7 the correlation coefficients between the milk FA C14:0 and C18:1 cis-9 and all the blood plasma components are presented. The correlation coefficients that were >±0.50 were between C14:0 and C18:1 cis-9; NEFA and C18:1 cis-9; BHB and C18:1 cis-9; C14:0 and BHB; glucose and BHB, and NEFA and BHB.
0 20 40 60 80 100 120 Energy balances (%) The farms A B C D E F G H I J K
Table 7. Correlation coefficients between the levels of C14:0, C18:1 cis-9, insulin, glucose, NEFA,
IGF-1 and BHB on the farms, where the correlation coefficients >±0.50 are bold
C18:1 cis-9 C14:0 Insulin Glucose NEFA IGF-1
C14:0 -0.650 <0.001 Insulin -0.314 0.017 0.263 0.046 Glucose -0.390 0.003 0.402 0.002 0.239 0.071 NEFA 0.539 <0.001 -0.408 0.001 -0.439 0.001 -0.351 0.007 IGF-1 -0.413 0.001 0.495 <0.001 0.400 0.002 0.496 <0.001 -0.498 <0.001 BHB 0.665 <0.001 -0.549 <0.001 -0.259 0.050 -0.673 <0.001 0.518 <0.001 -0.368 0.005
4.8 Differences between the farms
In the statistical analysis of variance (ANOVA), that was performed with the gen-eral linear model and adjusted sums of square, it was found that there were signifi-cant differences between the farms regarding the concentrations of C14:0, C16:0 and C18:0 in milk, BHB, NEFA, glucose and IGF-1 in blood plasma and the body conditions.
5.1 The eleven farms
There are relations between some of the studied parameters. The reason to the different relations on the farms is difficult to know and therefore this needs to be further researched. On farm E, it was expressed that they struggled with the feed situation and bought supplementary compound feed to compensate for the low roughage crop. They also added grass from fallow land to the ration, fallows might have a lower nutrition value compared to silage, since it is arable land resting from crop production. This indicates that this herd managed the drought despite the farmer’s experience.
An interesting farm to discuss is farm K, where the farmer expressed that they were not required to make changes concerning the feeding strategy. The levels of NEFA and BHB in blood plasma were high in the examined individuals, which were in early lactation. According to Esposito (2014) it was stated that an increase in NEFA and BHB and decrease of glucose and IGF-1 in blood plasma are related to NEB, which corresponds to the present study. However, the EB estimated with IndividRAM was good on farm K. In this farm the levels of insulin, IGF-1 and glucose were lower than in the other farms. The level of C18:1 cis-9 was high and the level of C14:0 was low. Taken together these results indicate that the metabo-lism was compromised at least among the sampled sub-population of the early lactating primiparous cows on this farm.
Farm J was one of the farms that was required to change the feeding strategy as a result of the feed situation. The levels of C18:0 and C18:1 cis-9 were low and
while the mammary de novo synthesis was relatively high. The levels of glucose and IGF-1 were high. Regarding the high glucose and IGF-1 in blood, this corre-sponds to the results of the study performed by Obese et al. (2018) where it was stated that the levels of IGF-1 and glucose were higher in the cows consuming the diets with high ME content. It may be assumed that this herd accurately handled the shortfall of feed.
The NEB on farm C may be in relation to the questionnaire, where the animal owner expressed that they were affected by the feed situation. However, since all the examined cows on the eleven farms were in early lactation (3rd to 28th DIM),
they are at higher risk to be in NEB. Thus, the NEB may not be caused by the drought and changed feed strategy.
On farm I they had problems with small harvests this summer and therefore har-vested whole crops and planned to harvest grass from fallow land. The level of NEFA was low and the estimated EB on farm I was close to 100%, which is good. However, the level of C14:0 was low and C18:1 cis-9 was high compared to the other farms, which can be related to the questionnaire where they expressed that they were affected by the drought. Farm F was also one of the farms which changed feeding strategy. The EB on herd level was high. On farm F the level of C18:0 was low. Douglas et al. (2007) concluded that prepartal feed restriction has an impact on LCFA profiles. The cows that were fed a diet with supplementation of mostly saturated free FA to meet 120% of the requirements and where the cows were abomasally infused with soybean oil, had lower level of 18:0 and 16:0. How-ever, in the present study, whole crop silage was added to the ration, and not re-strictions in the diet as in the study by Douglas et al. (2007). Though, in both stud-ies the feeding strategy might have had an impact on the level of the milk FA C18:0.
On farm A the farmers did not experience problems because of the drought. The level of C18:0 and insulin were low compared to the other farms. On farm H the farmer expressed that they were affected by the drought. The large storage of roughage may have contributed to that they did not need to buy feed despite the poor harvests on this farm. In the examined cows from farm H the level of C14:0 was low. On farm G, changes in feeding strategy were performed because of the drought and feed situation. Farm A was a farm where they expressed that they were not affected by the drought and feed situation. However, when comparing the results of A and G, it can be observed that the results on these farms were quite similar except for a lower level of insulin on farm G. Thus, the responses to the
questionnaire and changes in feeding strategy may not always relate to the pa-rameters included in this study.
Jorjong et al. (2014) stated that the milk FA C18:1 cis-9 can be useful to discover detrimental levels of NEFA in blood plasma (³0.6 mmol/L). This can be related to the present study, where the correlation coefficient between NEFA and C18:1 cis-9 was 0.54. Other correlation coefficients that were >±0.50 were between the lev-els of C14:0 and C18:1 cis-9; BHB and C18:1 cis-9; C14:0 and BHB; glucose and BHB, and NEFA and BHB, on the farms. The statistical analysis of variance, per-formed with the general linear model and adjusted sums of square, showed signifi-cant differences between the farms regarding the levels of C14:0, C16:0 and C18:0 in milk, and glucose, BHB, NEFA and IGF-1 in blood plasma and the results of BCS. There were differences between the farms regarding energy metabolism and EB. However, it may be difficult to know what these differences depend on. Since there are significant differences between the herds, it would have been interesting if a clear relation was found between these parameters and the feeding strategy and response of the questionnaire on the different farms. Since farm K was the farm that diverged the most regarding the results of the milk FA and blood plasma components, it was of interest to see if the result of the statistical analysis of vari-ance would be different when this farm was not included. When this statistical analysis was performed without farm K, the result was similar. Significant differ-ences were found between the farms regarding BCS, all of the milk FA and blood plasma components, except for insulin (data not presented).
On some of the farms the animal owner had to slaughter animals because of the feed situation, which is consistent with the study by Shrum et al. (2018) where they stated that culling of animals on the farm can be a consequence of the drought. The body conditions of all the examined cows were between 2.5 and 4.25. The means of the body conditions on the farms were ranging between 3.0 to 3.75 which indicated that the average body condition on the farms were good. A reason to the result may be that all cows were primiparous. The variance of body conditions may be wider in cows differing in ages. Since the examined cows on the farms were in early lactation (3rd to 28th DIM), they might have been
priori-tized regarding the feeding. There may have been cows in the herds that were more affected by the drought and changed feeding strategy than the examined individuals. The proportion of breeds varied between the farms. However, the examined cows in the present study were of the breeds SH and SRB.
2018 (SMHI, 2019). Regarding the data of the precipitation and temperature from SMHI, there are no clear relations between the weather data, and the result of the questionnaire and studied parameters. When the farm visits took part in September and October, the precipitation had increased, and the temperature began to de-crease. Hence, the milk- and blood samples were not collected at the warmest and driest period, which is important to have in mind when analysing the results. They might have been different if they were collected during the warmest and most problematic period of the summer since this increases the risk for e.g. heat stress in the animals.
5.2 Limitations and potential errors in the study
The EB on herd level were estimated by the software IndividRAM. It has to be emphasised that this estimation is based on a number of assumptions about energy intake and energy requirements. The data thus must be interpreted with caution. Nevertheless, the primiparous cows sampled in the herd with lowest estimated EB clearly showed a metabolic pattern indicating deep NEB. Furthermore, the answer given by farmers in response of the questionnaire must be evaluated with great caution since it was a semi-interview and not a recorded interview. It was per-formed by a person who interviewed for the first time, which may have an impact on the result.
Regarding the BCS, it was performed by people who did not have prior experience of this, which may have affected the result. Another factor that also need to be considered is that there was a variation in number of animals that were included at each farm. On some farms blood- and milk samples were collected from only three or four cows, while on another farm ten cows were examined. The cows examined were primiparous and in early lactation. Since the farms had varying numbers of lactating cows, with a range of 103-228 cows, it may have an impact on the num-ber of cows that were included in the study. In addition, it is of importance to have in mind that the examined individuals may not be the ones that were affected by the drought. As mentioned, it is possible that there are cows in the rest of the herds were affected. To achieve more representative results, a larger number of animals examined per farm than three to ten cows would be desirable. Moreover, eleven farms are not a large number of farms, which is important to have in mind when analysing the data.
The feed sample from farm C had a markedly low ME. Reasons can be errors in the sampling or errors in the analysis. A reason may be that the feed sample
col-lected on this farm was taken from a part in the batch that was not closely mixed. It is difficult to know if the batch is thoroughly mixed.
Concerning the milk- and blood samples from the examined cows, it would have been interesting to compare the levels in the present study with levels of the dif-ferent parameters during a normal year. Although the determined milk FA were related to the EB of the cows it must be underlined that the FA content of the con-sumed feed might affect the milk FA profile. Furthermore, the time of the day the milk- and blood samples were collected varied between the farms. The time of collection of the samples in relation to feeding and milking may have an impact on the results. It would have been desirable if the milk- and blood sample were col-lected the same time of the day on all of the farms and if the time of feeding and milking were taken into consideration.
In the present study, it was found that alternative feedstuffs such as bean straw, whole crop silage, grass silage from fallow land, peas and complementing com-pound feeds have been fed to dairy cows due to the feed situation. Despite the experienced problems on the included dairy farms, it seems like the farmers man-aged the feed situation. Relationships were found between the farmer’s experience of the drought and feed situation, and the studied biological parameters, on some of the farms. There were significant differences between a number of blood pa-rameters and also on some measured milk FA reflecting the metabolism. It may thus be concluded that energy metabolism and EB varied between herds. However, the relationship between the summer’s drought and following feed scarcity and the metabolism of early lactating primiparous cows was not evident. This study con-firmed other studies showing significant correlations between plasma NEFA and C14:0 and C18:1 cis-9. Also, other metabolites were significantly correlated to the milk FA although the relationships were weaker.
Bauman, D.E. & Currie, W.B. (1980). Partitioning of nutrient during pregnancy and lactation: a review of mechanisms involving homeostasis and homeorhesis. Journal of Dairy Science, 83:1514-1529.
Bell, A.W., Burhans, W.S. & Overton, T.R. (2000). Protein nutrition in late pregnancy, maternal protein reserves and lactation performance in dairy cows. Proceedings of the Nutrition Society 59:119-126.
Chai, W. & Udén, P. (1998). An alternative oven method combined with different strengths in the analysis of neutral detergent fibre. Animal Feed Science and Technology 74(4):281-288. Dahlström, F., Hessle, A. & Kumm, K. (2018). Forest grazing as a feed resource. Institution report
44. SLU. Department of Animal Environment and Health.
Douglas, G.N., Rehage, J., Beaulieu, A.D., Bahaa, A.O. & Drackley, J.K. (2007). Prepartum nutri-tion alters fatty acid composinutri-tion in plasma, adipose tissue, and liver lipids of periparturient dairy cows. Journal of Dairy Science 90:2941-2959.
Edmonson, A.J., Lean, I.J., Weaver, L.D., Farver, T. & Webster, G. (1989). A body condition scor-ing chart for Holstein dairy cows. Journal of Dairy Science 72:68-78.
Esposito, G., Irons, P.C., Webb, E.C. & Chapwanya, W. (2014). Interactions between negative ener-gy balance, metabolic diseases, uterine health and immune response in transition dairy cows.
An-imal Reproduction Science 144:60-71.
Herdt, T.H. (1988). Fuel homeostasis in the ruminant. Veterinary Clinics of North America: Food Animal Practice, 4:213-231.
IndividRAM (2018). Nordic Feed Evaluation System.
Jennische, P. & Larsson, K. (1990). Traditionella svenska analysmetoder för foder och växtmaterial. Rapport 60, SLL, Uppsala, 15 pp.
Jordbruksverket (2018). Klartecken för att skörda på ekologiska fokusarealer och viss träda. Availa-ble from:
http://www.jordbruksverket.se/4.4e9a8c7a160cb216910c6a37.html#/pressreleases/klartecken-foer-att-skoerda-paa-ekologiska-fokusarealer-och-viss-traeda-2541748 [2019-01-16]
Jorjong, S., van Knegsel, A.T., Verwaeren, J., Lahoz, M.V., Bruckmaier, R.M., De Baets, B., Kemp, B. & Fievez, V. (2014). Milk fatty acids as possible biomarkers to early diagnose elevated con-centrations of blood plasma nonesterified fatty acids in dairy cows. Journal of Dairy Science 97(11):7054-64.
Lindgren, E. (1979). Vallfodrets näringsvärde bestämt in vivo och med olika laboratioriemetoder. Rapport 45. Department of Animal Nutrition and Management, Swedish University of Agricul-tural Science, Uppsala, Sweden. p. 66.
LRF (2018). Torkan: Uppdaterad lägesbild bransch för bransch. Available from:
https://www.lrf.se/mitt-lrf/nyheter/riks/2018/08/uppdaterad-lagesbild-efter-torkan/ [2018-11-04] Mansbridge, R.J., Blake, J.S. (1997). Nutritional factors affecting the fatty acid composition of
bo-vine milk. British Journal of Nutrition 78:1, 37-47.
Martin, A.D., Afseth, N.K., Kohler, A., Randby, Å., Eknæs, M., Waldmann, A., Dørum, G., Måge, I. & Reksen, O. (2015). The relationship between fatty acid profiles in milk identified by Fourier transform infrared spectroscopy and onset of luteal activity in Norwegian dairy cattle. Journal of
Dairy Science 98:8, 5374-5384.
Månsson, H.L. (2008). Fatty acids in bovine milk fat. Food & Nutrition Research, 52:1.
Nordic Committee on Food Analysis (1976). Nitrogen. Determination in food and feed according to Kjeldahl. No 6, third edition.
Obese, F.Y., Rabiee, A., Humphrys, S., Macmillan, K. & Egan, A. (2018). Blood metabolite profile in Holstein-Friesian cows fed diets varying in dry matter and metabolizable energy density dur-ing early lactation. Comparative Clinical Pathology (2018) 27:1191.
Overton, T.R. (2003). Managing the metabolism of transition cows. Proceedings of the 6th Western Dairy Management Conference, March 12-14, 2003, Reno, Nevada.
Pullen, D.L., Palmquist, D.L. & Emery, R.S. (1989). Effect on days of lactation and methionine hydroxy analog on incorporation of plasma fatty acids into plasma triglycerides. Journal of
Dairy Science 72:49-58.
Roche, J.R., Friggens, N.C., Kay, J.K., Stafford, K-J. & Berry, D.P. (2009). Invited review: Body condition score and its association with dairy cow productivity, health and welfare. Journal of
Dairy Sciences, 92:5769-801.
Shrum, T.R., Travis, W.R., Williams, T.M. & Lih, E. (2018). Managing climate risks on the ranch with limited drought information. Climate Risk Management 20 (2018)11-26.
Sjaastad, ÆV, Sand, O. & Hove, K. (2010). Physiology of Domestic Animals. 2nd edition. Oslo:
Scandinavian Veterinary Press. 804 pp.
SMHI (2017). Nödåren 1867-1868. Available from: https://www.smhi.se/bloggar/vaderleken-2-3336/nodaren-1867-1868-1.120293 [2019-03-15]
SMHI (2018). Sommaren 2018 – extremt varm och solig. Available from:
https://www.smhi.se/klimat/klimatet-da-och-nu/arets-vader/sommaren-2018-extremt-varm-och-solig-1.138134 [2018-12-01]
SMHI (2019). Ladda ner meteorologiska obervationer. Available from: https://www.smhi.se/klimatdata/meteorologi/ladda-ner-meteorologiska-observationer#param=airTemperatureMeanMonth,stations=all [2019-03-15]
Suthar, V.S., Canelas-Raposo, J., Deniz, A. & Heuwieser, W. (2013). Prevalence of subclinical ketosis and relationships with postpartum diseases in European dairy cows. Journal of Dairy
Sci-ence 96-2925-2938.
Växa Sverige (2018). Foderråd i torkans tider. Availablie from: https://www.vxa.se/fakta/styrning-och-rutiner/mer-om-foder-och-bete/foderbrist/rad-i-torkans-tider/ [2018-12-22]
First, I want to thank my Supervisor PhD student Anna Edvardsson Rasmussen and Assistant Supervisor Prof. Kjell Holtenius, at the Department of Animal Nutri-tion and Management, for the supervision, support and time, and for making this possible.
I want to thank Maria Åkerlind, Animal Nutritionist at Växa Sverige, for the sup-port with the software IndividRAM.
Thanks to the laboratory staff at the Department of Animal Nutrition and Man-agement, who performed the analyses for this study.
I want to thank the farmers and cows for participating in this study and letting us come to their farms.
Finally, I would like to thank my family and friends for the support they have giv-en me along my studies, both during my degree project and throughout the Agri-cultural Science Programme - Animal Science.