V¨
aster˚
as, Sweden
Thesis for the Degree of Master of Science in Engineering
-Embedded Systems 15.0 credits
DATA DRIVEN ANOMALY CONTROL
DETECTION FOR RAILWAY
PROPULSION CONTROL SYSTEMS
Ajna Hodˇzi´c
ahc19002@student.mdh.se
Dˇzenita ˇ
Skulj
dsj19001@student.mdh.se
Examiner: Thomas Nolte
M¨
alardalen University, V¨
aster˚
as, Sweden
Supervisor: Aida ˇ
Cauˇsevi´
c
M¨
alardalen University, V¨
aster˚
as, Sweden
Claes Lindskog,
Bombardier Transportation, V¨
aster˚
as, Sweden
June 9, 2020
Abstract
The popularity of railway transportation has been on the rise over the past decades, as it has been able to provide safe, reliable, and highly available service. The main challenge within this domain is to reduce the costs of preventive maintenance and improve operational efficiency. To tackle these challenges, one needs to investigate and provide new approaches to enable quick and timely data collection, transfer, and storage aiming at easier and faster analysis whenever needed.
In this thesis, we aim at enabling the monitoring and analysis of collected signal data from a train propulsion system. The main idea is to monitor and analyze collected signal data gathered during the regular operation of the propulsion control unit or data recorded during the regular train tests in the real-time simulator. To do so, we have implemented a solution to enable train signal data collection and its storage into a .txt and .CSV file to be further analyzed in the edge node and in the future connected to the cloud for further analysis purposes. In our analysis, we focus on identifying signal anomalies and predicting potential failures using MathWorks tools. Two machine learning techniques, unsupervised and supervised learning, are implemented. Additionally, in this thesis, we have investigated ways of how data can be efficiently managed. We have also reviewed existing edge computing solutions and anomaly detection approaches using a survey as a suitable method to identify relevant works within the state of the art.
Table of Contents
1 Introduction 1
2 Background 3
2.1 Internet of Things . . . 3
2.2 Edge Computing . . . 4
2.3 Digital Signal Processing . . . 5
2.4 Anomaly Detection . . . 5
2.5 Machine Learning . . . 7
3 Problem Formulation 9 3.1 Method . . . 9
4 Edge Computing - A Survey on Existing Approaches 11 4.1 Edge Computing Systems . . . 11
4.2 Edge Computing in IoT . . . 12
4.3 Edge Computing in Industrial Control Systems . . . 13
4.4 Edge Computing in Railway Systems . . . 13
5 Anomaly Detection in Control Systems - A Survey on Existing Approaches 15 5.1 Machine Learning in Context of Anomaly Detection . . . 15
5.1.1 Supervised Learning . . . 15
5.1.2 Unsupervised Learning . . . 15
5.1.3 Semi-supervised Learning . . . 16
5.2 Anomaly Detection in Industrial Control Systems . . . 16
5.3 Anomaly Detection in Railway Systems . . . 16
5.4 Anomaly Detection in Networks . . . 17
6 Overview 18 6.1 MSLL protocol . . . 19 7 Our Approach 20 7.1 Anomaly Detection . . . 22 7.1.1 Unsupervised Learning . . . 24 7.1.2 Supervised Learning . . . 27 8 Related Work 31 9 Conclusions 32
List of Figures
1 An example of IoT architecture [1] . . . 3
2 Layered model for cloud edge-based IoT services delivery [2] . . . 4
3 Typical digital signal processing setup [3] . . . 6
4 An example of anomalies in two-dimensional data set [4] . . . 6
5 (a) Point anomalies, o1, o2 and O3 [5] (b) Contextual anomaly [6] (c) Collective anomaly [5] . . . 7
6 Steps for writing surveys on existing approaches . . . 10
7 Phases for conducting case study . . . 10
8 The problem space of Edge Computing-based IoT [7] . . . 12
9 Global overview of RELIANCE project [8] . . . 18
10 The physical connection of the server and client . . . 20
11 Activity diagram for Linux Client - Server communication . . . 21
12 An example of a text file . . . 22
13 An example of an excel file . . . 22
14 Position of our thesis in RELIANCE project . . . 22
15 Rd locomotive [9] . . . 23
16 Phases in Anomaly Detection . . . 24
17 (a) Evaluation of each principal component (b) The plot of the first and second components of PCA for one data-set (c) Density of the data distribution explained by first and second principal components . . . 25
18 (a) Real and predicted signal of current (b) Error between real values and predicted values of current (c) Maximum error between real and predicted values of current 26 19 (a) Real and predicted signal of current (b) Error between real values and predicted values of current . . . 26
20 (a) Real and predicted signal of current (b) Error between real values and predicted values of current . . . 27
21 (a) Real and predicted signal of current (b) Error between real values and predicted values of current . . . 27
22 (a) Real and predicted signal of current (b) Error between real values and predicted values of current . . . 28
23 Amplitude spectrum of current . . . 28
24 (a) Scatter plot of Tree model predictions (b) Confusion matrix of Tree model . . . 29
25 (a) Scatter plot of Naive Bayes predictions (b) Scatter plot of Ensemble predic-tions(c) Confusion matrix of Naive Bayes model . . . 30
List of Abbreviations
AC Alternating Current DC Direct CurrentPCU Propulsion Control Unit IoT Internet of Things EC Edge Computing IT Information Technology RAN Radio Access Network DSP Digital Signal Processor AD analog-to-digital DA digital-to-analog ML Machine Learning AI Artificial Intelligence ECG Electrocardiogram FL Federated Learning LoRa Long Range
TDAP Train Data Analysis Platform SDN Software Defined Networks NFV Networks Function Virtualization ICS Industrial Control Systems
DCGAN Deep Convolutional Generative Adversarial Network WSN Wireless Sensor Network
BT Bombardier Transportation PPC Propulsion Control
TCMS Train Control and Management System MSLL Multiple Session Low-latency
UDP User Datagram Protocol IP Internet Protocol RTS Real-Time Simulator
PCA Principal Component Analysis KNN K Nearest Neighbor
1
Introduction
Rail or train transportation is a way to provide transfer for both passengers and goods on a wheeled vehicle that is running on rails located on tracks. The transport is being run on already prepared flat surface guided by tracks. Over the past decades, this kind of transportation has been gaining popularity due to the high level of safety, reliability, availability, and possibility to enable punctual and predictable transportation. It has been used for public transportation purposes, as well as for industrial purposes.
The first steam-powered locomotive was built and presented in 1804. It took few decades before the introduction of the first electric locomotive in 1837 [10], leading to the construction of the first electric railway in 1879. The next achievement in this domain has been the first electric tram line built by Siemens in 1881 near Berlin, Germany. It was powered by the 180 Direct Current (DC) voltage. In 1891, Charles Brown presented the first alternating current (AC) electric locomotive in Z¨urich, Switzerland. In the following years, given that AC power showed great advantages such as high output and long power supply distances, the focus has been on the development of three-phase railways in a few Central-European countries. The design of the overhead lines and possibilities to control the motors’ working speed of three-phase railway was one of the drawbacks that needed to be overcome. The solution was the usage of single-phase alternating current.
In Sweden, the first trial with electric traction was introduced in 1905, and lines are electrified with single-phase alternating current, 15kV AC, and 162
3Hz. Today, countries use different
elec-tric traction systems (i.e., input voltage, control, and traction motor), which makes international railway traveling very difficult and trains need to be equipped with dual/multiple systems (i.e., 15kV AC, 162
3Hz, 25kV AC 50Hz, DC 750V or DC 3kV etc) [11].
Today, public railway transportation is becoming even more important with emerging envi-ronmental and climate problems such as pollution, city congestion, and energy consumption [12]. However, the public transportation system has still some space for improvements. Vehicle failures are rare but inevitable, and whenever they happen they cause problems such as potentially long train delays that lead to loss of time and money for both passengers and service providers. This results in decreased reliability, efficiency, and availability. A way to deal with potential failures is investing in finding an appropriate approach to enable more predictive maintenance of trains in operation.
In this thesis, we focus on enabling an approach for predictive maintenance and anomaly detec-tion for the train Propulsion Control Unit (PCU), with a case study coming from the Bombardier Transportation MITRAC PCU. MITRAC propulsion control system is a Bombardier Transporta-tion product, used in railway vehicles, assumed to be one of the most competitive propulsion and control products offered at the market at the moment. Equipment that Bombardier MITRAC delivers are the following [13]:
• Drives that provide the traction effort;
• Electronics to manage different types of communication on a train, as well as controlling the propulsion system;
• Traction Converters to transform power from catenary overhead power line or diesel engines; • Auxiliary Converters used to supply power to doors, lighting, air-conditioning, etc.
The main functionality of PCU is power processing and management of the entire system [14]. Furthermore, PCU improves safety, reliability, and efficient operation of the vehicles, by monitoring the system and detecting malfunctions of related equipment [15].
PCU collects a large amount of data from the system and systems’ environment. Sensors transmit signals to the PCU, which stores the collected data until it is transferred to the data center, implying that it takes a lot of time and sometimes requires a manual effort. Moreover, offline diagnostics are usually performed in data centers. In case the failure happens, it is usually very challenging to detect system malfunction within usually limited time because, in most unwanted situations, some data may be omitted. To tackle this challenge, it is necessary to enable automatic real-time data analysis.
Cloud computing has been introduced as one way to automatically handle a large amount of data[16]. It is promised to provide scalability, the elasticity of resources, on-demand provisioning, and pay-as-you-go cost model. In this case, to be able to analyse data, the data should be sent and stored in the cloud. In systems like PCU, the amounts of gathered data might sometimes be unsuitable for the cloud, thus edge computing is being introduced as an alternative way to tackle this issue [17]. In order to achieve real-time data streams in such a system, the amount of data needs to be downsized. Edge computing enables the most efficient way of handling large amounts of data and downsizing data in a sense of its ability to distinguish between important and less-important data [18]. To achieve the most efficient way of handling large amounts of data in the edge, machine learning has been identified as a promising solution. It has been used in various domains where data has to be handled [19]. Within the edge computing domain, to process data, ML algorithms can be used for the selection of important information, therefore the total amount of data is significantly reduced.
In this thesis, we focus on investigation and understanding of existing edge computing solutions and anomaly detection approaches using a survey as a suitable method to identify relevant works within the state of the art. Moreover, to provide means for the analysis we have implemented a way for data acquisition from PCU sensors and its transfer into the edge for analysis purposes, called Linux Client. Finally, we have completed the approach by connecting Linux Client to MATLAB in order to be able to use suitable Machine Learning techniques for anomaly detection within the provided data set coming from the railway propulsion system.
The rest of the thesis is organized as follows. Section 2 introduces necessary background. In Section 3 we define the focus of our thesis and corresponding methods to answer the research questions. In Section 4 we deliver edge computing survey and explore the existing edge computing systems related to our thesis. Section 5 is dedicated to the second survey on anomaly detection in control systems. In Section 6, we provide an explanation of the real system set up in which our thesis has a contribution. Section 7 presents our approach and methods for detecting anomalous behaviors of the current signal in the railway propulsion system as well as an extensive explanation of the results. Existing related work is presented in Section 8. The conclusions and potential future work are presented in Section 9.
2
Background
A basic explanation of the key concepts used in this paper will be presented in this section. Section 2.1 describes the Internet of Things and how the data is usually processed. Section 2.2 describes Edge computing and its comparison with Cloud computing. Section 2.3 briefly explains digital signal processing. Section 2.4 introduces anomaly detection in the signal domain, and Section 2.5 describes machine learning algorithms as they are a useful tool for automated data analysis.
2.1
Internet of Things
The Internet of Things (IoT) is a global infrastructure that enables the physical and virtual inter-connection of information and communication technologies [20]. Nowadays, numerous devices are interconnected via a network, and they can exchange the data with each other [21]. By combin-ing telecommunications, informatics, electronics, and social science, IoT enables the integration of several technologies [22]. The IoT enables the integration of products and devices from different fields of knowledge to achieve a common goal.
The IoT is a product of rapid growth of technology, and it is expanding in all areas of life. The applications of IoT are split into four groups, consumer, commercial, industrial, and infrastructure spaces [23]. Some products that IoT brings to us are smart vehicles, smart buildings, smart house devices, etc [24]. IoT is increasingly used in control systems [25]. An example of IoT architecture is shown in Figure 1.
Figure 1: An example of IoT architecture [1]
Sensors are devices that gather data from their environment. This data holds a lot of informa-tion, but it requires further processing to provide useful inputs for the user. IoT devices usually do not support data processing as they have limited computational and energy resources. To resolve this challenge, the data is offloaded in the cloud or data center [26]. After the computations are done in the data center, the actuators receive the command that should be performed.
In an industry such as the railway, the number of sensors can be large, as well as the amount of data that they generate. Transmission of a large amount of data will occupy a lot of network and bandwidth resources [7]. Another viable challenge is data transmission to the faraway data center that can cause significant network latency. To perform the real-time analysis of enormous amounts of data, the amount of data should be reduced and data transmission optimized. One solution for reducing the data is to downsample the data, but there is a risk to miss important information and events [18]. To tackle this challenge, edge computing is introduced to reduce data transmission time and perform efficient data analysis.
2.2
Edge Computing
Edge computing (EC) is a new paradigm that enables the extension of cloud capabilities by placing computing and storage resources at the edge of the network in close proximity to end devices such as sensors, thus supporting a new variety of services and applications [27]. Cloud computing enables the processing and storage of large amounts of data and information in the cloud [28]. The devices have limited storage and computation capabilities, and they offload the data and computational tasks in the cloud. The cloud may be far away from the devices, hence the service may not be provided in real-time.
EC enables the processing and storage of huge amounts of data and information from devices in a local area. EC has close proximity to the devices, and parts of the processing are moved to the edge [29]. Between data source and the cloud database, there is an edge device that can be any device capable of processing the data [30]. These edge devices are also called edge nodes. These devices can be used either to take over some tasks from the user device, which is referred to as task offloading or to take parts of cloud datacenter tasks. Applications that require high bandwidth and low latency are processed near the data source. Figure 2 demonstrates a layered model for cloud edge-based IoT service delivery [2]. This figure has the same layers as the basic EC structure [7]. IoT devices are end devices in EC. They are connected to edge gateway nodes where a lot of real-time data processing and analysis happens. The edge gateway nodes are also used as temporary data storage because they do not have a lot of storage resources. Furthermore, the edge nodes communicate with the cloud. In the cloud, long term data analysis takes place since the cloud has a lot of computational resources to conduct complex data analysis. Also, the cloud provides long term data storage since it has a large storage capacity.
Figure 2: Layered model for cloud edge-based IoT services delivery [2] The main attributes of EC are:
• Low latency and close proximity - Due to close proximity of devices and edge servers, end-to-end delay and response delay are reduced.
• Location awareness - Edge servers collect and process data gathered from devices on the basis of their geographical location without sending it to the cloud.
• Network context awareness - Edge servers are enabled to acquire network context infor-mation in order to adapt and response accordingly to the varying network conditions and devices, which results in optimized network resource utilization [2,29].
Besides EC, other computing concepts exist, and they will be explained shortly to understand the connections and differences between each.
Grid computing is the first computing concept that is introduced in the 1990s [28]. It refers to a group of computers with a primary machine that works in parallel to process the data. It is usually used for computationally expensive calculations that can be parallelized hence calculations can be divided into tasks. After completing a task, each computer sends results to the primary machine which can process those results and give the final result.
Cloud computing is a paradigm that refers to the high-capacity datacenter with computing capabilities that can be accessed at any point in time from anywhere through the Internet [28]. Different types of cloud computing mainly differ in their scales and security levels. In cloud computing, the resources are not accessed directly, but through something like service which has a large number of resources and it allocates them on demand.
Mobile cloud computing is an extension of cloud computing that emerged with the rise of mobile devices [31]. Computationally demanding tasks are offloaded to the cloud from mobile devices, meaning that inherits all advantages of cloud computing.
Fog computing is similar to EC and its main idea is to process the data before sending it to the cloud [32]. The computing resources are placed near the network edge which is the main difference between these two computing concepts.
Multi-access Edge Computing is an extension of EC and it offers IT services and cloud-computing capabilities in the edge [33]. This concept utilizes Radio Access Network (RAN), which provides real-time radio network information suitable for optimization. Since the computing resources are near the end-user, the network latency is ultra-low.
2.3
Digital Signal Processing
Digital Signal Processing (DSP) covers the processing and modifying the signals in the digitized discrete domain. Signals are digitally processed for filtering signals to be more accessible to analyze, compressing to generate faster transmission and simpler detection of errors [34]. Since numerous calculations must be done for signal processing, DSP has high demands for fast computing. Today, there are various applications of DSP such as:
• Image processing, • Video processing, • Control systems, • Seismology,
• Feature extraction, such as image understanding and speech recognition, etc.
Signals from real life are analog signals, therefore to be suitable for digital processing, signals must be sampled. Sampling analog signals is done with proper hardware, analog-to-digital con-verters. Typical digital signal processing setup is shown in Figure 3 [3]. The analog signal is converted to digital signal with AD converter. Obtained signal is processed with digital signal processor (DSP). Since the applications require analog signals, the signal is now converted with DA converter. Finally, the analog signal is filtered with low-pass filter to smother the signal and reduce the fluctuations.
2.4
Anomaly Detection
In the domain of signals, an anomaly is a deviation from the expected values of signals. Therefore, anomaly detection is the identification of deviations or unusual patterns in the data [5]. Anomaly detection has been used in various fields such as fault detection in Industrial Control Systems, attack detection in Cyber Security Systems, detection of different types of disease in medicine, etc. Figure 4 shows an example of an anomaly in a two-dimensional data set where X and Y are the data from two different sensors. Visualization of the data shows us the distribution of the data where we can see the points that deviate from others, and they are considered as anomalies.
Considering the various forms of anomalies that appear in the signals there are three main types to classify all anomalies [5]:
Figure 3: Typical digital signal processing setup [3]
Figure 4: An example of anomalies in two-dimensional data set [4]
1. Point anomalies 2. Contextual anomalies 3. Collective anomalies
Point anomaly, see Figure 5a, is the simplest type of anomaly that refers to one sample of the data that deviates concerning the rest of the data [5].
Contextual anomaly, see Figure 5b, is a set of points that presents abnormal behavior when the set of points is considered concerning the context of appearing [35]. This means that set points in one context could be anomaly, while in other context is not anomaly.
(a)
(b) (c)
Figure 5: (a) Point anomalies, o1, o2and O3 [5] (b) Contextual anomaly [6] (c) Collective anomaly
[5]
Collective anomaly, see Figure 5c, is a set of points that presents abnormal behaviour when the set of points is considered with the rest of the data (entire set of the data) [35].
2.5
Machine Learning
Machine Learning (ML) is a term in Artificial Intelligence (AI) that refers to the machine automat-ically learning and self-improving based on experience, without human influence [36]. The rapid growth of technology puts high demands on fast processing and analyzing of data. ML is the most effective method in the fields of data analysis. It is often used to predict the future behavior of a machine/system using prior collected data. The phase where the ML model is created based on prior collected data is called the training phase, while the testing phase presents using the trained model to process new data [37]. The most important step in the first phase of ML is feature selection [38].
ML algorithms are non-interactive algorithms. Usage of ML algorithms is wide, and in this regard, there are different types of ML algorithms [39]:
1. Supervised learning 2. Unsupervised learning 3. Semi-supervised learning 4. Reinforcement learning 5. Transduction
6. Learning to learn
Supervised learning, unsupervised learning, and semi-supervised learning are more explained in Section 5.1.
One of the applications of using ML is in video games. For example, ML can be used for solving mazes, where the main point is to find the shortest path to the goal. This is where Reinforcement learning technique is applicable. Furthermore, ML is very useful in problems with fragmentary theoretical knowledge, but an enormous amount of data and numerous measurements are needed [40]. Hence, ML algorithms can be used for the detection of patterns in signals, as well as prediction of future patterns. In this regard, ML found its way to be used in the field of anomaly detection that has been tackled by many researchers. For example, ML can be used to find anomalies in biomedical signals such as ECG to detect heart rhythm disorders or to find if the person has cancer or not. One more example of using ML is for detecting anomalies in industrial systems by applying ML algorithms on the data from different sensors.
3
Problem Formulation
One of the most important efforts in the railway industry is to decrease the cost and time needed for maintenance while increasing the reliability and safety at the same time. There is a number of research works that focus on proposing solutions to enable predictive maintenance and anomaly detection. The main challenge these solutions are facing is the problem of handling large amounts of data collected from sensors deployed on the train. In order to be able to detect failures timely, data analysis has to be performed. Due to the difficulty of running analysis with large amounts of data, it needs to be pre-processed and reduced to the most relevant one. Despite many efforts, we are still lacking the method that will in an efficient way extract valuable and important information and enable analysis in order to get timely anomaly detection. Besides all of this, it is an important task to preserve and maintain the existing and expected functionality of control systems at the same time.
To tackle above identified research challenges, in this thesis we aim at answering the following research questions:
RQ1 Which existing approaches are addressing data acquisition in railway systems?
RQ2 Which existing approaches are addressing anomaly detection for recorded signals in railway domain?
RQ3 What are the prerequisites to implement EC based on the anomaly detection approach for MITRAC PCU?
RQ3a What type of analysis methodology can be deployed to enable anomaly detection?
3.1
Method
In this thesis, we have used two research methods, namely survey and case study. The first one is used to help us understand the state of the art with respect to the domain the identified challenges are related to, while the second one is used with the purpose to be able to analyse recorded signals and enable anomaly detection.
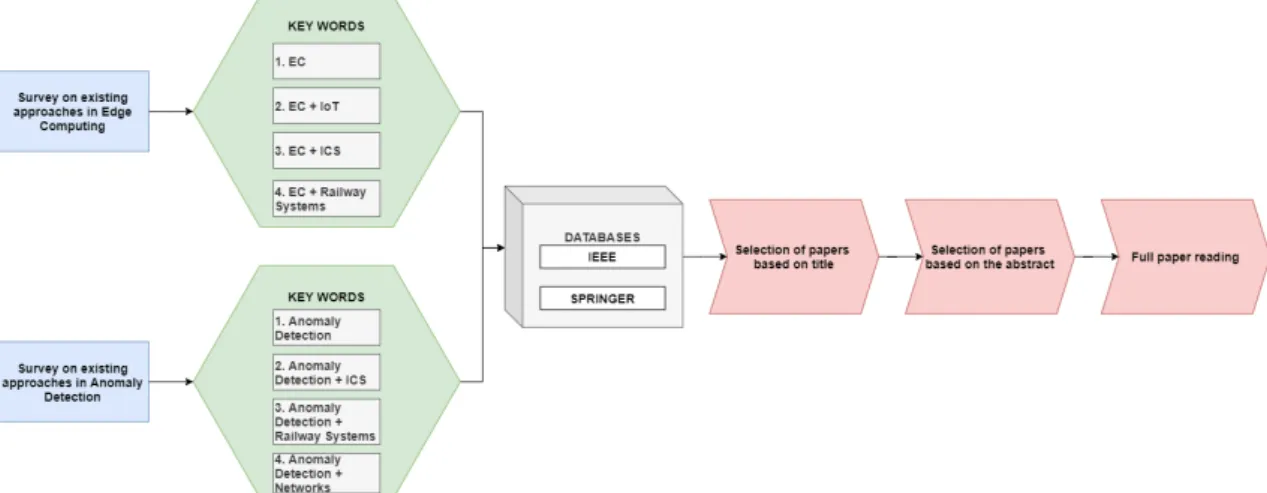
• Survey focused on existing approaches concerning edge computing systems in general, IoT, industrial control systems, and railway systems, and survey on anomaly detection existing approaches in control systems including ML approaches and review of anomaly detection in networks and railway systems. The survey, as a research method, aims to collect standardized information from a specific field [41]. To conduct the surveys we reviewed multiple papers by following the simplified protocol defined in [41] and [42]. The first step was writing research questions, and the second one was to conduct a reviewing protocol. This protocol included the search process, inclusion and exclusion criteria, data extraction, and synthesis of extracted data.
We started the survey on existing approaches in EC by searching for papers with keywords edge computing. We realized that with this approach, we will collect a large number of papers in several EC domains. We decided to filter out these papers by adding new keywords to the search. Since the thesis fits into three domains, the following keywords IoT, industrial control systems, and railway systems are added to the search. We selected, two databases IEEE and Springer, for paper selection, since we consider them as the most relevant databases. By filtering the papers this way, we significantly narrowed down the number of papers. At this point, we had more than 60 selected papers. In the next step, we had to select papers based on their title, followed by abstract reading in the next step. Finally, we carried out a full reading of 35 selected papers.
A survey on existing approaches in anomaly detection in control systems was conducted in a similar way. The survey started with a search for papers with anomaly detection keywords, which has followed by adding new keywords industrial control systems, railway systems, and networks. Afterward, we narrowed down the gathered papers by selecting two databases and filtering the papers based on their title and abstract. Filtering papers resulted in 27
relevant papers for full paper reading, related to the survey on anomaly detection. The flow of conducting both surveys is presented in Figure 6.
Figure 6: Steps for writing surveys on existing approaches
• Case study method enabled us to define a model and implementing the optimization algo-rithm needed, in order to detect anomalies in selected signals. Since the thesis tackles a real system, the choice of case study is a suitable method. A case study is an empirical method that uses multiple sources to gather evidence [43]. It starts with an analysis of the research field and continues with collecting the data.
The steps in the case study follow the guidelines by Runeson et al. [43] and is divided in four phases:
1. Case study design - planning the case study;
2. Preparation for data collection - procedures for data collections are defined; 3. Collecting evidence - execution with data collection;
4. Analysis of collected data.
In the first phase, in collaboration with domain experts, we have decided which locomotive model to use for collecting the data, and signals of interest for implementation and testing. Also, we have defined principles for implementation, which enabled us to move to the second phase.
In the second phase, we have implemented the Linux Client to enable data collection and make it doable to analyze and process signals, as well as to detect anomalies.
In the third phase, we have used the Linux Client to collect the data in the RTS lab. The main reason to use a simulation environment for data collection was due to the time limitation and cost of implementing our Linux Client in the real environment.
In the last phase of the case study, we have enabled connection to the MATLAB and we have loaded the collected data to the MATLAB for the analysis purposes. Using the collected data, we trained two ML models based on two different learning techniques to detect anomalies and get results. Finally, we did the evaluation of the gathered results. Figure 7 visualize the performed steps with respect to the case study.
4
Edge Computing - A Survey on Existing Approaches
Since EC is an important emerging technology, there are many papers and articles concerning this topic [27, 28, 30, 44, 45]. Since EC is connected to many areas and has many applications that are relevant to this thesis, the EC survey on existing approaches will be divided into the following sections.
Firstly, in Section 4.1, different edge computing systems are presented. Section 4.2 focuses on different approaches in IoT applications that integrate EC. Furthermore, Section 4.3 summarizes existing EC approaches in industry systems, mainly focusing on control, while Section 4.4 discusses how EC has been used in railway systems so far.
4.1
Edge Computing Systems
There is a large number of edge computing systems [44]. They differ in application scenarios, end devices, computation architecture, features, etc. Since various challenges are present in EC systems, many papers refer to them and tackle them differently. In this section different EC applications, platforms, and challenges have been reviewed.
Yi et al. [46] present LAVEA, an EC platform that provides low-latency video analytics. Mobile-edge and inter-edge side design are considered. Task offloading and bandwidth allocation is mathematically optimized. Also, nearby edge nodes are leveraged to reduce overall task execution time.
The paper [47] presents a forecasting system based on EC for smart homes. It focuses on short-term electricity demand forecasting. An intelligent home gateway is used to store the data on the central repository where the data is processed and analyzed. Essentially, the data is processed and analyzed on the edge of the power grid. The proposed system offloads data computation to EC servers to save resources and response time and provide a new type of power supply relationship.
Zhang et al. [48] propose a real-time face recognition system based on EC. The proposed system was placed face recognition algorithm on the edge which enables real-time recognition.
In [49] the authors present the Qarnot, a new EC platform for the detection of acoustic events in smart-buildings. This platform introduces computing nodes called Q.rads that also serve as heaters. These heaters create a network that can perform analysis of air quality or the acoustic detection of fire alarms.
Federated learning (FL) algorithms, a deep learning algorithm designed for reducing privacy leakage, and their performance on EC systems are discussed in letter [50]. The authors compare asynchronous and synchronous FL algorithms in terms of model communication between devices. The results indicate that an asynchronous FL algorithm behaves better in edge systems.
Wang et al. [51] focused on the convergence bound of gradient-descent based FL algorithms and a new control algorithm is proposed. This algorithm is based on the knowledge of convergence bound and determines the best ratio of local update and global aggregation to minimize the loss function under a fixed resource budget. The algorithm shows near to optimum performance in different data distributions.
Mogi et al. [52] present a load balancing method for IoT sensor system using multi-access edge computing. When the event with a maximum load at the time occurs, this method replaces the data between servers.
In [53], the authors present a system model for analyzing the scalability and performance of huge city-scale hybrid edge cloud systems. The main objective of this paper is to provide knowledge for selecting the right balance of edge and cloud resources for latency constrained applications. The results indicate that increasing edge resource capacity without increasing internetwork bandwidth may increase network congestion and reduce system capacity.
The problem of optimal computational offloading policy is considered in [54]. The offloading decision is made based on various factors that create a highly dimensional problem. The authors proposed a deep reinforcement learning algorithm for solving stochastic computation offloading. This algorithm combines a Q-function decomposition and a double deep Q-network algorithm.
Another paper [55] considers a stochastic computation task scheduling policy, differently it refers to MEC systems. The optimal scheduling policy is achieved with the one-dimensional algorithm based on the average delay of each task and average power consumption at the mobile device.
4.2
Edge Computing in IoT
Since millions of IoT devices produce a huge amount of data that needs to be processed, EC has been introduced to solve IoT challenges. Therefore, many researchers have been interested in this topic. In [7], the authors showed that EC and IoT have similar characteristics. They have reviewed how transmission, storage, and computation in IoT applications is improved with edge computing. The transmission time is reduced since the edge nodes are geographically distributed near the end-user. However, the storage space that the cloud provides is significantly better than the storage space that edge nodes provide. Also, there is a security concern with edge node storage. Finally, the cloud has much more computational resources than edge nodes. However, the IoT devices do not require many computational resources, thus EC nodes can successfully satisfy the computational demands. Based on these three characteristics, the problem space is shown in Figure 8 has been created.
Figure 8: The problem space of Edge Computing-based IoT [7]
Gosh et al. in [19] considered merging edge and cloud computing technologies for analyzing IoT data. The main idea is to reduce the data in the edge using a deep learning approach and to further analyze the data using ML in the cloud. The proposed approach gave satisfying results, showing that the data reduction did not have a big impact on the results.
Another paper that concerns a deep learning approach in IoT and EC is [56]. The authors introduced an elastic model for different deep learning models. Also, they solved the scheduling problem of deep learning tasks on the edge to optimize IoT applications.
The experimental evaluation of EC in mobile gaming is conducted in [26]. The authors focused on current 3-D arcade games that combine augmented reality and sensor information such as user location. These games have to have very quick responses to be a success. The goal of this research is to demonstrate that using EC can reduce response delay in complex 3-D environments, including virtual and augmented reality.
In [57], edge computing integration in Long Range (LoRa) protocol has been researched. Smart cities, industrial IoT, animal tracking, smart metering are some of the IoT applications that em-ploy LoRa, and that were analyzed for possible optimizations. The authors proposed generic architecture to utilize EC advantages in IoT-based applications.
The security and privacy issues related to IoT have been reviewed in [21, 58]. The security features of IoT are confidentiality, integrity, availability, identification and authentication, privacy, and trust. These features are a measure for privacy and security issues in IoT infrastructures that integrate with EC.
Ren et al. [59] propose IoT architecture based on transparent computing and present its benefits and challenges. Transparent computing provides services at the edge of the network for lightweight IoT devices.
4.3
Edge Computing in Industrial Control Systems
The edge computing has been used in various industrial applications, hence new term has appeared, industrial edge computing. It is used to describe the integration of communication, computation, and storage of resources in real-time applications [64]. The top three areas for industrial edge computing applications are the preventive maintenance of devices, quality control and optimization for process control, and product quality monitoring and optimization [64]. In this section, edge computing applications in industrial control systems have been reviewed and analyzed.
Qian et. al [65] propose an edge computing framework for real-time fault diagnosis and dynamic control of rotating machines. To increase power density and efficiency many mechanical and electrical components have been integrated. These components increase the complexity and failure risks of the rotating machines, hence many sensors are integrated to monitor the condition of the machines. The authors designed an edge computing node to acquire one vibrating signal and three motor-phase current signals. Six motor conditions can be classified using synchronous processing of the signals on the edge. The framework detects faults in real-time and takes control of the motor when the fault is detected.
Pallasch et al. [66] present a platform that combines industrial control with cloud technologies. This approach separates responsibilities and requirements into four levels. The first layer (field layer) includes all physical components that perform actions and sense the data. The acquired data is pushed to the edge layer, which acts as an interconnection for the cloud and field layer. On the edge level, the data is processed, spooled, and compressed. Another function of the edge layer is to pull the processed data from the cloud. The last layer is the environment layer and its main purpose is to provide an interface for visualization.
In [67], the authors designed a proportional-Integrator motion controller for permanent mag-netic DC motor integrated with IoT. The integration process consists of three levels: edge, gateway, and the cloud level. The preferred speed is sent from the cloud to the gateway level. The function of the gateway level is to transmit the data between the edge and the cloud level. Computations of output speed and integral absolute error performance index take place on the edge level. The main goal of having an edge level is to improve latency, bandwidth, and energy consumption.
Skarin et al. [68] research mission-critical control at the edge. The mission-critical system is time and failure sensitive. The failures in such systems result in great loss. Therefore, this paper researches the potential of merged IoT, 5G, and cloud to avoid such failures. The authors presented an edge-cloud test-bed that imitates the mission-critical process. Model Predictive Controller is deployed on test-bed to evaluate system properties. The main goal of the evaluation is to authenticate application deployment in the edge, to verify dynamic reconfiguration during run-time, and to investigate the benefits of deploying mission-critical applications at the edge.
In [69], the authors discussed the cooperation of AI at the edge in industrial applications. IoT devices continuously monitor events in industrial applications and transmit that data to the server. The main challenge of IoT devices is power consumption and short battery lifetime. The authors addressed this challenge by proposing a forward central dynamic and available approach that optimizes power and extends battery lifetime in AI-based IoT devices. This approach adjusts the power level and duty cycle by using signal processing and fault diagnosis at acceptable reliability or packet loss ratio.
4.4
Edge Computing in Railway Systems
Edge computing is particularly suitable for transportation applications [70]. Data transmission to the cloud in real-time is very challenging, thus it is logical to perform signal processing and computation at the edge. Tasks that request urgent results and tasks that do not require a wide range of data sources are performed at the edge, otherwise, the performance happens on the cloud. There is a small number of papers regarding edge computing frameworks in railway systems. In this section, the existing approaches have been analyzed and reviewed.
Chen et al. [71] present fault detection for traction control systems in high-speed trains using edge computing framework. Long-term usage of equipment leads to inevitable faults and it is preferable to remove them since endanger the safety of passengers. Due to the high number of sensors on the high-speed trains and development of data analysis, it is possible to detect faults in real-time. However, high-speed trains produce a huge amount of data in real-time. For example,
one high-speed train with more than 1000 sensors produces about 50Mb of data in one second and transfers it to the cloud. This is a challenge for the control center that has to make an online decision. Therefore, train data analysis platform (TDAP) is proposed. The implementation of this framework is primarily accustomed to Chinese train control system 3 that has cab integrated radio and global system for mobile communications railway. It consists of four parts: train condition monitoring unit, railway data integrator, edge operation system, and TDAP library. The traction system is described in state-space representation, and a stable kernel representation is introduced to eliminate dynamic influence and to detect faults. The kernel representation is calculated using edge computing. The measured data from the traction system is transferred to the TDAP, and it successfully performs online fault detection. The concept of this computing theory is tested on five fault cases with successful results. The cloud receives only the results, which considerably lowers the communicational load.
Z. Liu et al. [70] discuss AI prognostics for high-speed railway systems and present a Cyber-Physical System framework that creates cyber twins. The main purpose of a cyber twin is to recreate physical application and its features by using AI and the industrial Internet of Things. Cyber twins monitor real-time performance and predict possible faults by using signal processing and ML on already existing data. For the performance to be in real-time, edge computing is used. Tasks that do not need a wide range of data are performed on the edge as well as the tasks that require an immediate response.
In [72], SDN\NFV (Software Defined Networks/Networks Function Virtualization) framework is proposed. To increase the efficiency and reliability of railways systems, two use cases are considered. One of the use cases considers NFV-driven edge computing. Edge computing is mainly viewed as an efficient tool for data processing and raising alarms in risk situations.
5
Anomaly Detection in Control Systems - A Survey on
Existing Approaches
There are a number of papers and articles concerning anomaly detection of various systems in order to improve operation and preventive maintenance. Different papers describe different ways of data observation and abnormality detection in various applications. Several papers that provide a detailed overview of anomaly detection are [73,74,75,76,77].
The paper [78] discusses the importance of anomaly detection in the field of the IoT. Authors proposed the technique of improving anomaly detection and Root Causes Analysis using preceding knowledge (historical data) in order to decrease the number of false positives and less undetected events.
In paper [79], the data is observed in order to identify some patterns, using auto-encoders and deep learning models. Four experiments are done to get a better insight into performance whether a distributed model using auto-encoders gives better results than using a non-distributed model.
The paper [75] proposes a new approach of detecting anomalies based on Graph Convolutional Networks that can be used in different domains such as networks, medicine, industry, etc.
Alcaraz et al. [80] focused on anomaly detection techniques in the Smart Grid environment. The paper provides an analysis of different anomaly detection techniques and it gives recommendations on what is the most suitable algorithm for different setups.
Anomaly detection has been used also in the aircraft industry [80]. This paper aims to predict the fault of aircraft elements. The classification-based anomaly detection algorithm is used on raw data from sensors collected during the flight.
5.1
Machine Learning in Context of Anomaly Detection
There are plenty of concepts that have been used for the detection of anomalies in different domain such as ML, data mining, spectral theories, etc. The concept of ML is one of the most used concepts for the prediction of anomalous behavior [81]. Three techniques of ML are used in this purpose, supervised, semi-supervised, and unsupervised ML technique that will be described in following text.
5.1.1 Supervised Learning
Supervised learning is a technique of ML that requires labeled training data set [82]. The data set should be labeled as normal behavior data set and anomalous (abnormal) behavior data set. The main idea of supervised learning is to create a predictive model based on a given data set, thus the new input data can be mapped to the output of the model. The supervised learning technique is stated as a technique with better performance of detecting than semi-supervised and unsupervised learning technique. However, there are several disadvantages to this technique [5]. The first is the lack of data that can cover all areas of normal and abnormal behavior of the considered process. The second is appearance false positives when the new data is enriched with noise. Also, the problem could be how to distinguish and label the anomalous data.
5.1.2 Unsupervised Learning
Unsupervised learning technique does not need a labeled training data set unlike supervised learn-ing technique [5]. This technique relies on the theory of probability. The assumption is that the data contains a large number of normal behavior data, while the number of anomalous data is small. Unsupervised learning technique is very often used technique in different domains due to unneeded human intervention. The main problem with this technique is a high number of false positives [82].
5.1.3 Semi-supervised Learning
Semi-supervised learning technique is a hybrid model of supervised and unsupervised learning techniques. It uses a small data-set of labeled data and a large amount of unlabeled data [5]. The labeled data set is usually normal behavior data set. The problem that can arise using this technique is that any deviation from the normal data set can be considered as an anomaly.
5.2
Anomaly Detection in Industrial Control Systems
Anomaly detection provides promising results in various Industrial Control Systems (ICS), thus many researchers tackled this topic. Many different approaches are used to detect anomalies in ICS.
Kim et al.[76] presented Sequence-to-Sequence approach in ICS. The authors discuss in detail the Sequence-to-Sequence approach. The data that has been used for training is only normal behavior data. The algorithm is working on principle to detect outliers that rely on measuring errors between sensors data and predicted behavior. The results show that the model missed several failures, as well as the model, obtained false positives.
Stefanidis et al. [83] focused on Hide Markov Model in Industrial Control Systems environment. The aim of the paper is to present a new approach for Network Intrusion Detection System based on anomaly detection. The approach is tested on real data-set and it is an efficient model to detect numerous attack vectors.
In order to detect abnormal behavior in ICS where the communication could be affected with noise and changing normal behavior of the system, the paper [84] proposed Adaptive Anomaly Detection in Industrial Control Systems framework. The proposed framework consists of a greedy approach and a neural network that is able to detect anomalies modeling normal behavior. This paper has a contribution in the cybersecurity domain of ICS.
Bigham et al. [85] bring us an analysis of the security of Supervisory Control And Data Acquisition (SCADA) systems using different anomaly detection algorithms. They gave results of algorithms performance based on experimental work for two different methods, N-Gram and Invariant Induction.
In [86], the importance of detecting anomalies in the field of Cyber Security for the Industrial Automation and Control Systems is explained. The paper provides two models of implementation for tracking the traffic. Anomalies are defined and detected in sense of the expected, delayed or arrived traffic in inadequate time.
5.3
Anomaly Detection in Railway Systems
Many researchers tackled the problem of predicting failures in Railway Systems with a desire to improve safety and reduce costs of maintenance.
Papers [87, 88] focus on the maintenance of the door system on the train. In [87], authors investigated two different methods of ML (supervised and unsupervised) in order to highlight the method for failure prediction with the smallest number of false positive, when the low-pass filter is used. The paper [88] proposes the Mean Shift algorithm to detect the incipient anomaly and it is considered for only one abnormal state of the system.
Another paper on this topic, anomaly detection in the railway industry, is [89]. The paper proposed a new strategy for the detection of abnormal behavior where the data, from different sensors on the train, are used. The main focus of this novel strategy is to prevent failures of the train to make railway maintenance more efficient. The data that has been used for the experiment is mostly data from temperature, speed sensors, and accelerometers.
Butakova et al. [78] proposed a new approach for a network anomaly detection in Digital Railway Communication Services. The paper aims to improve the safety of communications in transportation systems. The method is combined with two approaches, the fast spectral transform of traffic data and the decision-making process based on rough sets. The experimental results are obtained using real data.
The problem of bird’s nests on railway catenary is presented in [90] since the bird’s nests cause serious issues. The authors proposed the solution for detecting the bird’s nest on railway catenary based on Deep Convolutional Generative Adversarial Networks (DCGANs). The DCGANs model uses the image data to detect a bird’s nest that is considered as an anomaly.
[77] describes a detailed overview of anomaly detection and two unsupervised anomaly detection models. The efficiency of the algorithms, Isolation Forest and Auto-encoder, is obtained using the real data set from thermal, acoustic and impact sensors in the heavy haul railway line. This paper aims to optimize maintenance operations in the railway industry.
According to Ferreira et al. [91] anomaly detection is an effective technique to predict failure in railway systems and to facilitate the maintenance operations. This paper evaluates and compares three different unsupervised anomaly detection learning techniques using real data from a railway. Algorithms K-means, Self-organizing Map and Auto-encoders are evaluated in this paper. They obtained that the Auto-encoder algorithm is the most efficient of the three presented algorithms.
Lyu et al. [92] proposed a novel approach of detecting anomalies for the isoelectric line in railways. The method is based on image processing and DCGAN algorithm is used for training.
Kang et al. [93] focus on the online detection anomalies of the train speed signal. They proposed the model scheme that can detect unexpected rapid changes in train speed, as well as the model that detects smart attacks with gradually speeding changes using linear regression.
Li et al. [94] proposed a new method for anomaly detection Scores Sequence that has been used for railway systems data. Scores Sequence is a hybrid approach, it combines supervised and unsupervised ML algorithms. The main idea of this algorithm is to consider a group of consecutive points instead of only one point.
5.4
Anomaly Detection in Networks
Anomaly detection for monitoring network traffic is on the rise [95]. The paper [73] emphasizes the vulnerability of new IoT systems connected to the public network, and the importance of anomaly detection in the self-defense of the IoT systems.
Wireless Sensor Networks (WSN) are important elements of IoT systems. The paper [96] proposes an optimized method for detecting anomalies in WSN using already existing different types of detectors.
Korba et al. [97] describe a novel approach for detecting anomalies in ad hoc networks. Anoma-lies are malicious nodes in the ad hoc networks, and a new approach prevents system intrusions.
The anomaly detection method related to SDN domain is presented in [98]. The method is mostly based on prior methods of anomaly detection in SDN, and it promises both accuracy and privacy.
Other papers that are also concerning anomaly detection in the domain of networks are papers [76,83].
6
Overview
This thesis is conducted at Bombardier Transportation (BT) and is addressing a way to collect data from their propulsion system, data processing, and analysis of potential anomalies that could improve propulsion system maintenance. Based on this, we can claim that the thesis is contributing to both industry, and academia providing solutions and knowledge applicable to both. For the industry part, we have identified and implemented a way to collect relevant data samples and detect anomalies over that data. From the perspective of academia, we have contributed to the increasing the knowledge related to the edge computing in the domain of railway systems by conducting a survey and analyzing the collected data, as well as with experimental results from the implemented approach.
The thesis work is done as a part of an international project called RELIANCE in which BT takes part [8]. The RELIANCE stands for Resilient and scalable slicing over multiple domains. The project aims at providing a complete framework for data collection and analysis done in collaboration between several companies from three different countries (i.e., Spain, Sweden, and Turkey). The main focus of companies from Sweden is in providing train data collection over 4G/5G networks and performing data analysis in the cloud. Figure 9 shows the contributions of the Swedish consortium within the RELIANCE project. As we can see, BT aims at enabling collecting the data from the running train and preparing the data to be transmitted to the cloud in a suitable format.
Figure 9: Global overview of RELIANCE project [8]
To be more precise, our work is done within the Propulsion Control (PPC) department. There-fore, one of the first steps within this work has been to get familiar with the PPC System, which is a sub-system of a Train managed by a Train Control and Management System (TCMS). The propulsion system that we have focused on has been MITRAC EOS. To communicate with the MITRAC EOS propulsion system, we have used Multiple Session Low-latency (MSLL) protocol, which is a product owned by BT. The MSLL protocol will be explained in Section 6.1.
6.1
MSLL protocol
MSLL protocol is a logging feature that utilizes UDP/IP transmission, hence it can only be used for systems that are connected to the network with IP addresses. User Datagram Protocol (UDP) is a protocol on the transport layer, that is connectionless [99]. This protocol has no handshaking at the beginning of the communication process, and it has no guarantee that message will be delivered. That implies MSLL protocol has no guarantee that message will be delivered on the reception side. MSLL protocol works with small UDP/IP messages, and the message is directly sent to the recipient with no transmission control. The characteristics of MSLL protocol are the following:
• real-time log from several systems at the same time, • multiple users can log at the same time from one system,
• low latency since samples are sent directly from their sample levels, • can co-exist with existing logging systems,
7
Our Approach
The main goal of this thesis was to develop an approach for detecting propulsion control system anomalies. The first step to tackle this challenge was to collect the data from the propulsion control system (i.e., sensors within the system). After collecting the data, the second step was to analyze the data and detect anomalies. Since the trains produce a large amount of data, we utilized EC advantages. We analyzed the data in close proximity to the data sources to optimize the network bandwidth and memory resources.
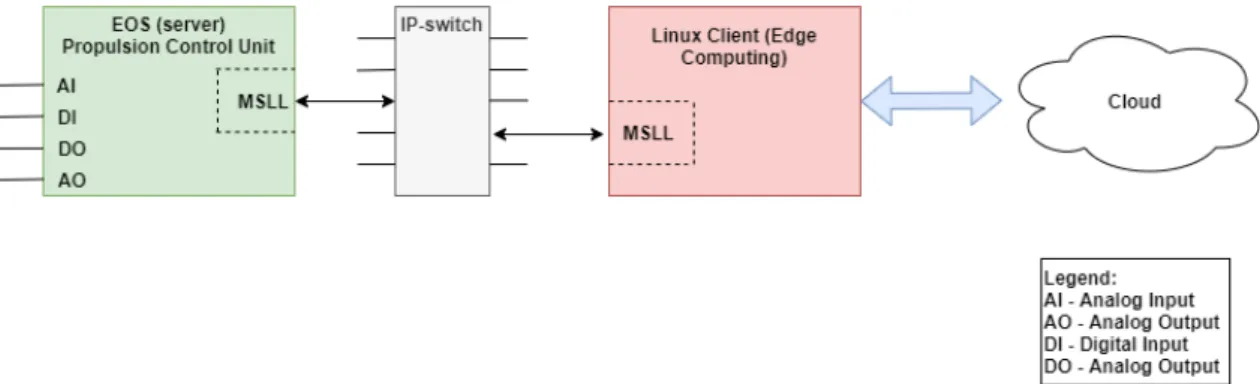
Since we had to collect the data from trains during operation, we have created the client that communicates with the propulsion system. The client has to be ported on a computer that is certified to be used on the train during the operation. Computers that are used on BT trains are running on Linux. Therefore, the client should be running on the Linux platform as well. Therefore the client is called Linux Client. The Linux Client supports the existing MSLL protocol, and it can also be referred as MSLL Client. The Linux Client uses the MSLL protocol to communicate with MSLL server that is placed on MITRAC EOS computer. The physical connection of the Linux Client and MSLL server is shown in Figure 10.
Figure 10: The physical connection of the server and client
To implement the Linux Client, we have used Python programming language. By using Python, the Linux Client becomes independent from the operating system, which is an advantage for future work and propulsion control system updates. To start collecting the data, the Linux Client should receive the configuration file as an input. The configuration file consists of the IP-address of the computer that is running the client, requested sample time for signals, and a list of signals that we want to collect. The configuration file was predefined by the domain experts in the form of a text file.
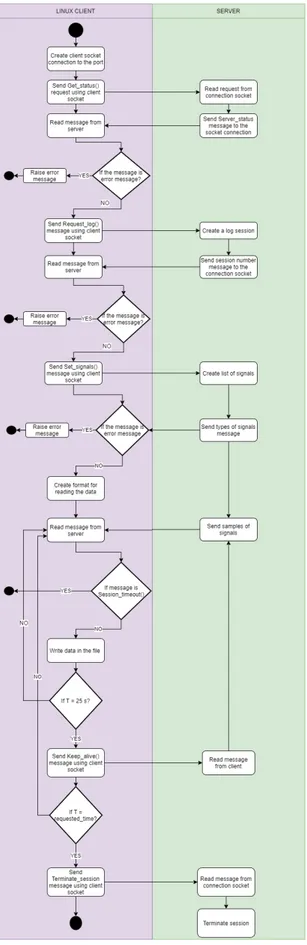
The first thing that the client does is a handshake with MSLL server to check if it is possible to establish communication. When the handshake is established, the client tries to open the session. After the session is opened, it is possible for the client to request signals that are set in the configuration file. Before the server starts responding with signal data, it sends a message with types of required signals. In this phase, the client is receiving samples of signals. The client must periodically send a keep-alive message to the server since the MSLL protocol communication is based on the UDP protocol. During all this time, the client checks if the message from the server is an error message to perform error handling. The client can terminate the session established with the server anytime by sending the termination message. This procedure is shown in the activity diagram in Figure 11.
The signal data is recorded in a text file that has a predefined format by the domain experts, and in a CSV file. To enable signal visualization in one of BT’s programs, the text file has to satisfy a specific form. Each text file has a unique name based on IP address and date and time of recording. It consists of signal names and signal values. The text file format is shown in Figure 12 that represents an example of a text file.
The CSV file consists of signal names in the first row, followed by signal data values in others. An example of CSV file is shown in Figure 13.
Figure 12: An example of a text file
Figure 13: An example of an excel file
Now, when we have collected the signal data, we were able to continue with the data analysis. Usually, the data is sent to the cloud, and all computations are done in the cloud. The main challenge that we have is a large amount of data that takes a lot of memory resources and it is difficult to transmit. Therefore, we have decided to analyze the data on the computer that runs Linux Client. This computer represents the edge of the network and acts as an edge node.
After the desired signal analysis is conducted, the results are ready for transmission to the cloud. In our case, we did not send the results to the cloud, as the work is part of a large international project, and the infrastructure is not ready yet. At this point, the main focus has been on preparing the results for transmission to the cloud. Our contribution to the RELIANCE project is shown in Figure 14 with green color. Our approach for data analysis and anomaly detection is described in Section 7.1.
Figure 14: Position of our thesis in RELIANCE project
7.1
Anomaly Detection
The data has been collected in the RTS lab (Real-Time Simulator), which has been configured for Green Cargo Rd locomotive that is shown in Figure 15. The Rd locomotive is a modernized
Rc2 locomotive. There are two traction motors placed in one bogie and there are two bogies in one Rd locomotive, the line voltage is 15kV , the frequency is 1623Hz, with continuous transformer power of 3910 kVA. The simulator in the RTS lab has four motor controllers that represent traction motors, and it is called a rack.
Figure 15: Rd locomotive [9]
The signals that we have obtained are coming from one rack. Each motor controller in the rack has sensors for measuring the voltage, current, and two different kinds of temperature. The speed and the power signals are related to one rack, which means they are connected with all motors in the rack. Therefore, we had to consider features of the locomotive that is driving that train, existing signals, and their features to perform quality analysis of the data. After data collection, we carried out a thorough discussion with the domain experts about the signal features. Through these discussions, we were able to understand what kind of anomalies exist and what is expected signal behavior.
The experts expressed the need for the current signal to be the main focus for our anomaly detection since it is one of the most important signals in the monitoring process. The normal current value goes up to 1900 A, and everything above this value is considered as an overcurrent. The overcurrent is one of the most dangerous phenomena in any system and directs to serious problems, potential anomalies in the propulsion system. By doing signal analysis, we realized that the overcurrent is classified as an outlier anomaly. Also, the system might go into a dangerous state when high values of the current signal appear together with low values of speed and power signals. This is also considered as an anomaly, namely contextual anomaly. More about the anomaly classification, we refer the reader to Section 2.4.
Since the current signal depends on a few parameters that are represented by other signals, the anomalies of the current signal may indicate several system failures, such as short circuit, motor, sensor, or cable failure. Also, in discussion with experts, we came to the conclusion that both motors from the same bogie have similar behavior. The current signals from motors have similar changes in amplitude in time. The values from current signals do not have to be the same, but the deviation of two current signal values has to be within the specified limits. The experts proposed to limit this deviation to 300A.
To detect and analyze anomalies, we have decided to use MATLAB since it is an efficient tool for various methods of Digital Signal Processing and Data Analysis. Using MATLAB required the transfer of the collected data with the Linux Client to MATLAB workspace. The manual process is slow and requires human interference. Therefore, we have automated this process to make it faster and more efficient. This is done by recording the data in an excel file that can easily be loaded into the MATLAB script. Also, we have run MATLAB script from Linux Client that uses a prior trained model to detect anomalies in new data. Figure 16 depicts the phases in anomaly
detection process.
Figure 16: Phases in Anomaly Detection
To train a model that detects anomalies, we have used two ML methods, i.e., unsupervised and supervised learning. The main reason why we have used two different methods is that the data we have collected in the RTS lab was not labeled. While we conducted an unsupervised learning method, the domain experts analyzed the data and appropriately labeled it. Afterward, we were able to conduct a supervised learning method. We have applied already existing ML algorithms in MATLAB and adapted them to our needs. These methods are explained in Section 7.1.1 and Section 7.1.2.
7.1.1 Unsupervised Learning
For the unsupervised learning method, we have used Principal Component Analysis (PCA) and binary classification Decision Tree algorithm to create a predictive model. As explained in Section 5.1, an unsupervised learning technique does not require labeled data-set, therefore the algorithm is applied on unlabeled data-sets. The Decision Tree algorithm belongs to the group of supervised ML algorithms, but it can also be used as an unsupervised learning technique. The reason for using the PCA was to reduce the dimensionality of data-sets since we considered signals from six sensors. The PCA method gives us eigenvectors for the principal components that could represent a large set of variables into the smaller set.
Since we considered signals from six sensors, the PCA algorithm gives us six principal compo-nents. The percentage of representation of the data by each principal component and the combined principal components is shown in Figure 17a. The orange dots show the contribution of the indi-vidual principal component in the data representation, while blue dots represent the contribution of the cumulative combination of principal components. As we can see in Figure 17a, the whole data-set can be represented by first and second principal components with the credibility of 99.7%. Hence, most of the information lives in the two-dimensional subset, and by plotting the first two principal components together, we can represent almost all information from six sensors. The plot of the first two principal components is shown in Figure 17b, while Figure 17c shows us the density of the data distribution where the parts with lighter color have a smaller number of data points, and parts with darker color have a larger number of data points. However, the data that is shown in Figure 17b is interpreted as normal behavior for points in the green rectangle, abnormal behavior for points in the red rectangle, and warning for points in the orange rectangle.
In this regard, the model for anomaly prediction has been trained based on one data-set that we have got in the RTS lab by simulating one trip. The trained model is tested on several different data-sets for the same setups in the RTS lab, which means for the same train, but different trips. Figure 18 and Figure 22 represent the results of the trained model.
The real and predicted values of the current, for the first test data-set, are shown in Figure 18a, while the error between them is shown in Figure 18b. As we can see, the predicted current deviates from the real one within certain limits, and the largest deviation from the real current is 250.8A at sample time 15.897h, see Figure 18c. This deviation is considered within allowed limits, since we have decided, in agreement with domain experts, to set the alarm state for the deviation
(a)
(b) (c)
Figure 17: (a) Evaluation of each principal component (b) The plot of the first and second com-ponents of PCA for one data-set (c) Density of the data distribution explained by first and second principal components
higher than 300A. Therefore, this data-set is clustered as the normal behavior of the propulsion system.
The real and predicted values of the current, for the second data-set test, are shown in Figure 19a, while the error between them is shown in Figure 19b. This data-set is clustered as anoma-lous, since the maximum deviation between real and predicted values of current is greater than 300A. This anomaly is considered as a point anomaly because the current reaches values higher than 1900A. If we analyze the error between the real and predicted current without considering anomalous points, in Figure 19b, we can see that the error is within allowed limits.
Figure 20a presents the real and predicted value of current for third data-set, and Figure 20b presents corresponding error signal. This data-set is also clustered as anomalous data-set. As we can see, the data-set has a point anomaly since values of current are greater than 1900A. However, this data-set would be clustered as an anomalous data-set without considering these high points of current that are anomalous. The error between the real and predicted current, see Figure 20b, before and after anomalous points, reaches values greater than 300A. However, the trained model, in this case, also gives false-positive results.
The fourth data-set is clustered as a normal data-set since the error between the real and predicted current, see Figure 21b, is within the allowed limits. The plot of the real and predicted current is shown in Figure 21a.
The next data-set is clustered as anomalous data-set, see Figure 22. This data-set consists a contextual anomaly, since the value of current reaches values higher than 1000A at low values of power and speed. The real and predicted current is shown in Figure 22a, while corresponding error is shown in Figure 22b.
(a)
(b) (c)
Figure 18: (a) Real and predicted signal of current (b) Error between real values and predicted values of current (c) Maximum error between real and predicted values of current
(a) (b)
Figure 19: (a) Real and predicted signal of current (b) Error between real values and predicted values of current
The real, and predicted current, that are shown in Figures 18-22, are filtered values of current since the real current consists of direct and alternating current (i.e., DC and AC). The AC ripple appears as a product of doing transformations of signals on trains, and it could be considered as a noise signal. The amplitude spectrum of the real current is shown in Figure 23, where we can see
![Figure 1: An example of IoT architecture [1]](https://thumb-eu.123doks.com/thumbv2/5dokorg/4880651.133488/8.892.247.641.583.829/figure-an-example-of-iot-architecture.webp)
![Figure 2: Layered model for cloud edge-based IoT services delivery [2]](https://thumb-eu.123doks.com/thumbv2/5dokorg/4880651.133488/9.892.223.671.584.865/figure-layered-model-cloud-edge-based-services-delivery.webp)
![Figure 4: An example of anomalies in two-dimensional data set [4]](https://thumb-eu.123doks.com/thumbv2/5dokorg/4880651.133488/11.892.263.638.643.895/figure-example-anomalies-dimensional-data-set.webp)
![Figure 8: The problem space of Edge Computing-based IoT [7]](https://thumb-eu.123doks.com/thumbv2/5dokorg/4880651.133488/17.892.257.635.390.637/figure-problem-space-edge-computing-based-iot.webp)
![Figure 9: Global overview of RELIANCE project [8]](https://thumb-eu.123doks.com/thumbv2/5dokorg/4880651.133488/23.892.130.768.510.919/figure-global-overview-of-reliance-project.webp)

![Figure 15: Rd locomotive [9]](https://thumb-eu.123doks.com/thumbv2/5dokorg/4880651.133488/28.892.224.671.229.537/figure-rd-locomotive.webp)
