Developing a Windshield Display for Mobile Cranes
Taufik Akbar Sitompul
a b, Simon Roysson
aand José Rosa
caMälardalen University, Västerås, Sweden bCrossControl AB, Västerås, Sweden
cBeneq Oy, Espoo, Finland
Email: taufik.akbar.sitompul@mdh.se, srn17002@student.mdh.se, jose.rosa@beneq.com
Abstract
-Modern heavy machinery, including mobile cranes, are increasingly equipped with information systems in the form of head-down displays that present supportive information. Due to the physical presence of head-down displays, they are usually placed far away from operators’ line of sight, thus the information is unintentionally overlooked. This paper investigated the use of transparent displays in mobile cranes, which enables supportive information to be presented near operators’ line of sight without fully obstructing their view. We developed both virtual and physical versions of the trans-parent display, which show information related to the lifting capacity and its influencing factors. The virtual version was developed using the Unity game engine with the data from the official load charts for a specific mobile crane model were incorporated into the mobile crane simulation. The physical version was made using off-the-shelves items, such as glasses, LEDs, super glues, insulated copper wires, and an Arduino. We then connected the virtual transparent display with its physical counterpart using an asset called Uduino, which en-abled the Unity game engine to send data to the Arduino. The result in this study showed that the virtual transparent display and its real counterpart were functioning as what we intended. The developed prototype would be used in fu-ture user evaluations, thus we could determine to what extent this approach would affect the operators’ performance and experience.
Keywords
-Human-machine interface; Head-up display; Transparent display; Prototype; Mobile cranes; Heavy machinery.
1
Introduction
Cranes are one kind of heavy machinery specifically used for lifting and moving objects from one place to an-other. Cranes come in different types, such as mobile cranes and tower cranes. Operating a crane is a com-plex task that continuously demands significant cognitive workload from the operator [1, 2]. When lifting a load, the operator has to remain cautious, as the crane’s parts or the lifted load may collide with nearby people or structures. The operator also needs to ensure that the operation is
al-ways done within permissible conditions, such as permit-ted load weight or wind speed, thus the crane’s balance can be maintained [3]. Crane-related accidents can harm lives and properties of both workers and non-workers [3, 4].
Modern cranes are increasingly installed with informa-tion systems in the form of head-down displays that provide supportive information to the operator [3]. The head-down display is usually placed far from operational areas, since the presence of the display can obstruct the operator’s view. However, this placement makes the supportive information is unintentionally overlooked by the operator. The benefit of having such supportive information is diminished if the operator does not use it.
In this study, we explored another way of presenting supportive information in mobile cranes through the use of transparent displays, which emit their own light but look transparent when the light is off. This way, the supportive information can be presented near line of sight, without obstructing the operator’s view. Mobile cranes were cho-sen as the use case, since they were responsible for around 70% of all crane-related accidents [4]. Looking at the cau-sation factors, human errors contributed about one-third of total accidents, where the main reason was due to op-erators used the crane beyond the permissible operational limits. Here, we focused on visualizing information re-lated to the lifting capacity and the factors that influence it as the information presented on the transparent display. These kinds of information were chosen as they play vi-tal role for performing safe lifting operations [5]. Similar information can also be found on the Load Moment Indica-tor (LMI) system, which is commonly installed in various types of cranes [3].
2
Related Work
Many studies have been done to investigate new ways for visualizing information to the operator of heavy machin-ery, including mobile cranes. Although the proposed ap-proaches vary from one study to another, the common ones are projecting the information on the windshield or directly on the object of interest (see Sitompul and Wallmyr [6] for the review). However, most of the studies were conducted in simulations, and thus it is difficult to determine to what
extent the proposed approaches would work in real ma-chines.
There were several studies that tried to build the physi-cal visualization system, which could be deployed in real machines. In the context of mobile cranes, Fang et al. [2] investigated the use of bigger head-down displays, where the operator could see multiple views around the machine, as well as the supportive information. In the context of tractors, Fernandez et al. [7] explored the use of head-mounted displays, where the information, such as naviga-tion and which areas that have been treated, can be shown as it appeared directly on the object of interest. Still in in the context of tractors, Palonen et al. [8] also used a head-mounted display, but they probed on how to visual-ize the environment that was occluded by the machine’s part, thus the operator could observe blind spots around the machine. There were three studies that explored the cabin’s windshield as a place to visualize the informa-tion. Both Rakauskas et al. [9] and Englund et al. [10] respectively used a projection head-up display to present the information on the windshield of snowplowers and forest harvesters. In the context of off-shore cranes, Kval-berg [11] considered using a transparent display that could be installed on the windshield.
Based on the studies mentioned above, it is still difficult to decide which approach as the most suitable one due to two main reasons. Firstly, the studies were often limited to technical evaluations only, except for Rakauskas et al. [9], Englund et al. [10], and Fang et al. [2] who carried out some user evaluations in their studies and each evaluation was for a different kind of heavy machinery. Therefore, more studies are still needed to determine to which ex-tent the proposed approaches could benefit the operator. Secondly, each option has its own advantages and disad-vantages. Although Fang et al. [2] found that the operators performed better when using the bigger head-down display compared to when the operators had no support, the opera-tors still commented that the bigger head-down display was still considered too small and the presence of the display could also obstruct their view. Head-mounted displays are another option that allows the operator to see the infor-mation exactly within the line of sight, but this approach could be ergonomically uncomfortable for the operator, especially for long-hour usages [12]. In addition, con-sidering that the operator is required to wear a protective helmet, wearing multiple head gears may not be a viable option for the operator. Both projection head-up display and transparent displays are the other two options, as the operator could see the information without wearing addi-tional equipment. The main drawback of projection head-up displays is the projected information may deteriorate in bright environments [13]. On the contrary, transparent displays are strong against external light, but they are still
Figure 1. The transparent display prototype for off-shore cranes that was made by Kvalberg [11]. The light-emitting diodes (LEDs) were manually con-trolled by setting two values on the computer pro-gram: one for the indicator and one for the limit. The LEDs that formed the 5-digit numbers were lit to visualize the value of the indicator. The LEDs that formed a triangle warning were lit if the indicator value was higher than the limit value.
limited in terms of colors, as only green and yellow are currently available [14]. In addition, the information be-ing shown is static to what has been determined when the display was manufactured.
Taking into account the fact that all proposed approaches are still in the exploratory stage, as well as both advantages and disadvantages of each proposed approach, we were in-terested to further explore how transparent displays could be utilized in mobile cranes, similar to what Kvalberg [11] has done (see Figure 1). In our prior study [5], we have determined what kinds of information that should be pre-sented on the windshield, how the information should be visualized based on the capability of transparent displays, and gathered feedback from six mobile crane operators regarding this proposed approach. Although the operators perceived the effort of bringing information closer their line of sight positively, our prior study was still limited to the operators’ understanding on the proposed informa-tion visualizainforma-tion and where to place the informainforma-tion on
the windshield. There is a need for high-fidelity proto-types, which could later be used to evaluate the proposed visualization approach in certain scenarios. Therefore, it would be possible to determine to what extent this visual-ization approach would improve or hinder the operators’ performance and experience.
3
The Prototype
In this study, we developed both virtual and physical transparent displays that act as a replica of each other. Both virtual and physical displays visualized the information related to the lifting capacity, such as the boom length, the load radius, and the lifting percentage. Based on our prior study [5], we found that these kinds of information are essential for performing safe lifting operations and the operators would also like to have them to be presented on the windshield. The remaining of this section describes how both virtual and physical transparent displays were developed.
3.1 The Simulation
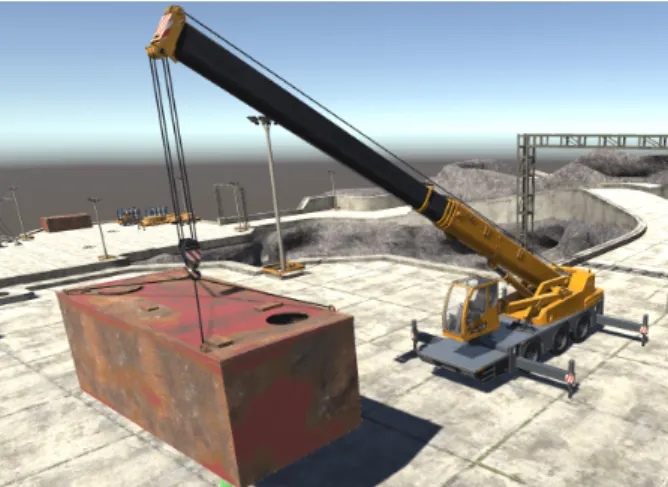
To speed up the development, we used an available mobile crane simulation that was purchased from Unity Asset Store [15]. Therefore, we did not have to develop everything from scratch. The simulation has two fully functioning mobile cranes that can be played immediately, but the one that we used in this study was the one named ’HTR1045’ in the downloaded project (see Figure 2). Al-though not the exact replica, the virtual mobile crane in the simulation has a close resemblance with the Liebherr’s LTC 1050-3.1 compact mobile crane [16]. A notable dif-ference is the boom of the LTC 1050-3.1 crane has five telescopic booms, while the boom of the virtual mobile crane only has four telescopic booms. The virtual environ-ment was made of a flat ground without additional weather conditions. We kept this initial setup, since a mobile crane should be operated on the flat ground and permissible weather conditions due to safety reasons [17, 18].
Since we aimed to develop a prototype that could be used in certain scenarios, it is important that the presented information on the transparent display is not arbitrary and the information is shown based on the run-time situation. To do so, we had to continuously measure the machine status, such as the boom length, the load radius, the lifting capacity, and the lifting percentage. As the virtual mo-bile crane has a close resemblance to the Liebherr’s LTC 1050-3.1 crane, we used its two official load charts [16, pp. 23 and 29] as the source of information on how the lifting capacity of the virtual mobile crane should change based on the boom length and the load radius. Two load charts were used, since the LTC 1050-3.1 crane can be used using the 4.8-tonne counterweight or the 6.5-tonne
Figure 2. The virtual mobile crane and the virtual environment used in this study.
counterweight.
The rest of this subsection describes the modifications that we have made on the initial simulation.
3.1.1 Establishing a Metric Measurement in the Sim-ulation
Based on the original code in the initial simulation, the Unity coordinates were often multiplied by 3.6 to define the length of one meter inside the simulation. However, the reason behind this decision was unknown and we had to establish a constant metric system in the simulation, since the load charts in [16, pp. 23 and 29] were documented in meters. From the load charts, the maximum boom length for the LTC 1050-3.1 crane is 36 m. Instead of using the unknown conversion rate, we defined a new conversion rate by dividing the maximum boom length of the virtual mobile crane measured in Unity coordinates with the LTC 1050-3 crane’s maximum boom length, which gave us a conversion rate of 0.88264784. By multiplying Unity coordinates with the new conversion rate, we were able to establish another constant metric that defines the length of one meter in the simulation. This calculation was always used for measuring the boom length and the load radius.
3.1.2 Storing the Values from the Load Charts into the Simulation
We stored the values from two load charts in [16, pp. 23 and 29] directly into the simulation, which enabled the virtual transparent display to automatically find the specific information that should be presented. To auto-matically find the values based on load charts during the run-time, a lifting capacity class was made, which acted as the look-up table for the lifting capacity. As the values were taken from the load charts, the class comprised of
three fields: boom length, load radius, and their corre-sponding lifting capacity. Boom length and load radius were represented as arrays, while the corresponding lift-ing capacity was represented as a matrix. To determine the corresponding lifting capacity, the indexes of the ar-rays were used as the table representation of a load chart, where both boom length index and load radius index de-cide the lifting capacity value. CurrentLengthIndex and CurrentRadiusIndex were set to be the active index values based on the current state of the virtual mo-bile crane. Both indexes were managed by GetBoom-LengthIndex()and GetRadiusIndex() methods that took the values of the current boom length and the cur-rent load radius of the virtual mobile crane. For example, when the boom was extended to 36 m, then the index value was set to 10 (note that the index value started from 0). If we used the load chart for the 6.5-tonne counterweight [16, pp. 23], when CurrentLengthIndex was 10 and CurrentRadiusIndexwas 7, then the lifting capacity was 8 tonnes. The GetLoadCapacityInTonnes() method then looked up the values in the lifting capac-ity matrix based on the values of GetBoomLengthIn-dex()and GetRadiusIndex(). See Figure 3 for an illustration that shows how the lifting capacity class works.
Figure 3. An illustration that shows how the lift-ing capacity class works inside the simulation. The numbers in red color indicate the activated indexes. The class automatically finds the lifting capacity value based on the indexes of both boom length and load radius.
As the load charts contained the values for some of the states of boom length and load radius, the lifting capacity class could show the lifting capacity for the states docu-mented in the load charts only. Due to this limitation, we automatically set the lifting capacity to the next available
state when the boom length or the load radius were be-tween two documented states in the load charts, as shown in Figure 3. This decision was made, since setting the lifting capacity to the next available set would make the lifting capacity to be slightly lower than the actual one, and thus more preferable from safety point of view.
3.1.3 Adding the Virtual Transparent Display into the Simulation
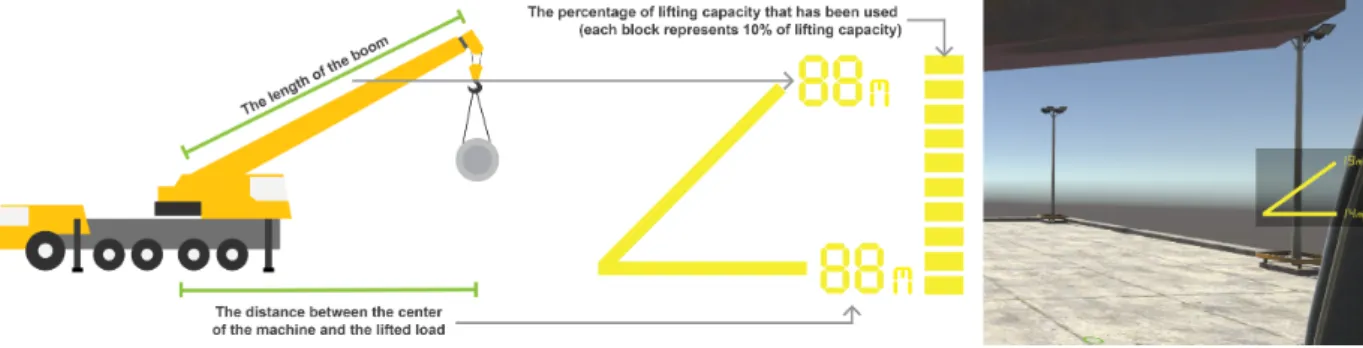
We added a graphical user interface (GUI) into the sim-ulation, which served as the virtual transparent display (see the right image in Figure 4). The virtual transparent display was designed based on the revised version of one of visualization concepts that we designed and evaluated in our previous study [5]. Three kinds of information are shown on the virtual transparent display: (1) the current boom length, (2) the current load radius, and (3) the lift-ing percentage (see the left image in Figure 4). The liftlift-ing percentage was calculated by dividing the weight of the lifted load with the lifting capacity for the current state of boom length and load radius, and then multiplied by 100. Based on the measurement of boom length and load ra-dius described in Section 3.1.1, the values of boom length and load radius could be in decimals, but the virtual trans-parent display only shows the values of boom length and load radius in integers, as shown in the left image in Figure 4. If the decimals are between 0.1 and 0.5, the values are automatically rounded down. If the decimals are between 0.6 and 0.9, the values are automatically rounded up.
As illustrated in the left image in Figure 4, the lifting percentage is visualized using ten blocks, where each block indicates that 10% of the lifting capacity has been used. Since each block indicates 10% of the lifting percentage, one block is turned on if the lifting percentage is anywhere between 0.1% and 10.0%. For example, when the lifting percentage is 20.1%, then the first three blocks from the bottom are turned on. The operator needs to ensure that the top block is not turned on, since that means the virtual mobile crane is approaching its limit and the risk of tipping over is high.
3.2 The Physical Transparent Display
Our approach for making the physical transparent dis-play was similar to what Kvalberg [11] has done for the transparent display prototype in off-shore cranes (see Fig-ure 1). We used WS2812b light emitting diodes (LEDs), which allowed us to control the LEDs individually. A WS2812b LED has four pins, where one pin is for the supply voltage, one pin for the ground, one pin for the input signal, and another pin for the output signal [19]. We initially wanted to use the 2 mm x 2mm LEDs, since that means we could use glasses with smaller dimension. However, we later found that those LEDs were too small
Figure 4. The left image shows the meaning for each kind of information shown on the virtual transparent display. The right image shows how the virtual transparent display looks like inside the simulation.
Figure 5. The LEDs were attached on a glass and arranged in a way that resembled the design of the virtual transparent display. The LEDs were divided into three groups and each group was assigned to visualize specific kinds of information.
to be soldered manually. We then decided to use the same type of LEDs, but the dimension was 5 mm x 5mm. The LEDs were then attached using a superglue to a glass with dimension of 20 cm x 12 cm and thickness of 1 mm. The connection between one LED to another was done using insulated copper wires with diameter of 0.1 mm. We used 102 LEDs and arranged them in a way that the LEDs would resemble the design of the virtual transparent display (see Figure 5).
We used an Arduino Mega2560 microcontroller and a FastLed library [20] for controlling the LEDs. To make the control simpler, we divided the LEDs into three groups, where each group was respectively assigned to visualize the information about the boom length, the load radius, and the lifting percentage (see Figure 5). Each group of LEDs was connected to one specific pin on the Arduino.
For the number of LEDs that we used for the physical transparent display, the power supply from the USB cable was enough to power all the LEDs, thus we did not use an external power supply in this study. Although the LEDs used for the physical transparent display could display any color by changing the values of red, green, and blue (RGB) on each LED, we decided to use the yellow color since real transparent displays are available in yellow or green only [14].
3.3 Connecting the Simulation with the Physical Transparent Display
We used an asset called Uduino, which was purchased from Unity Asset Store [21], to connect the physical trans-parent display with the virtual one. Uduino enabled the Unity game engine to send data to Arduino via a USB ca-ble. In this study, the Unity game engine was continuously sending the data about the boom length, the load radius, and the lifting percentage to Arduino. Based on the in-put data, Arduino automatically decided which LEDs that should be turned on or turned off. For example, if the virtual transparent display shows that the boom length is 10 m, the physical transparent display should turn on sev-eral LEDs in the group that visualize the boom length, so that the number 10 can be formed. The same thing also applies for visualizing the load radius. Specifically for the lifting percentage, the first two bottom rows of the LEDs are turned on if the lifting percentage is 20%.
4
Result
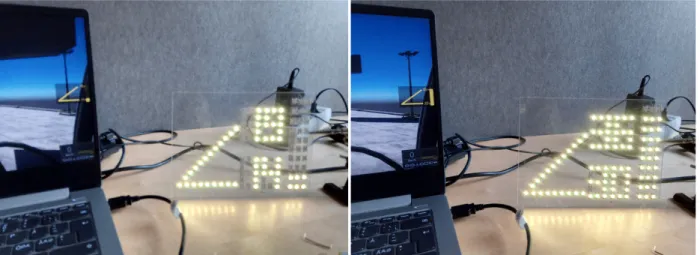
In this section, we present two examples that demon-strate the integration between the virtual transparent dis-play and its physical counterpart. The examples shown in this section were taken when the virtual mobile crane was using the 4.8-tonne counterweight and lifting a 1-tonne load. Note that it was possible to manually adjust the brightness of the LEDs. We found that the LEDs were
Figure 6. The examples that show the integration between the virtual transparent display and its physical counterpart. The examples were made when the virtual mobile crane was using the 4.8-tonne counterweight and lifting a 1-tonne load. The left image shows the boom length was 19 m, the load radius was 14 m, and the lifting capacity was 20% used. The right image shows that the boom length was 36 m, the load radius was 30 m, and the lifting capacity was 90% used.
quite bright for indoor environments, thus we decided to use only 10% of the brightness in this study.
The left image in Figure 6 shows that the boom length and the load radius of the virtual mobile crane were respec-tively 19 m and 14 m. The lifting capacity for that state of boom length and load radius was 6.3 tonnes. Since the virtual mobile crane was lifting a 1-tonne load, the lifting capacity was 15.87% used. Based on the setting of the virtual transparent display, which is described in Section 3.1.3, the first two rows of LEDs from the bottom were turned on.
Similar to the previous example, the right image in Fig-ure 6 shows that the boom length and the load radius of the virtual mobile crane were respectively 36 m and 30 m. The lifting capacity for that state of boom length and load radius was 1.2 tonnes. Since the virtual mobile crane was lifting a load with the same weight, the lifting capacity was 83.3% used, and thus the first nine rows of LEDs from the bottom were turned on.
5
Conclusion and Future Work
In this paper, we have developed a prototype that con-sisted of a virtual transparent display and its physical coun-terpart. The kinds of information were shown and how they were visualized were determined based on the result of our earlier study [5]. The virtual transparent display was hosted in a mobile crane simulation developed in the Unity game engine, which was a modified version of an available mobile crane simulation. The physical transpar-ent display was made using off-the-shelves items, such as
glasses, LEDs, super glues, insulated copper wires, and an Arduino to control which LEDs that should be turned on or turned off. The virtual transparent display was con-nected with its physical counterpart using an asset called Uduino, which enabled the Unity game engine to com-municate with Arduino. The information shown on the prototype was not arbitrary, as the relevant data were im-ported from the official load charts, and the information was shown based on the run-time state of the virtual mo-bile crane, which are in contrast to the prototype developed by Kvalberg [11]. The developed prototype in this study was shown to be functioning as what we intended.
The study in this paper was limited to the development of the virtual transparent display and its counterpart. Due to the ongoing pandemic situation, we were unable to in-volve mobile crane operators to obtain their feedback on the developed prototype. In the future, the developed pro-totype would be evaluated in two possible settings. The first setting is where we could evaluate the physical trans-parent display in real mobile cranes using the Wizard-of-Oz method [22], where another person would control the virtual mobile crane, while trying to mimic what the oper-ator is doing when performing lifting operations using the real mobile crane. According to the operator’s view, the information presented on the physical transparent display would appear to resemble the status of the real mobile crane. Therefore, it would still be possible to carry out the evaluation without actually using or modifying any exist-ing system in the mobile crane. However, we nonetheless need to adapt the lifting capacity in the simulation accord-ing to the load chart of the real mobile crane that would
be used, thus the presented information remains relevant for the operator. The second setting is to conduct a user evaluation in the mixed reality environment, where the transparent display is physical, but the environment is vir-tual and projected to the wall, similar to the mixed reality setup used by Wallmyr et al. [23]. In this case, we need to further modify the virtual environment in the simula-tion, thus the lifting scenario inside the simulation could resemble the real-world scenario.
Finally, the information shown using the virtual trans-parent display and its physical counterpart in this study was based on the LTC 1050-3.1 crane and its official load charts. It is possible to use a different mobile crane model as the use case, given that the 3D model that resembles such mobile crane and its official load charts are available. The proposed approach could also be modified and ap-plied to excavators, since excavators also have the concept of lifting capacity and load charts provided by manufac-turers [24].
6
Acknowledgments
This research has received funding from the European Union’s Horizon 2020 research and innovation programme under the Marie Skłodowska-Curie grant agreement num-ber 764951.
References
[1] Yihai Fang, Yong K. Cho, and Jingdao Chen. A framework for real-time pro-active safety assistance for mobile crane lifting operations. Automation in Construction, 72:367 – 379, December 2016. ISSN 0926-5805. doi:10.1016/j.autcon.2016.08.025. [2] Yihai Fang, Yong K. Cho, Frank Durso, and Jongwon
Seo. Assessment of operator’s situation awareness for smart operation of mobile cranes. Automation in Construction, 85:65 – 75, January 2018. ISSN 0926-5805. doi:10.1016/j.autcon.2017.10.007. [3] Richard L. Neitzel, Noah S. Seixas, and Kyle K.
Ren. A review of crane safety in the construction industry. Applied Occupational and Environmen-tal Hygiene, 16(12):1106–1117, November 2001. doi:10.1080/10473220127411.
[4] M. F. Milazzo, G. Ancione, V. Spasojevic Brkic, and D. Valis. Investigation of crane operation safety by analysing main accident causes. In Lesley Walls, Matthew Revie, and Tim Bedford, editors, Risk, Re-liability and Safety: Innovating Theory and Practice, pages 74–80. Taylor and Francis, London, UK, 2017. ISBN 9781138029972.
[5] Taufik Akbar Sitompul, Rikard Lindell, Markus Wallmyr, and Antti Siren. Presenting informa-tion closer to mobile crane operators’ line of sight: Designing and evaluating visualization con-cepts based on transparent displays. In Proceed-ings of Graphics Interface Conference 2020, GI ’20, Toronto, Canada, 2020. Canadian Human-Computer Communications Society. URL https: //openreview.net/pdf?id=WWxviNxYwoc. [6] Taufik Akbar Sitompul and Markus Wallmyr.
Us-ing augmented reality to improve productivity and safety for heavy machinery operators: State of the art. In the 17th International Conference on Virtual-Reality Continuum and Its Applications in Indus-try, VRCAI ’19, New York, USA, 2019. ACM. doi:10.1145/3359997.3365689.
[7] Javier Santana-Fernández, Jaime Gómez Gil, and Laura Del-Pozo-San-Cirilo. Design and implemen-tation of a GPS guidance system for agricultural trac-tors using augmented reality technology. Sensors, 10 (11):10435–10447, 2010. doi:10.3390/s101110435. [8] Tuomo Palonen, Heikki Hyyti, and Arto Visala. Augmented reality in forest machine cabin. IFAC-PapersOnLine, 50(1):5410 – 5417, 2017. doi:10.1016/j.ifacol.2017.08.1075. 20th IFAC World Congress.
[9] Michael E Rakauskas, Nicholas J Ward, Alec R Gor-jestani, Craig R Shankwitz, and Max Donath. Evalu-ation of a dgps driver assistive system for snowplows and emergency vehicles. In International Conference of Traffic and Transport Psychology, pages 257–272, Nottingham, UK, 2005. Elsevier.
[10] Martin Englund, Hagos Lundström, Torbjörn Brunberg, and Björn Löfgren. Utvärder-ing av head-up display för visnUtvärder-ing av apter-ingsinformation i slutavverkning. Technical report, Skogforsk, 2015. URL https:// www.skogforsk.se/cd48e530/contentassets/ 710b3f2be7a340bd87f4841c72ee302f/ utvardering-av-head-up-display-for- visning-av-apteringsinformation-i- slutavverkning.arbetsrapport-869-2015-1.pdf.
[11] Jonas Loe Kvalberg. Head-up display in driller and crane cabin. Master’s thesis, Norwegian University of Science and Technology, 2010. URL http:// hdl.handle.net/11250/260185.
[12] Álvaro Segura, Aitor Moreno, Gino Brunetti, and Thomas Henn. Interaction and ergonomics issues
in the development of a mixed reality construc-tion machinery simulator for safety training. In In-ternational Conference on Ergonomics and Health Aspects of Work with Computers, pages 290–299, Berlin, Germany, 2007. Springer. doi:10.1007/978-3-540-73333-1_36.
[13] Phillip Tretten, Anita Gärling, Rickard Nilsson, and Tobias C. Larsson. An on-road study of head-up display: Preferred location and acceptance levels. Proceedings of the Human Factors and Ergonomics Society Annual Meeting, 55(1):1914–1918, 2011. doi:10.1177/1071181311551398.
[14] Adi Abileah, Kari Harkonen, Arto Pakkala, and Gerald Smid. Transparent electroluminescent (EL) displays. Technical report, Planar Systems, 1 2008. URL https://www.planar.com/blog/2008/ 3/27/transparent-electroluminescent-display-whitepaper.
[15] Unity Asset Store. Crane simulator v.2 (designer), 2020. URL https://assetstore.unity.com/
packages/3d/vehicles/land/crane-simulator-v-2-designer-150285.
[16] Liebherr. Technical data - compact crane ltc 1050-3.1, 2019. URL https://www.liebherr.com/ external/products/products-assets/ 916432/liebherr-260-ltc-1050-3-1-td-260-00-\defisr11-2019.pdf.
[17] Safe Work Australia. General guide
for cranes, December 2015. URL
www.safeworkaustralia.gov.au/system/ files/documents/1703/general-guide-for-cranes.pdf.
[18] Labour Department. Code of practice for safe use of mobile cranes, September 2017. URL https://www.labour.gov.hk/eng/public/os/ B/MobileCrane.pdf.
[19] Worldsemi. WS2812b intelligent control led integrated light source. URL https://cdn-shop.adafruit.com/datasheets/WS2812B.pdf. [20] FastLED Animation Library. Fast, easy LED library
for Arduino. URL http://fastled.io/.
[21] Unity Asset Store. Uduino - arduino and unity communication, simple, fast and stable, may 2020. URL https://assetstore.unity.com/ packages/tools/input-management/uduino- arduino-and-unity-communication-simple-fast-and-stable-78402.
[22] Aaron Steinfeld, Odest Chadwicke Jenkins, and Brian Scassellati. The oz of wizard: Simulat-ing the human for interaction research. In Pro-ceedings of the 4th ACM/IEEE International Con-ference on Human Robot Interaction, HRI ’09, page 101–108, New York, USA, 2009. ACM. doi:10.1145/1514095.1514115.
[23] Markus Wallmyr, Taufik Akbar Sitompul, Tobias Holstein, and Rikard Lindell. Evaluating mixed real-ity notifications to support excavator operator aware-ness. In Human-Computer Interaction – INTERACT 2019, pages 743–762, Cham, Switzerland, 2019. Springer. doi:10.1007/978-3-030-29381-9_44. [24] Strategic Forum for Construction. Lifting
opera-tions with excavators, 5 2008. URL https:// www.cpa.uk.net/sfpsgpublications.
![Figure 1. The transparent display prototype for off- off-shore cranes that was made by Kvalberg [11]](https://thumb-eu.123doks.com/thumbv2/5dokorg/4878331.133360/2.892.453.778.151.542/figure-transparent-display-prototype-shore-cranes-kvalberg.webp)