Advanced driving simulator to
evaluate sound design strategies
for intelligent transport systems
ViP publication 2011-3
Authors
Johan Fagerlönn, Interactive Institute Anders Andersson, VTI
Preface
Advanced Driving Simulator to Evaluate Sound Design Strategies for Intelligent
Transport Systems is a collaborative project between Scania, VTI (the Swedish National
Road and Transport Research Institute) and the Interactive Institute within the
competence centre Virtual Prototyping and Assessment by Simulation (ViP). ViP unifies both companies and authorities within the Swedish transport sector. The main goal is to unify the Swedish competence in the field of transport related real-time simulation with a special focus on HMI applications.
The present ViP project has been divided in two parts. One part considers the
implementation of a new audio system in one of the advanced simulators at VTI. The system is designed to meet the requirements of researchers and practitioners
investigating the relationships between the perception of auditory signals in vehicles and driver behaviour.
In a second part, an advanced driving simulator was used to investigate how drivers of commercial vehicles may be negatively affected by urgent in-vehicle warnings. The investigation was carried out as a joint activity between ViP and one part of a research project performed in collaboration between Scania CV AB, the Interactive Institute and Luleå University of Technology (LTU). The undertaken simulator experiment also constituted a test of the reliability of the new audio system.
The project was co-funded by Vinnova and Scania (PhD project at Interactive Institute) and ViP.
Project participants from Scania were Hanna Johansson (project manager), Robert Friberg (industrial supervisor), Josefin Nilsson (industrial supervisor) and Anna Svensson (industrial supervisor).
Project participants from Interactive Institute were Johan Fagerlönn (PhD student, researcher), Stefan Lindberg (sound designer), Katarina Delsing (administrator), Mats Liljedahl (software designer) and Björn Kempén (software designer).
Project participants from VTI were Anders Andersson (research engineer, project manager at VTI), Anne Bolling (investigator), Anders Genell (researcher) and Håkan Sehammar (research engineer).
Håkan Alm at Luleå University of Technology was the academic supervisor of the PhD student.
Piteå, March 2011
Quality review
Peer review was performed in January 2011 by Pontus Larsson (Volvo Technology) and in February 2011 by Mikael Ögren (VTI). Johan Fagerlönn has made alterations to the final manuscript of the report. The ViP Director Lena Nilsson examined and approved the report for publication on 14 April 2011.
Table of contents
Executive summary ... 5
1 Introduction ... 7
1.1 Aims ... 7
1.1.1 Implementation of an audio system in the Scania truck cabin ... 7
1.1.2 Simulator experiment to evaluate negative effects of urgent warnings .... 7
1.2 Project activities ... 8
1.2.1 The audio system ... 8
1.2.2 The simulator experiment ... 8
1.3 The simulator ... 8
2 Part 1. The audio system ... 9
2.1 System requirements ... 9
2.1.1 Speaker system ... 9
2.1.2 Open audio software ... 9
2.1.3 Control over the system from the simulator control podium ... 9
2.1.4 Possibility to handle both audio files and streamed audio... 9
2.1.5 Possibility of simulating objects in movement ... 10
2.2 Technical implementation ... 10
2.2.1 Hardware ... 10
2.2.2 Software ... 11
2.2.3 Placement of technical equipment ... 13
2.3 System calibration ... 13
2.4 System evaluation ... 14
2.4.1 System latency ... 14
2.4.2 System reliability ... 14
2.5 Conclusions and benefits for ViP ... 15
3 Part 2. The simulator experiment ... 17
3.1 Background ... 17
3.1.1 Aims ... 17
3.2 Methodology ... 17
3.2.1 Participants ... 17
3.2.2 Apparatus and stimulus ... 18
3.2.3 Critical driving situations ... 19
3.2.4 Design, procedure and measures ... 20
3.2.5 Dependent measures ... 21
3.3 Results and discussion ... 21
3.3.1 Subjective ratings ... 21
3.3.2 Brake response ... 22
3.4 Conclusion and recommendations for future work ... 24
References ... 25
Advanced Driving Simulator to Evaluate Sound Design Strategies for Intelligent Transport Systems
Johan Fagerlönn
Interactive Institute – Sonic Studio Acusticum 4
941 28 Piteå Sweden Anders Andersson
Swedish National Road and Transport Research Institute (VTI) Olaus Magnus väg 35
583 30 Linköping Sweden Mats Liljedahl
Interactive Institute – Sonic Studio Acusticum 4
941 28 Piteå Sweden
Executive summary
Additional sound capabilities in visually advanced simulators may offer researchers and practitioners better resources to evaluate in-vehicle auditory signals and advanced auditory displays. In the first part of the present report, the implementation of a new audio system in the Scania truck cabin for the driving simulators II and III (VTI, March 2011) at the Swedish National Road and Transport Research Institute (VTI) is described. The new system is designed to make it easier to use the advanced driving simulators to study effects of in-vehicle auditory signals on drivers and traffic safety. It includes both new software and new hardware. The new audio software is based on the Open Audio Library (OpenAL) implementation for the Macintosh Operating System OS X. It communicates with the existing simulator software using the Open Sound Control (OSC) standard. The remaining program code is open, which offers the possibility of adapting the audio system to future demands and specific needs of partners within the competence centre ViP (Virtual Prototyping and Assessment by
Simulation). The new audio software contains a simple visual interface that can be used to set up, test and calibrate auditory cues inside the cabin at an early stage of a project. In terms of hardware, six new loudspeakers have been installed in the truck cabin. This speaker setup can be used to simulate sound sources in various spatial positions around the driver. Special consideration was taken regarding the placement of the loudspeakers inside the cabin in order not to make them disturbing to the drivers. Additionally, even though the audio system was especially designed for the simulation of ADASs, the functionality was implemented to prepare the system for presentation of other sound sources in the driver environment. Another aim of the present project was to investigate the potential of urgent alarms to raise annoyance and negatively affect drivers’ subsequent responses to unrelated, critical events on the road. While performing a simulated driving task, truck drivers received two types of warnings that were designed to differ significantly in perceived urgency. Several times in the trial an unexpected event occurred just seconds after drivers were presented with an unrelated warning, and the drivers had to brake immediately to avoid a collision. The results indicate that acoustic characteristics and semantic meaning may impact the perceived annoyance of in-vehicle warnings. Furthermore, the participants who received a high-urgency warning braked
significantly harder and tended to brake later than the drivers who received a low-urgency warning.
The simulator study was also used to validate the reliability of the new audio system. In summary, the new audio system worked reliably during all 24 trials. However, more extended validations should be carried out in the future to investigate the exact accuracy of the system in representing signals in specific spatial directions.
1
Introduction
The development of Advanced Driver Assistance Systems (ADASs) is often associated with high expectations of their potential to increase traffic safety. However, systems that inform, assist or take over the control of the vehicle may also contribute to perceptual and cognitive driver distraction. This, in turn, can lead to more dangerous driving behaviour and increase the risk of traffic accidents. Driver distraction may be especially problematic in urgent, unusual and in other ways challenging situations that already put high demands on the drivers’ resources. In such situations, the effectiveness of a system relies not only on the interplay between the driver and the system, but also on the drivers’ capability to take in and process the information while simultaneously performing the driving task.
Visually based solutions, which make the driver shift visual focus from the road scene, might not be appropriate in these situations. Systems that allow the driver to maintain visual focus on the road, such as auditory-based solutions, can potentially be more effective from a safety point of view. Today, ADASs use auditory signals to catch drivers’ attention. Future solutions may make use of the full potential of sound to direct attention and give drivers information. Furthermore, future studies may aim at examining advanced multi-modal solutions in which spatial auditory cues are combined with visual displays and tactile cues.
Advanced driving simulators allow researchers to study new technical solutions in a safe and controlled setting. Advanced simulators can monitor a variety of driver responses related to performance and traffic safety. These qualities make the advanced simulator an appropriate platform for traffic safety evaluations. Additional sound capabilities in visually advanced simulators can offer researchers new possibilities for evaluating sound design strategies for ADASs. Audio systems that can be used to simulate auditory signals from ADASs in the driving environment may bring new possibilities for researchers and developers investigating correlations between auditory stimuli and driver responses and behaviours.
1.1
Aims
The present ViP project had two main objectives:
Designing an audio system and implementing it in the simulator environment Investigating driver effects of urgent auditory warnings
1.1.1 Implementation of an audio system in the Scania truck cabin
One project objective was to design and implement an appropriate sound control and
reproduction system in the Scania truck cabin for use in the VTI driving simulators II and III at VTI in Linköping (VTI, March 2011). The system was designed to make it easier for
researchers and practitioners within ViP, who intend to examine auditory solutions for ADASs and the potential of the systems to affect drivers and traffic safety.
1.1.2 Simulator experiment to evaluate negative effects of urgent warnings The second project objective was to investigate the potential of urgent auditory warnings to raise annoyance and negatively affect drivers’ responses to subsequent unpredictable events on the road ahead. The results of the simulator experiment have been reported at a scientific conference (Fagerlönn, 2010). Additionally, an extended article has been accepted for publication in the scientific journal IET Intelligent Transport Systems (Fagerlönn, in press). The aim of the experiment was not to evaluate the potential of the new audio system.
However, the new audio system was used in the experiment, which offered the possibility of testing the reliability of the audio system in a real driving experiment.
1.2
Project activities
1.2.1 The audio system
All ViP members were invited to take part in a workshop that was held at VTI in Linköping in May 2009. Members from Scania CV AB, the Interactive Institute, VTI and HiQ participated. The purpose of the workshop was to allow all interested ViP partners to take part in the project start-up and contribute ideas and suggestions for the new sound system. At the workshop, the participants examined the driving simulator, the Scania truck cabin, and the existing sound reproduction system. After that, the participants discussed requirements that should be considered in the system design and implementation.
The design and implementation of the audio system was carried out from May to September 2009. The calibration and evaluation of the system was performed from June to October 2009. The analysis of the results regarding the audio system was carried out from September to December 2009.
1.2.2 The simulator experiment
The simulator experiment layout was planned from April to July 2009. The experiment was conducted in September 2009 and the analysis of results from the simulator experiment was carried out between October and December 2009.
1.3
The simulator
The present work was carried out in the Scania truck cabin mounted in the VTI driving simulator III (VTI, March 2011). This advanced simulator has a motion system and a vibration table that can simulate acceleration forces and a variety of road conditions. The virtual traffic scene is projected on three screens covering 120 degrees of the visual field. A cabin from either a passenger car or a truck can be mounted on the simulator rig. Parts of the audio system hardware implemented in the present project were installed in the truck cabin. The truck cabin can be moved between VTI driving simulator III and II.
The VTI driving simulator III was already equipped with an audio system that simulates engine noise. There was also a multi-channel audio system available that can be used for auditory signals from ADASs. However, this system does not allow developers and researchers to easily calibrate, position and control auditory stimuli inside the cabin. If experimenters need to play a sound in a specific spatial direction using the audio system, a speaker needs to be installed at the position where a sound should be played. This offers limited possibilities for researchers and practitioners intending to test auditory stimuli. Installing and calibrating audio equipment for every individual study is time consuming and use up project resources. This may be problematic, especially in studies that involve the simulation of several sound sources.
2
Part 1. The audio system
2.1
System requirements
After the initial workshop in May 2009, a number of design decisions for the new audio system were taken. The decisions relate to the functionality of the new audio system, how the system can be prepared for future adoptions and areas of use, and also how the system should be implemented in the simulator to minimise negative effects on the driving experience. 2.1.1 Speaker system
Auditory signals may be presented in an experimental setting using either loudspeakers or headphones. One decision made was not to use headphones for the new audio system. The reason for this decision was that drivers do not commonly wear headphones during real driving. The unnaturalness of using headphones could potentially have a negative impact on the realism of the driving experience. Therefore, it was decided to implement a system based on multiple loudspeakers mounted inside the cabin. However, bulky loudspeakers or the inappropriate mounting of speakers inside the cabin could also have a negative impact on the driving experience. This might be problematic because the speakers will be mounted inside the cabin and present during all kinds of experiments. Therefore, it was decided that the system would use small loudspeakers and that considerations would be made regarding the placements of the loudspeakers so that they would not be an impediment to drivers.
2.1.2 Open audio software
One option for a new audio system would be to buy a license for an established system (software and hardware) on the market. However, such a solution does not allow developers within ViP to modify the software for specific needs or to freely adjust the software for future requirements. A more “open” software, in which ViP partners have access to the program source code, offers significantly more control. It was therefore decided that the new software should be as open as possible. Additionally, by avoiding a licensed product, potentially expensive licensing costs could be avoided. However, one issue with using an open source solution compared to a licensed product is that the technical support may be limited. 2.1.3 Control over the system from the simulator control podium
The existing simulator software can be controlled by experimenters and engineers from a control podium in the simulator facilities. This possibility is practical, for instance, when something goes wrong during a trial; the experimenter can troubleshoot and restart the systems. Therefore, it is important that also the new audio software could be controlled from the control podium.
2.1.4 Possibility to handle both audio files and streamed audio
When auditory signals from ADASs are investigated, the audio software needs to be able to play sound files. However, in future use of the audio system one might want to use the audio system for other types of sound sources as well, e.g. engine noise and wind noise. These sounds may be generated in other simulator software but played using the audio software. To make such usage possible, the audio system must be able to play streamed audio in addition to audio files. It was therefore decided that this first version of the system must be able to
2.1.5 Possibility of simulating objects in movement
Future studies may want to investigate not only positioned sound sources but also moving sound sources (e.g. warning signals that change position to indicate a moving direction of a danger). Additionally, a future use of the system might be to simulate moving objects in a traffic environment, such as other vehicles. One decision was therefore that the system should be able to simulate moving sound sources.
2.2
Technical implementation
Implementation of the audio system hardware and software was carried out based on the design requirements stated in the project.
2.2.1 Hardware
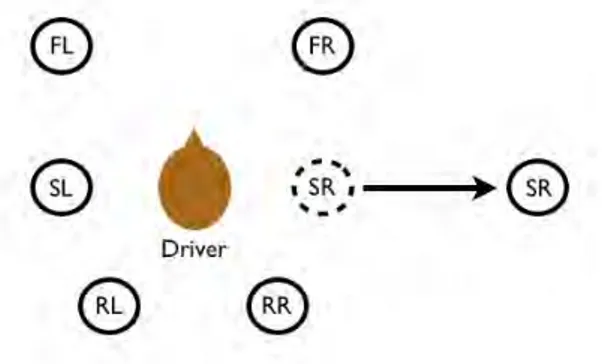
A new 6.0 speaker setup was bought and implemented inside the truck cabin, see Figure 1. The 6.0 setup means that the system uses six loudspeakers but no bass speaker (subwoofer). The speakers, Anthony Gallo Nucleus Micro (Anthony Gallo Acoustics Inc, USA), were selected because they are small (10.16 cm in diameter) and should have little impact on the drivers’ driving experience. In addition, all speakers were mounted in positions such that they would not disturb the driver or obscure the visual scene while driving. Two speakers were mounted in front of the driver, in compartments above the windshield. Two speakers were mounted on either side of the driver and two speakers were mounted behind the driver. The speaker on the right side of the driver was particularly challenging to mount. One option would have been to place this speaker in the ceiling on the driver’s right side, at the same distance from the driver as the other speakers. However, a speaker mounted in such a position in the cabin (in approximately the same height as the other speakers) could potentially have a negative impact on the drivers’ driving experience. It was therefore decided to mount this speaker on the cabin’s right wall. The result is, however, that this speaker was mounted considerably farther away from the driver’s position compared to the other five speakers. Six layers of a fibre-based (plastic) material (total thickness of about 1.5 cm) were mounted behind all six speakers to reduce unnecessary reflections.
Figure 1 Overview of the loudspeaker setup. F=Front, S=Side, R=Rear, L=Left, R =Right. The right side loudspeaker was mounted on the right wall in the truck cabin forming a non-optimal speaker setup.
Despite the small loudspeakers, no bass speaker (subwoofer) was implemented. The reason for this was that the system is primarily designed to handle auditory signals from ADASs, and these types of signals typically do not have a lot of important low frequency content. It was therefore decided to implement a system without a bass speaker. However, the 6.0 speaker
system can easily be complemented with a bass speaker to form a 6.1 system if other types of sound sources are to be simulated.
The speakers are powered by a Harman/Kardon AVR 255 amplifier (Harman/Kardon, USA). The audio software runs on a Macintosh Mini with a 2.0 GHz Intel Core 2 Duo processor and 1 GB Random Access Memory (Apple Inc, USA). The computer communicates with the amplifier via an M-Audio Profire 610 audio interface (M-Audio, USA).
2.2.2 Software
The Interactive institute and VTI developed new software for the new audio system. The new audio software, which is referred to as the audio engine, is based on the Open Audio Library (OpenAL). Opting for this solution made it possible to implement audio software within the project that is open and free to use and modify by members within ViP. However, the audio engine is based on the OpenAL implementation for the Macintosh operating system OS X. The application runs on the Macintosh operating system (10.5 or above). Therefore, the present version of the software needs to run on a Macintosh computer. There was simply not enough time to adapt the software code to other operating systems within the scope of the present project. However, the audio engine can communicate with other applications running on other operating systems using Open Sound Control (OSC) messages that are sent over an IP-network.
OpenAL
The audio engine is built on the Open Audio Library (OpenAL) system. OpenAL is an open source and cross-platform 3D audio API that can be used to create multichannel and 3D positioned sound in computer applications. The library models a collection of sound sources, moving in a 3D space and heard by a single listener in that space. That is, OpenAL can be used to simulate both stationary and moving sound sources in the 3D space. However, the most prominent limitations of the OpenAL system are that it primarily uses volume balancing to create the 3D audio position effects. This means that the system does not use more
advanced techniques such as head-related transfer functions (HRTF), which makes it virtually impossible to hear any other difference in a sound's elevation dimension (up/down) than differences in intensity due to varying distance to the sound source. Also, there is no
functionality to simulate reverberation and acoustic room effects produced by the reflections of sound waves from walls, floor, ceiling, furniture etc. in real environments.
Sound Events
The audio engine very much builds on the concept of “Sound Events”. A Sound Event is a named entity that contains information about which sound should be played and where in the 3D space the sound should be played. More specifically, the sound event contains a pointer to a specific sound file or sound stream and a position in a 3D space (X, Y and Z). The listener’s position is always at the point 0,0,0. The X-dimension represents the position of the sound source in the left/right dimension. The Y-dimension represents the position of the sound source in the up/down dimension, and the Z dimension represents the position of the sound source in the front/back dimension. Using the X, Y and Z dimensions, a sound source can theoretically be simulated in any spatial position around the listener. However, as previously described, the Y-dimension (up/down) will not be well reproduced by OpenAL.
Visual interface
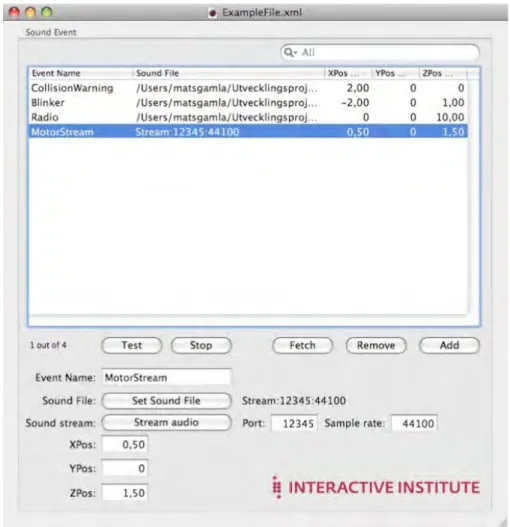
Sound Events can be created, edited and deleted using a simple visual interface, see Figure 2. A Sound Event Document is an Xtensible Markup Language (XML) file that stores
information about several Sound Events. A user can easily create a new Sound Event
Document by using the “New” and “Open” commands in the “File-menu”. The Sound Event Document shown in Figure 2 is titled ExampleFile.xml, which is indicated at the very top of the interface window.
Figure 2 The visual interface used to create, edit and delete Sound Events.
The visual interface is divided into three main parts. The upper part contains a list of available Sound Events that are included in the particular Sound Event Document. In the middle part of the interface a user can create, delete and test Sound Events. In the lower part a user can name the Sound Event, decide on which audio file the event should trigger, and enter a default spatial position for the sound source. If the Sound Event points to an audio stream, instead of an audio file, the user can set the User Datagram Protocol (UDP) port to receive the stream as well as the sampling frequency of the stream.
Communication using the OSC standard
The audio engine can receive messages from other applications over an Internet Protocol (IP) network using the Open Sound Control (OSC) protocol. The OSC message sent to the audio engine application should contain information about which Sound Event to trigger. The
message can also hold arguments regarding the spatial position of the sound. If no arguments regarding the position are specified in the OSC message the audio engine will use the default position for the sound source specified in the Sound Event Document. The standard OSC message to trigger a Sound Event is formulated like this: “/playSoundEvent, eventName, X, Y, Z”. The eventName argument is the name of the Sound Event to trigger. X, Y and Z are the arguments that indicate the position in the 3D space where the sound should be played.
Supported file formats
The audio engine handles sound files in the .wav and .aiff formats. No specific sample frequency is required. The application handles both mono sound files and stereo sound files, but in different ways. Mono files can be positioned in the 3D space by using X, Y and Z coordinates, whilst stereo files cannot be positioned. Instead, stereo files will be played “as they are” without any further spatial manipulation. Sound streams handled by the audio engine must be of the format that .wav and. aiff files use with a bit depth of 16 bit. The sample rate may vary, but it has to be a one channel audio stream (mono). The audio engine cannot handle other formats of streamed audio.
2.2.3 Placement of technical equipment
One aspect that had to be considered during the implementation phase was where to place the audio system hardware, including the Macintosh computer. One of the system requirements was that it should be possible to control the audio system from the simulator control podium. It was decided to place all the technical equipment in the simulator rig, and control the audio engine from the control podium using a “remote desktop” solution. The solution means that only one network cable was needed between the control podium and the simulator rig. Experimenters and engineers can then control the OS X operating system and the audio engine from the control podium. The technical equipment was mounted on top of the simulator rig so that it would be easy to access, reboot, and move between simulator rigs.
2.3
System calibration
After the audio system (software and hardware) had been installed a calibration of the loudspeaker system was carried out. The calibration was performed by using the built-in, automated calibration tool in the Harman/Kardon amplifier, which is referred to as the EzSet/EQ calibration utility. The EzSet/EQ technology is designed to tune the system to the acoustics of the listening room. When using this function a microphone is placed in the listener’s sitting position. EzSet/EQ then measures the frequency response peaks and dips in the listening room and applies a compensating equalization curve. EzSet/EQ also calibrates loudspeaker output levels and delay times. Fine adjustments were carried out manually after the automatic calibration. As described above, the right side speaker was placed far away from the listening position compared to the other speakers. Consequently, it was challenging to find an optimal sound setting in the cabin using the settings in the amplifier. The final settings were considered to be at least good enough for the purpose of the audio system. The final settings for the amplifier’s output levels were: front left speaker = -4 dB, front right speaker = -7 dB, left side speaker = -8dB, right side speaker = +2 dB, left rear speaker = -9 dB, right rear speaker = -9 dB.
2.4
System evaluation
Three people, not directly involved in the system implementation, were invited to take part in a small informal evaluation of the audio system. In the evaluation, sounds were played in various spatial positions in the truck cabin and the participants were required to write down the direction from which they perceived the sound. The sounds were played in eight directions around the participant. The results showed that the participants were able to perceive a correct spatial direction almost every time. However, the system seemed to present the sounds in somewhat diffuse spatial directions. A closer investigation of the output levels for each of the six channels in the audio interface revealed a potential issue. When a sound is positioned in one particular direction most sound is played from the loudspeakers near that direction. However, some level of sound is always played in other output channels as well, which in turn makes the spatial directions slightly diffuse. The software engineers involved in the project tried to solve this rather unexplained issue. It was finally concluded that the OpenAL implementation used by the OS X operating system applies an acoustic effect to the output audio. That is, it seems as the system tries to simulate some amount of room acoustics by default, in a bid to make sounds in computer applications and games more realistic. Effects on such a low level are outside the control of the audio engine designers involved in the project. The exact size of the acoustic effect was not measured or further evaluated within the present project.
2.4.1 System latency
System latency (from message to sound activation) is of importance for simulator experiments that intend to investigate response times. No tests of latency were conducted during the
implementation of the new audio system. However, the latency from message to sound activation will depend primarily on propagation times in the network used for data
communication and message handling response times in the computers used. Normally the total latency from message to sound activation should be in the order of 1–10 ms.
2.4.2 System reliability
Concerning the reliability of the implemented audio system one critical point was to
investigate whether the new technical equipment installed on the simulator rig, especially the computer, would be able to function reliably during the acceleration forces and shakings that are present in a simulator trial. Also, testing the system in several trials would be a good way to reveal any unforeseen problems, such as software bugs.
The reliability of the audio system was tested during both pilot trials and real trials in the simulator experiment conducted within the ViP project (described in Part 2 of this report). This experiment was ideal for reliability testing of the new audio system because each trial involved a number of hard braking manoeuvres with strong acceleration forces. No problems with the audio software were revealed during the pilot trials. Thus, it was decided to use the new audio system in the main experiment, where the system was used to trigger warning signals in two types of critical driving situations. The simulator software sent OSC messages to the Audio Engine to trigger a specific auditory warning in a spatial direction. In total, 24 simulator trials were completed (each trial lasted about 30 minutes). The results are easily summarised; the whole audio system, including hardware, software and the communication between the audio system and the simulator software worked without errors during all 24 trials.
2.5
Conclusions and benefits for ViP
In the reported ViP project a new audio system was installed in the Scania truck cabin in the VTI simulator III (VTI, March 2011). The truck cabin and the audio system can also be moved to the VTI driving simulator II (VTI, March 2011). The new audio system was implemented to meet the requirements of studies that intend to examine ADASs that communicate with drivers using auditory signals. The previous audio system allowed
researchers and practitioners to simulate sound sources inside the truck cabin. However, with the old system a separate loudspeaker had to be installed inside the cabin at the position of the intended sound source. Using the new audio system, researchers and practitioners can easily position and calibrate many sound sources in the drivers’ environment directly from the simulator control podium, without implementing any hardware or conducting time-consuming calibrations. Furthermore, ViP partners can use the built-in visual interface to implement, test and calibrate their audio signals in the vehicle cabin early on in a project. The possibilities offered by the new audio system can save both time and project resources in future
experiments, especially in projects that attempt to simulate many sound sources and complex multi-modal solutions in the truck cabin.
The implemented audio system includes both new software and new hardware. The use of headphones was avoided because it could potentially have a negative effect on the realism of the driving experience. Instead, a total of six small loudspeakers were mounted inside the truck cabin.
The new software used to generate sounds is based on the cross-platform audio API OpenAL. This solution offers a range of advantages. The API is free to use and offers the functionality aimed for within the scope of the project. The program code developed in the project is freely available for ViP partners, which offers possibilities to adapt the software for future needs and new areas of application for the audio system.
The new audio system was especially adapted for the simulation of audio signals from ADASs. For instance, no bass speaker (subwoofer) was installed in the cabin because such auditory signals do typically not contain important low-frequency content. However, a number of design considerations were implemented to make the system more adaptable to new areas of
application. The software was programmed to handle streamed audio in addition to audio files. This makes it easier for future adoptions of the software to handle sounds such as engine and wind noise. Additionally, the OpenAL implementation offers the possibility to simulate moving sources, such as other road users moving in the traffic environment. Further development of an audio system that can be used for a broad area of applications has already been initiated in another ViP project, “Sound generator of a driving simulator”, see the ViP web site (ViP, March 2011) for more information. This project aims at designing an audio and vibration playback system that can simulate a broad variety of sound sources, such as power train, tire/road, surrounding traffic, infotainment/driver assistance systems.
To test the reliability of the developed audio system, it was used in a simulator experiment including 24 trials. No concerns were reported regarding the reliability or functionality during the trials. The project time frame did not allow any extended validation of the audio system’s ability to accurately simulate spatial directions within the truck cabin. A smaller informal evaluation was performed with promising results, but an extended validation should be considered in the future. Furthermore, future studies should investigate the latency of the system (from message to sound activation). Such latency is of importance for studies that intend to investigate response times. Also, the acoustic effect found, which the OpenAL system produces, should be measured and investigated in more detail in future evaluations.
One potential limitation of the implemented audio system is that the software is based on the OpenAL implementation for the Macintosh operating system OS X. The reason for this choice was that the Interactive Institute, which designed parts of the audio software, had already developed much of the software for OS X. However, the fact that the system runs on a Macintosh computer is not necessarily a problem. The software can receive commands using the Open Sound Control standard; messages can be sent over the IP network from any
application. However, developers within ViP do not necessarily have the knowledge to design applications for OS X, or they may have other reasons to install the system on Unix, Linux or Windows machines. ViP partners who attempt to implement the system on machines other than Macintosh will have to port the software code for the OpenAL implementation for the particular operating system. The new ViP project, “Sound generator of a driving simulator”, aims at designing an audio system that will be adaptable to any existing or future simulator at any ViP partner; see the ViP web site (ViP, March 2011) for more information.
3
Part 2. The simulator experiment
3.1
Background
Sound may be especially useful in critical driving situations, because auditory cues have unique advantages for events that require rapid responses. Human hearing is omni-directional and cannot be shut off involuntarily, whereas visual warnings must be seen in order to be effective warnings (Haas & Edworthy, 2006). Also, auditory signals allow drivers to stay focused on the road, which might be advantageous in visually demanding driving situations. Previous research has shown that acoustic parameters that make auditory signals sound urgent are likely to make the sounds more annoying (Tan & Lerner, 1995; Wiese & Lee, 2004; Marshall et al., 2007). However, annoyance of sound may also depend on semantic and contextual factors (Fucci et al., 1997; Ellermeier et al., 2004; McKeown, 2005). Thus, since annoyance cannot be predicted by acoustic properties alone, it is important to study
annoyance of in-vehicle warnings in realistic settings. To date, few studies have focused on both the urgency and annoyance of auditory warnings in vehicles.
Higher urgency could also raise drivers’ stress levels, which in turn could impact their ability to detect and react to changes in the traffic environment. Perceived urgency represents an increased level of threat or a sense of time pressure that can provoke stress-induced arousal. An established effect of stress and high arousal levels is attentional narrowing (Wickens & Hollands, 1999; Staal, 2004); in other words, the individual’s focus of attention shrinks, and he or she focuses on critical issues and elements (Kowalski-Trakofler et al., 2003). Chapman and Underwood (1998), for instance, investigated the visual behaviour of drivers who
observed driving situations with different levels of danger. They found that more dangerous (arousing) situations were “characterised by a narrowing of visual search, shown by an increase in fixation duration, a decrease in saccade angular distances, and a reduction in the variance of fixation locations”.
3.1.1 Aims
To find optimal auditory warnings for ADASs for commercial vehicles, we need to learn more about the negative consequences of auditory warnings within the driving context. The aim of the present simulator experiment was to investigate the potential of urgent alarms to raise annoyance and negatively affect drivers’ responses to unpredictable events on the road. The experiment had a specific focus on commercial drivers and the following two research questions were addressed:
1. Will a warning signal with a higher level of psychoacoustic urgency (conveyed by acoustic parameters), as compared to a warning with a lower level of urgency, be perceived as more annoying by commercial truck drivers?
2. Will a warning signal with a higher level of psychoacoustic urgency, as compared to a warning with a lower level of urgency, have a more negative effect on the drivers’ ability to respond to a subsequent, unrelated event on the road ahead?
3.2
Methodology
3.2.1 Participants
Twenty-four truck drivers (3 females) between the ages of 23 and 70 years (M=43.3,
SD=13.1) participated in the experiment. Their years of truck driving experience ranged from 1 to 46 years (M=20.9, SD=12.9), and they reported an annual driving distance between
15,000 and 150,000 km (M=90,218, SD=3,838). The participants’ hearing was not tested. However, they all reported normal hearing.
3.2.2 Apparatus and stimulus
The study was conducted in the VTI driving simulator III (VTI, March 2011) with a Scania truck cabin. The new audio system implemented in the truck cabin (see Part 1 of the present report) was used for the generation of auditory stimuli. The experiment included two auditory warning signals, both designed to warn drivers about pedestrians near the roadside. The warnings were played in the spatial direction of the critical events. They started with a brief (300-ms) verbal message, “pedestrians”, which was presented in Swedish by a female voice. The speech message was followed by one of two 1500-ms tone bursts that were designed to differ significantly in urgency (high-urgency or low-urgency). The acoustic parameters speed, pitch, amplitude onset and offset, and signal level were used to make the tone bursts differ in terms of urgency.
Faster auditory warnings may be perceived as more urgent (Edworthy et al., 1991; Haas &
Casali, 1993; Marshall et al., 2007). The low-urgency warning consisted of 2 pulses with a 300-ms inter-pulse interval. The high-urgency sound consisted of 8 pulses, which were played in a constant tempo with 10-ms inter-pulse intervals.
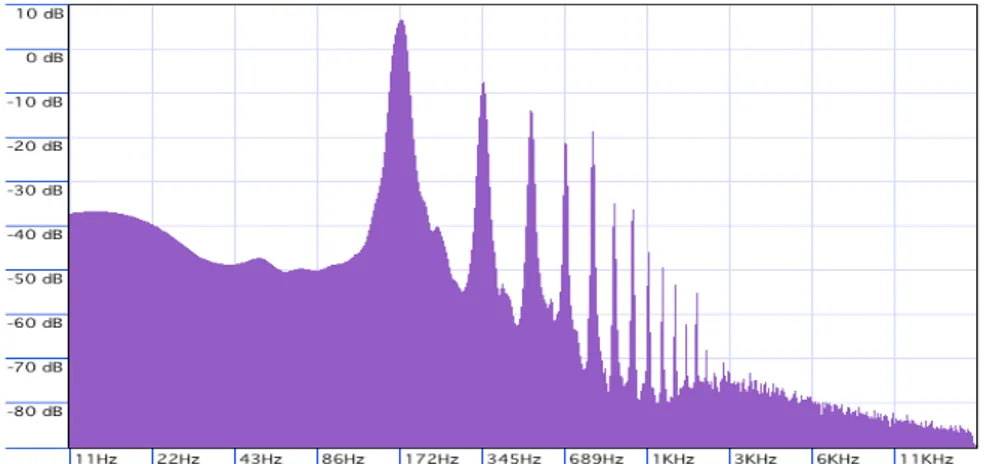
High-pitched signals have been reported to amplify urgency (Edworthy et al., 1991; Hellier et
al., 1993; Haas & Edworthy, 1996). Figures 3 and 4 present the frequency characteristics of the pulses in the low-urgency and high- urgency warnings, respectively. The low-urgency warning had a base frequency of 179 Hz (G3). The high-urgency warning contained a number of tones with the following base frequencies: 491 Hz (B4), 522 Hz (C5), 554 Hz (C#5), 1046 Hz (C6) and 1974 Hz (B6).
Shorter amplitude onset and offset may increase urgency (Haas & Edworthy, 1996; Marshall
et al., 2007). The amplitude onset and offset times of the low-urgency warning were 300 ms and 450 ms, respectively, and the onset and offset times of the high-urgency warning were 25 ms and 210 ms, respectively.
Also, higher signal levels have been reported to increase perceived urgency (Haas & Casali, 1993; Haas & Edworthy, 1996). The signal levels (sound pressure levels on the dBA scale; fast-weighted, maximum value, measured at the position of the drivers’ head) of the warnings were calibrated to 80 dBA for the low-urgency warning and 85 dBA for the high-urgency warning. The background engine noise was 64 dBA (fast-weighted, maximum value) at the drivers’ position at 50/km driving speed.
Figure 3 Frequency characteristics of the pulses in the low-urgency warning.
Figure 4 Frequency characteristics of the pulses in the high-urgency warning.
3.2.3 Critical driving situations
Two critical driving situations were designed for the experiment. In each situation the drivers first received a warning about pedestrians standing at the roadside. A few seconds after the warning a subsequent critical unrelated event occurred and the drivers needed to brake immediately to avoid a collision.
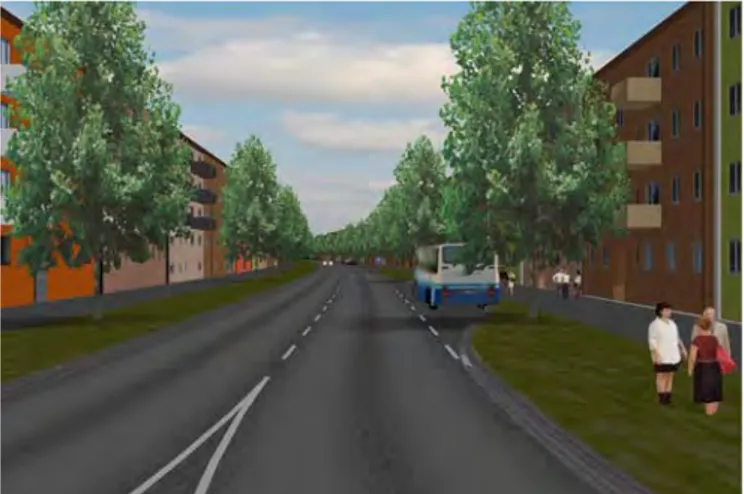
In the “bus situation” the drivers received a warning for the presence of pedestrians about 2 meters from the roadside and approximately 20 meters from a parked bus (see Figure 5). The pedestrians stood in a small group and seemed to be interacting with each other. The
pedestrians did not move and there was no reason for the drivers to brake for them. When the drivers passed the pedestrians the bus started to pull out in front of the truck. This situation forced the drivers to brake immediately to avoid a collision.
In the “car situation” (shown in Figure 6) the truck was heading an intersection with a small group of people standing near a pedestrian crossing. The drivers received a warning about the pedestrians. Just as the truck entered the intersection, a passenger car approached at high speed from the right and the drivers were required to brake to avoid a collision.
Figure 5 The bus situation: Drivers received a warning about the pedestrians standing to the right. Moments later the bus pulled out in front of the truck.
Figure 6 The car situation: Drivers received a warning about pedestrians standing near an intersection with a pedestrian crossing. When the drivers entered the intersection a passenger car approached at high speed from the right.
3.2.4 Design, procedure and measures
We used a within-subjects design, in which all the drivers received both types of warnings in both driving situations. The order of warnings was counterbalanced to minimise order effects. The drivers were told that they were participating in a test of an in-vehicle warning system designed to warn them about potential dangers in the traffic environment. However, they were not informed of the study’s specific research questions at that point.
The driving session started with the participants driving a practice scenario that lasted for about 8 minutes and gave the drivers a chance to familiarise themselves with the simulator. Then the participants performed the main driving task, i.e. drove the real test route consisting of a mixture of rural and urban roads. The test route was driven once which took 25–30 minutes. The participants were told to drive normally and not to exceed the speed limits. While completing the test route, every driver passed a total of 8 buses and 18 intersections. Each critical event (bus situation and car situation) occurred 3 times: once after a high-urgency warning, once after a low-high-urgency warning and once without any warning. The participants were not instructed what to do in response to the warnings.
After the driving session, the participants completed a questionnaire that investigated how they perceived the sounds and whether they expected the critical situations (see Appendix 1). After completing the questionnaire, we reviewed the specific research questions, and the drivers were able to ask any questions about the experiment and the research project. 3.2.5 Dependent measures
The critical situations were designed so that the drivers had to brake to avoid a collision. Participant brake response time and brake response force (brake pressure) were therefore the main dependent variables. We defined the brake response time for the bus situation as the time that elapsed between the bus starting to pull out and the driver starting to brake. We defined the brake response time for the car situation as the time that elapsed between the car becoming visible and the driver starting to brake. We defined brake response force as the maximum brake pressure level measured by the simulator’s brake system. Secondary dependent variables measured during the trials were: speed, throttle activity, longitudinal acceleration force, lateral acceleration force, steering angle, and lateral position. The driving parameters were sampled with 50 Hz during the critical situations.
In the post-trial questionnaire the participants rated annoyance and perceived alarm for both the high-urgency and the low-urgency warnings (see Appendix 1). Questions included in the questionnaire were “Were you alarmed by the high-urgency / low-urgency warning?” and “Did you find the high-urgency / low-urgency warning annoying?” In addition, the participants were asked questions about the realism of the driving task and whether they expected the critical situations. For instance, “Were you prepared for the bus to pull out the first time the situation occurred?” and “Were you prepared for the bus to pull out the last time the situation occurred?” The participants answered by using rating scales ranging from 1 (not at all annoying / alarming / prepared) to 7 (very annoying / alarming / prepared).
3.3
Results and discussion
3.3.1 Subjective ratings
Table 1 shows the mean values of the subjective ratings. A total of 13 drivers (54%) rated the high-urgency warning as more annoying than the low-urgency warning. A two-tailed paired t-test showed that the difference was significant (t(23)=2.94, p=0.007). Also, 9 drivers (38%) rated both warnings as equally annoying, and 2 drivers (8%) rated the low-urgency warning as more annoying. The drivers who rated the high-urgency warning as equally or less annoying than the low-urgency warning tended to give the more urgent warning a low score (M=3.0, SD=1.66).
A total of 12 drivers (50%) rated the high-urgency warning as more alarming. The difference between the conditions was significant (t(23)=3.14, p=0.005, two-tailed). Only one driver rated the low-urgency warning as more alarming, while 11 drivers rated the warnings as equally alarming. Similar to the annoyance ratings, the drivers who considered the high-urgency warning equally or less alarming than the low-high-urgency warning tended to give the warnings low scores (M=2.69, SD=1.70).
The correlation between the ratings of annoyance and “perceived alarm response” was significant for both the high-urgency warning (r =0.60, p<0.05, two-tailed) and the low-urgency warning (r =0.57, p<0.05, two-tailed).
Another interesting result found was that the rated annoyance was negatively correlated with driver experience (years of driving) for both the high-urgency warning (r =-0.41, p<0.05, two-tailed) and the low-urgency warning (r =-0.43, p<0.05, two-two-tailed).
Table 1 Subjective ratings, mean (SD), of annoyance and perceived alarm, n=24.
High urgency Low urgency Annoying, 1–7 4.42 (1.84) 3.42 (1.56) Alarming, 1–7 3.71 (1.88) 2.71 (1.60)
In summary, the results support previous findings that the acoustic parameters that amplify warning signal urgency also increase annoyance. The results suggest that the design of non-speech auditory warnings for commercial vehicles should take into account both annoyance and urgency. A sound’s annoying potential is especially important for the design of low-urgency and everyday situations or situations with a high risk of false and nuisance alarms. Block et al. (1999), for instance, reported that false alarms are the most common reason for operators turning off the volume of technical systems. Signals that are perceived as unpleasant are likely to become annoying when the frequency of false alarms is high. Interestingly, however, the differences in subjective ratings were not particularly large. Based on the significant differences in the warnings’ acoustic properties, larger effects were expected. In fact, a large proportion of the drivers rated both warnings as equally annoying and alarming. One explanation for these results is that both the warning’s acoustical properties and its meaning influenced the drivers. Although the signals differed in acoustic characteristics, their function was the same. In urgency ratings, the semantic meaning of auditory warnings has been reported to override acoustic characteristics (Burt et al., 1995; Guillaume et al., 2002; Fagerlönn, in press). One argument for this effect in the present investigation is that the drivers tended to give the high-urgency warning low scores rather than giving the low-urgency warning high scores. The warnings did not indicate a particularly urgent driving situation, and therefore, the low scores for the high-urgency warning make sense. Another possible contributing factor to the low scores could be that the drivers, many of whom were experienced, did not find any of the sounds particularly distracting. That is, maybe the warnings did not have any important negative impact on their ability to handle the driving situation, which in turn affected their annoyance ratings. Interestingly, rated annoyance was negatively correlated with driver experience (years of driving) for both types of warnings. 3.3.2 Brake response
Unfortunately, there was a severe loss of data in the car situation. There was an issue with the timing for that situation and several drivers did not see or brake for the car at all. Therefore, the car situation was excluded from any analysis.
In the bus situation, all of the drivers braked for the bus and avoided a collision in the critical situations. Table 2 shows the resulting brake performance. Two-tailed, paired t-tests failed to show significant effects for any of the dependent variables.
Table 2 Brake response time and maximum brake pressure for the bus situation, mean (SD), n=24.
High urgency Low urgency Response time (ms) 1441 (381) 1352 (284) Max brake pressure (bar) 4.50 (2.33) 3.76 (1.79)
However, the drivers responded more slowly in the first bus situation (M=1559 ms, SD=320 ms) than in the last bus situation (M=1233 ms, SD=269 ms). A two-tailed, paired t-test showed that the difference was significant (t(23)=3.63, p=0.001). Also, the participants rated the last critical situation as considerably more expected (M=5.33, SD=1.40) than the first critical situation (M=3.46, SD=1.93). A decision was therefore made to examine the results from the first situations in more detail.
Table 3 presents brake response time and maximum brake pressure for the first critical bus situation. The drivers who received an urgent warning in the first situation tended to brake more slowly (M=1637 ms, SD=370 ms) than the drivers who received a low-urgency warning (M=1482 ms, SD=251 ms), but the difference was not statistically significant (t(22)=1.20, p=0.24, two-tailed). The drivers who received an urgent warning in the first situation braked harder than the drivers who received a low-urgency warning. Normal distribution of data was not assumed. A two-tailed Mann-Whitney U-test and a two-tailed independent samples t-test showed that the difference was significant (U=113, n1=n2=12, p<0.05; t(22)=2.43, p<0.05,
two-tailed). The correlation (negative) between the response time and maximum brake pressure was significant (r =-0.52, p<0.01, two-tailed).
Table 3 Brake response time and maximum brake pressure, mean (SD), in the first critical bus situation, n=12.
High urgency Low urgency Response time (ms) 1637 (370) 1482 (251) Max brake pressure (bar) 6.06 (2.05) 4.23 (1.74)
In summary, the analysis of brake behaviour did not reveal a significant effect of level of urgency on brake response time. The drivers who received the high-urgency warning in the first critical situation (bus) tended to brake later; however, there were large differences between the participants, and we found no significant effect. It has been claimed that people tend to narrow their attention in stressful situations (Wickens & Hollands, 1999; Staal, 2004). Therefore, a significant effect on response time to the subsequent unrelated event (the bus) was expected. However, the results might have been different in a study with novice and ordinary car drivers. Chapman and Underwood (1998) reported that novice drivers showed longer fixation durations than experienced drivers in critical traffic situations, which indicates that they are less able to share their attention when situations become threatening. Therefore, we recommend that future studies examine the effects of urgent warnings on less experienced drivers.
However, the drivers who received the high-urgency warning braked significantly harder than the drivers who received the low-urgency warning. It could be argued that the more forceful reactions resulted from higher arousal levels (Jaśkowski et al., 1995) or a stimulus-response
compatibility (Ulrich & Mattes, 1996). The correlation between maximum brake pressure and response time indicates that some drivers tried to compensate for late brake responses by braking harder.
Another interesting result of the experiment was that none of the truck drivers made any inappropriate reactions, such as braking without reason, to the auditory signals. Previous research has reported that urgent signals may cause drivers to respond inappropriately to high-urgency warnings (Graham, 1999). Our findings indicate that commercial truck drivers take their time and assess the road situation before responding to an auditory warning.
3.4
Conclusion and recommendations for future work
The first research question under investigation in the present study was: ”Will a warning signal with a higher level of psychoacoustic urgency (conveyed by acoustic parameters), as compared to a warning with a lower level of urgency, be perceived as more annoying by commercial truck drivers?” The results of the evaluation indicate that rated annoyance depends on acoustic properties. However, it seems that acoustic properties alone cannot predict annoyance ratings of auditory warnings presented in commercial vehicles. A sound’s semantic meaning can also have a major impact on annoyance. That is, a driver’s rating of a signal as annoying or not depends on the situation that the warning indicates. The results also indicate that individual factors, related to driving experience, may influence rated annoyance associated with warning signals.
The second research question under investigation in the present study was: ”Will a warning signal with a higher level of psychoacoustic urgency, as compared to a warning with a lower level of urgency, have a more negative effect on the drivers’ ability to respond to a
subsequent, unrelated event on the road ahead?” The results showed no significant effect on brake response time but a significant effect on brake response force. The drivers who received a more urgent warning braked significantly harder for the subsequent unpredictable event in the first bus situation. The results of brake response time might have been different with less experienced drivers. Future research should investigate the distracting effects of warning signals on less experienced and novice drivers.
One limitation of the present experiment is related to the auditory warnings that were used. The combination of speech and tone bursts is not a common combination in real-world systems. In addition, the experiment did not provide much information about drivers’
perceptions of auditory warnings or their impact on performance as the drivers adjust to them. The results observed in a 25-minute driving test do not allow us to make conclusions about long-term effects and habituation.
References
Block, F. E., Nuutinen, L. & Ballast, B. (1999). Optimization of alarms: a study on alarm limits, alarm sounds, and false alarms, intended to reduce annoyance. Journal of Clinical Monitoring and Computing, Vol. 15, pp. 75–83.
Burt, J. L., Bartolome, D. S, Burdette, D. W. & Comstoc, J. R. (1995). A psychophysiological evaluation of the perceived urgency of warning signals. Ergonomics, Vol. 38, No. 11, pp. 2327–2340.
Chapman, P. R. & Underwood, G. (1998). Visual search of driving situations: Danger and experience. Perception, Vol. 27, pp. 951–964.
Edworthy, J., Loxley, S. & Dennis, I. (1991). Improving Auditory Warning Design:
Relationship between Warning Sound Parameters and Perceived Urgency. Human Factors, Vol. 33, No. 2, pp. 205–231.
Ellermeier, W., Zeitler, A. & Fastl, H. (2004). Predicting annoyance judgements from psychoacoustic metrics: Identifiable versus neutral sounds. Proceedings of the 33rd International Congress and Exposition on Noise Control Engineering, Prague, Czech Republic, 2004.
Fagerlönn, J. (2010). Distracting effects of auditory warnings on experienced drivers.
Proceedings of 16th International Conference on Auditory Display (ICAD 2010), Washington DC, USA, 2010.
Fagerlönn, J. (In press). Urgent alarms in trucks: effects on annoyance and subsequent driving performance. IET Intelligent Transport Systems.
Fucci, D., Petrosino, L., Hallowell, B., Andra, L. & Wilcox, C. (1997). Magnitude estimation scaling of annoyance in response to rock music: Effects of sex and listeners preference. Perceptual and Motor Skills, Vol. 8, No. 4, pp. 663–670.
Graham, R. (1999). Use of auditory icons as emergency warnings: evaluation within a vehicle collision avoidance application. Ergonomics, Vol. 42, No. 9, pp. 1233–1248.
Guillaume, A., Drake, C., Rivenez, M., Pellieux, L. & Chastres, V. (2002). Perception of urgency and alarm design. Proceedings of 8th International Conference on Auditory Display (ICAD 2002), Kyoto, Japan, 2002.
Haas, E. C. & Casali, J. G. (1993). The perceived urgency and detection time of multi-tone and frequency modulated warning signals. Proceedings of the Human Factors and
Ergonomics Society 37th annual meeting, Santa Monica, CA, USA, 1993.
Haas, E. C. & Edworthy, J. (1996). Designing urgency into auditory warnings using pitch, speed and loudness. Computing & Control Engineering Journal, Vol. 7, No. 4, pp. 193–198. Haas, E. & Edworthy, J. (2006). An introduction to auditory warnings and alarms. In: M. S. Wogalter (Ed.) Handbook of Warnings (1st edition). Lawrence Eribaum Associates Inc, pp. 107–122.
Hellier, E. J., Edworthy, J. & Dennis, I. (1993). Improving auditory warning design:
quantifying and predicting the effects of different warning parameters on perceived urgency. Human Factors, Vol. 35, No. 4, pp. 693–706.
Jaśkowski, P. J., Rybarczyk, K., Jaroszyk, F. & Lemański, D. (1995). The effect of stimulus intensity on force output in simple reaction task in humans. Acta Neurobiol. Exp., Vol. 55, No. 1, pp. 57–64.
Kowalski-Trakofler, K. M., Vaught, C. & Scharf, T. (2003). Judgment and decision making under stress: an overview for emergency managers. Int. J. Emergency Management, Vol. 1, No. 3, pp. 278–289.
Marshall, D. C., Lee, J. D. & Albert Austria, P. (2007). Alerts for in-vehicle information systems: annoyance, urgency and appropriateness. Human Factors, Vol. 49, No. 1, pp. 145– 157.
McKeown, D. (2005). Candidates for within-vehicle auditory displays. Proceedings of 11th International Conference on Auditory Display (ICAD 2005), Limerick, Irland, 2005. Staal, M. A. (2004). Stress, Cognition, and Human Performance: A literature review and Conceptual Framework. Ames Research Center, 2004.
Tan, A. K. & Lerner, N. D. (1995). Multiple attribute evaluation of auditory warning signals for in-vehicle crash avoidance systems. National Highway Traffic Safety Administration – Office of Crash Avoidance Research, Washington DC, USA, 1995.
Ulrich, R. & Mattes, S. (1996). Does immediate arousal enhance response force in simple RT? QJ Exp. Psychol., Vol. 49A, No. 4, pp. 972–990.
Wickens, C. D. & Hollands, J. G. (1999). Engineering Psychology and Human Performance (3rd edition), Prentice Hall, 1999.
Wiese, E. E. & Lee, J. D. (2004). Auditory alerts for in-vehicle information systems: The effects of temporal conflict and sound parameters on driver attitudes and performance. Ergonomics, Vol. 47, No. 9, pp. 965-986.
ViP (March 2011). Competence Centre for Virtual Prototyping and Assessment by Simulation, http://www.vipsimulation.se, accessed March 2011.
VTI (March 2011). Swedish National Road and Transport Research Institute, http://www.vti.se/simulator, accessed March 2011.
ViP Ljuddesign
Bakgrundsfrågor
Fp
nr:____
1. Vilket år är du född? ______________________
2. Vilket år tog du lastbilskörkort? _______________________
3. Hur många mil med lastbil kör du per år? _____________________
4. I vilken trafikmiljö kör du oftast? Landsvägskörning ________________
Stadskörning_____________
Hur skulle du beskriva dig som förare och hur du kör?
Skatta mellan 1 och 7 på varje aspekt nedan
1 2 3 4 5 6 7 Dålig Bra Långsam Snabb Ängslig Lugn Försiktig Risktagande Tveksam Bestämd Koncentrerad Lättdistraherad Nervös Trygg Defensiv Offensiv Uppmärksam Ouppmärksam God framförhållning Impulsiv
Roligt Tråkigt
Så ofta du kan Endast nödvändigtvis
Appendix 1 Page 1/3
ViP Ljuddesign
Frågor efter körning.
Fp nr:____
1. Hur realistisk upplevde du vägmiljön?
Mycket orealistisk 1 2 3 4 5 6 7 Mycket realistisk
2. Tyckte du att varningarna kom vid realistiska tillfällen?
Mycket orealistiska 1 2 3 4 5 6 7 Mycket realistiska
3. Tyckte du att den mindre kritiska varningen var besvärande?
Inte alls besvärande 1 2 3 4 5 6 7 Mycket besvärande
4. Blev du skrämd av den mindre kritiska varningen?
Inte alls skrämd 1 2 3 4 5 6 7 Mycket skrämd
5. Tyckte du att den kritiska varningen var besvärande?
Inte alls besvärande 1 2 3 4 5 6 7 Mycket besvärande
6. Blev du skrämd av den kritiska varningen?
Inte alls skrämd 1 2 3 4 5 6 7 Mycket skrämd
7. Tror du att du reagerade annorlunda med olika varningsljud?
Inte alls annorlunda 1 2 3 4 5 6 7 Mycket annorlunda
Appendix 1 Page 2/3
ViP Ljuddesign
8. Var du beredd på att en buss skulle köra ut framför dig första gången det inträffade?
Inte alls beredd 1 2 3 4 5 6 7 Mycket beredd
9. Var du beredd på att en buss skulle köra ut framför dig sista gången det inträffade?
Inte alls beredd 1 2 3 4 5 6 7 Mycket beredd
10. Var du beredd på att en bil skulle köra ut framför dig första gången det inträffade?
Inte alls beredd 1 2 3 4 5 6 7 Mycket beredd
11. Var du beredd på att en bil skulle köra ut framför dig sista gången det inträffade?
Inte alls beredd 1 2 3 4 5 6 7 Mycket beredd
Appendix 1 Page 3/3
ViP
Virtual Prototyping and Assessment by Simulation
ViP is a joint initiative for development and application of driving
sim-ulator methodology with a focus on the interaction between humans and
technology (driver and vehicle and/or traffi c environment). ViP aims at
unifying the extended but distributed Swedish competence in the fi eld of
transport related real-time simulation by building and using a common
simulator platform for extended co-operation, competence development
and knowledge transfer. Thereby strengthen Swedish competitiveness
and support prospective and effi cient (costs, lead times) innovation and
product development by enabling to explore and assess future vehicle
and infrastructure solutions already today.
Centre of Excellence at VTI funded by Vinnova and ViP partners