VTI notat 8A-2019
Published 2020
www.vti.se/en/publications
Emission reductions and costs of abatement
measures for air pollutants and
greenhouse gases from shipping
Selected measures with importance for
the Swedish Environmental Quality Objectives
Kristina Holmgren
VTI notat 8A-2019
|
Emission r
eductions and costs of abatement measur
es for air pollutants and gr
VTI notat 8A-2019
Emission reductions and costs of
abatement measures for air pollutants
and greenhouse gases from shipping
Selected measures with importance for the Swedish
Environmental Quality Objectives
Author: Kristina Holmgren, VTI, http://orcid.org/0000-0003-2080-7947 Reg.No., VTI: 2017/0352-7.4
Publication No.: VTI notat 8A-2019
Cover pictures: Andy Li/Unsplash and Chris Pagan/Unsplash Published by VTI, 2020
Foreword
Shipping is a major source of emissions of harmful air pollutants and greenhouse gas emissions. The purpose of the "Carrots and sticks" project was to identify the policy instruments and measures that can reduce air emissions from shipping and contribute to the fulfilment of the Swedish environmental quality objectives Reduced climate impact, Clean Air, Natural acidification only and Zero
eutrophication in a cost-effective way. The project has been carried out by a research team from the Swedish National Road and Transport Research Institute (VTI) and the University of Gothenburg (GU) between the end of 2017 and the beginning of 2020.
During that period several things happened that had a significant impact on the project:
(1) The Swedish environmental quality objectives were revised and comprise, except for the climate goal, no longer quantitative targets. The International Maritime Organization (IMO) agreed on a goal to reduce the greenhouse gas emissions from international shipping by at least 50 percent by 2050, as compared to the 2008 level.
(2) Sweden’s official statistics on air emissions from shipping were improved using data from the Automatic information system (AIS). The "Carrots and sticks" applied a similar AIS-based approach to calculate the emissions and compared the outcome, as far as possible, to the official statistics that were published in the end of 2019. See Trosvik et al. (2020).
(3) The Swedish Transport Administration commissioned a study on emission factors for sea transports that are supposed to be used in the Swedish CBA guidelines. This study (Carlsson et al, 2019) was published in august 2019. The "Carrots and sticks" project used emission factors from the literature and compared them to the emission factors in Carlsson et al. (2019). See data set A and B in Holmgren (2020).
(4) The Swedish Maritime Administration appointed VTI to evaluate the impacts of the in 2018 revised fairway dues, see Johansson et al. (2020). The "Carrots and sticks" project used the results regarding port calls and environmental discounts derived in this study. See Vierth (2020).
A summary of Trosvik et al. (2020), Holmgren (2020) and Vierth (2020) is available in Vierth et al. (2020), which includes results and recommendations from the three reports.
The authors would like to thank the participants of the reference group, Sofi Holmin-Fridell (Swedish Maritime Administration), Leif Holmberg and Per Andersson (Swedish Environmental Protection Agency), Katarina Wigler (Swedish Transport Agency), Björn Garberg (Swedish Transport
Administration), Helena Leander and Katarina Händel (Swedish Energy Agency), Christine Hanefalk (Ports of Sweden), Åsa Burman (Lighthouse), Fredrik Larsson (Swedish Shipowners´ Association), Christer Ågren (Air Pollution and Climate Secretariat) and Siri Strandenes (Norwegian School of Economics NHH) for their contributions. We especially thank Siri and Christer for valuable comments on earlier versions of our reports.
Furthermore, we thank the Swedish Transport Administration and Sweden’s Innovation Agency (Vinnova) for funding the project.
Stockholm, March 2020
Inge Vierth Project leader
Quality review
Internal peer review was performed on 15 March 2020 by Nina Svensson. Kristina Holmgren has made alterations to the final manuscript of the report. The research director Mattias Haraldsson examined and approved the report for publication on 19 March 2020. The conclusions and recommendations expressed are the author’s and do not necessarily reflect VTI’s opinion as an authority. Kevin Cullinane, University of Gothenburg has proofread the script.
Kvalitetsgranskning
Intern granskning har genomförts 16 mars 2020 av Nina Svensson. Kristina Holmgren har genomfört justeringar av slutligt rapportmanus. Forskningschef Mattias Haraldsson har därefter granskat och godkänt publikationen för publicering 19 mars 2020. De slutsatser och rekommendationer som uttrycks är författarens egna och speglar inte nödvändigtvis myndigheten VTI:s uppfattning. Kevin Cullinane, Göteborgs universitet har språkgranskat manuset.
Table o
f contents
Summary ...7 Sammanfattning ...9 1. Introduction ...11 1.1. Background ...11 1.2. Objectives...11 1.3. Delimitations ...11 1.4. Report outline ...12 2. Method ...13 2.1. Abatement costs ...132.2. Selection of abatement measures ...14
2.3. Emission reductions ...14
2.4. The use of representative vessels and data sets ...15
2.5. Sensitivity analysis ...16
3. Description of abatement measures, assumptions and data for calculations ...17
3.1. Emission levels and regulations for emission abatement in shipping ...17
3.1.1. Emissions of sulphur from shipping and related regulation...18
3.1.2. Emissions of nitrous oxides from shipping and related regulation ...20
3.1.3. Emissions of PM and related regulation ...22
3.1.4. Emissions of greenhouse gases and related regulation ...22
3.1.5. Background on selected abatement measures ...24
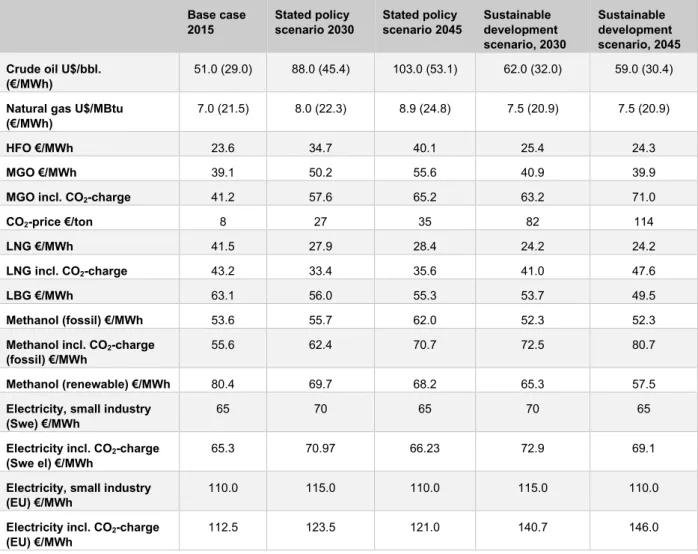
3.2. Economic parameters and fuel prices ...30
3.3. Emission factors and related parameters ...31
3.4. Representative vessels ...35
3.5. Assumptions for specific abatement measures...39
3.5.1. Onshore Power supply (OPS) ...39
3.5.2. Fuel switch and full electrification (alternative energy carriers) ...42
3.5.3. SCR ...45
3.5.4. Energy efficiency measures and wind power ...46
3.5.5. Speed reduction/ slow steaming ...49
4. Results ...51
4.1. Onshore power supply ...51
4.2. Fuel switches and full electrification ...54
4.3. SCR ...64
4.4. Energy efficiency measures and wind power ...65
4.5. Speed reduction/slow steaming ...69
5. Discussion and Conclusions ...70
5.1. Discussion and conclusion of emission reductions and abatement cost calculations ...70
5.2. Uncertainties and delimitations ...75
References ...77
Nomenclature
CH4 Methane
CO2 Carbon dioxide
CO2eq CO2 equivalents
CO2eq. incl. air pollutants CO2 equivalents including the climate impact of air pollutants
DME Dimethyl Ether
EGR Exhaust Gas Recirculation
ECA Emission Control Area
EQO Environmental Quality Objectives
GHG Greenhouse gas
GWP Global Warming Potential
HFO Heavy fuel oil
IMO International Maritime Organisation
LBG Liquid biogas
LFO Light Fuel Oil
LNG Liquid Natural Gas
MDO Marine Diesel Oil
MeOH Methanol
MGO Marine Gas Oil
MVA Mega Volt Ampere
NOX Nitrous oxides
N2O (Di)nitrous oxide
PM Particulate Matter
PM10 Particulate matter of a size ≤ 10 µm
PM2.5 Particulate matter of a size ≤ 2.5 µm
RPM Revolutions per minute
SCR Selective Catalytic Reduction
SDS Sustainable Development Scenario
SO2 Sulphur dioxide
STEPS Stated policy scenario
TTP Tank-to-propeller
WTT Well-to-tank
Summary
Emission reductions and costs of abatement measures for air pollutants and greenhouse gases from shipping – Selected measures with importance for the Swedish Environmental Quality Objectives by Kristina Holmgren (VTI)
This report is part of the Carrot and Sticks project which has the overall objective to analyse policy instruments and measures that most cost-effectively can reduce air emissions from maritime transport in Sweden. The objective of the study presented in this report is to assess cost estimates for abatement options for measures reducing air emissions of Sulphur dioxide (SO2), nitrous oxides (NOX), particular matter (PM)
and greenhouse gases (GHGs) from shipping, along with estimates of emission reductions. The emission reductions in turn contribute to the fulfilment of the Swedish Environmental Quality Objectives; Clean Air,
Natural Acidification Only, Zero Eutrophication and Reduced Climate Impact. The results in this report are
used as input in a simplified cost-benefit analysis, that is used to derive policy recommendations (see Vierth (2020)).
A selection of measures that can reduce air emissions from shipping impacting the Swedish Environmental Quality Objectives related to air emissions are analysed in terms of emission reductions and costs for shipowners. The time perspectives for the reductions are focused on 2030 and 2045, but also consider costs in the base case 2015. The analysed abatement measures are:
• Fuel switches, from MGO (Marine Gas oil) to LNG (liquified natural gas), LGB (liquified biogas), fossil and renewable methanol
• Full electrification by rechargeable batteries • Onshore power supply (OPS)
• Selective Catalytic Reduction (SCR) • Wind power (by Flettner rotors)
• Energy efficiency measures including advanced route planning, optimized propeller, slender hull, and hybridization
• Speed reduction
The cost calculations are made from a shipowner’s perspective, including investment costs for installing the abatement technology on the ship, changed operational and maintenance costs and, in many cases, cost savings due to reduced fuel consumption. Associated costs that are (not obviously) taken by the shipowner/ operator are not included. Costs per year are calculated for a base- case 2015 with cost estimates and fuel prices for 2015 and for four future fuel price scenarios for 2030 and 2045, based on projections for fossil fuel prices by the International Energy Agency.
Cost calculations are made for two sets of representative vessels and emission factors, representing both a tank-to-propeller (TTP) and a well-to-propeller (WTP) perspective. The impact on climate targets are
analysed by considering CO2 alone and by summarising the greenhouse gas emissions (carbon dioxide (CO2),
methane (CH4) and nitrous oxide (N2O)) in terms of their global warming potential (GWP100). There are also
calculations where the all the considered air pollutants are summarised together with the greenhouse gases using GWPs, but these should be considered as indicative due to the higher uncertainty in the GWP values for the non-greenhouse gases. The results including GWP summarised air pollutants and are not used for further policy analysis.
The results of this study show that fuel switches to renewable fuels (LBG and renewable methanol) and full electrification are very effective abatement measures when it comes to the reduction of the air emissions
from shipping. However, fuel switches to LNG and fossil methanol have lower abatement costs (than the switches to the corresponding renewable fuels and full electrification) in the base-case 2015 but also under the future fuel price scenarios 2030 and 2045 unless a CO2 cost is introduced in the shipping sector, which is
assumed to correspond to the including of the shipping sector in the EU Emissions Trading System (EU ETS) for greenhouse gases. With a CO2 cost for the shipping sector in 2030 and 2045 LBG can be a
profitable abatement option.
The results show that switching to LNG will lead to increased climate impact when considering both CO2
and CH4 emissions, both in a tank-to propeller (TTP) and a well-to-propeller (WTP) perspective. This is due
to the high methane slip in marine engines. Also, switching to fossil methanol will result in a net increase in CO2-equivalents in the WTP perspective. According to the fuel price scenarios, the switch to LNG will be
profitable in the future. Thus, in order to mitigate the increase of climate impact, measures should be taken to reduce methane emissions both in marine engines and in the production and distribution chain of the fuel. Many of the energy efficiency measures and the Flettner rotors have negative abatement costs in many of the fuel price scenarios. Speed reduction has a significant potential to reduce air emissions from each ship (and for fleets) and costs are negative for most cases.
Although the results from the two different data sets gave somewhat different results for the costs and emission reductions for OPS, they both showed that RoPaxes have the best conditions for using onshore power supply (OPS). Cruise vessels use a high share of their fuel consumption at berth for electricity production and local air pollutants could be reduced significantly in the ports if these ships can use OPS. At the 2015- year price level, SCR had the lowest specific NOX reduction cost among the measures that
specifically aim at reducing NOX (i.e. SCR, Fuel switches and full electrification), followed by fuel switch to
LNG. Since the cost for switching to LNG will be lower in the future (according to the results) this will be a cheaper alternative in the future.
The analysis shows that N2O has a small impact on the overall results, whereas CH4 significantly impacts the
results for LNG and LBG. The focus for the shipping sector should be on CO2 and CH4 for the greenhouse
Sammanfattning
Emissionsreduktioner och kostnader för åtgärder som minskar utsläppen av luftföroreningar och växthusgaser från sjöfarten – ett urval av åtgärder med betydelse för de svenska miljökvalitetsmålen av Kristina Holmgren (VTI)
Denna rapport är en del av forskningsprojektet Morötter och Piskor som har som syfte att analysera
styrmedel och åtgärder som på ett kostnadseffektivt sätt kan minska sjöfartens emissioner till luft. Syftet med studien är att sammanställa och beräkna kostnader för åtgärder som minskar utsläpp av svaveldioxid (SO2),
kväveoxider (NOX), partiklar (PM) och växthusgaser (VHG) från sjöfart tillsammans med uppskattningar av
utsläppsminskningar för dessa åtgärder. Utsläppsminskningarna bidrar i sin tur till uppfyllandet av de svenska miljökvalitetsmålen; Ren luft, Bara naturlig försurning, Ingen övergödning samt Minskad
klimatpåverkan. Resultat från denna rapport används som indata i en förenklad kostnads-nytto-analys som
genomförs för att rekommendera styrmedel.
Ett urval av åtgärder som kan minska utsläppen till luft från sjöfart och som påverkar de svenska miljökvalitetsmålen som relaterar till luftutsläpp analyseras avseende reduktionspotential och
åtgärdskostnader för redare. Tidsperspektivet i studien är inriktat på 2030 respektive 2045 och 2015 används som basår. De åtgärder som inkluderats i analyser är:
• Bränslebyten från MGO (Marine Gas Oil) till: flytande naturgas (LNG), flytande biogas (LBG) samt till fossil, respektive förnybar metanol.
• Full elektrifiering genom laddbara batterier.
• Anslutning till landström i hamn (Onshore Power Supply, OPS). • Selektiv katalytisk reduktion av NOX (SCR).
• Framdrivning med hjälp av rotorsegel (Flettner-rotorer).
• Energieffektiviseringsåtgärder, inklusive avancerad ruttplanering, optimerad propeller, slanka skrov och hybridicering.
• Hastighetsreducering.
Kostnadsberäkningarna är gjorda från redarnas perspektiv och inkluderar investeringskostnader för att installera åtgärderna på fartygen, förändrade kostnader för drift och underhåll, och i många fall
kostnadsbesparingar till följd av minskad bränsleförbrukning. Kostnader som inte uppenbart kommer att betalas av redarna är inte inkluderade. Kostnaderna per år beräknas för dels för basåret 2015 samt för fyra framtida bränsleprisscenarier för åren 2030 och 2045 som baserats på scenarier från International Energy Agencys (IEAs).
Kostnadsberäkningarna är gjorda för två uppsättningar med representativa fartyg och emissionsfaktorer. Beräkningarna görs både ur tank-till-propeller-perspektiv (TTP) och ur källa-till-propeller-perspektiv (WTP). Klimatpåverkan av åtgärderna utvärderas både genom att titta på effekten på utsläppen av koldioxid (CO2)
separat samt genom att summera effekten av utsläppsminskningar från samtliga inkluderade växthusgaser, CO2, metan (CH4) och dikväveoxid (N2O), genom att summera med hjälp av global warming potentials
(GWP100) värden. I studien användes också GWP100 faktorer för de andra inkluderade luftföroreningarna för
att summera deras effekter, men dessa resultat betraktas som mycket mer osäkra än de som endast inkluderar växthusgaser eftersom osäkerheten för GWP-faktorer för luftföroreningar är betydligt osäkrare och beror till exempel på var utsläppen sker. Resultaten från dessa beräkningar används inte för vidare policyanalyser eller rekommendationer.
Resultaten från denna studie visar att bränslebyten till förnybara bränslen (LBG och förnybar metanol) samt helelektrifiering är mycket effektiva åtgärder för att minska utsläppen av samtliga luftföroreningar och växthusgaser från sjöfart. Dock uppvisar bränslebyten till LNG och fossil metanol lägre åtgärdskostnader i basfallet, men också för bränsleprisscenarierna till 2030 och 2045 så länge det inte finns en CO2-kostnad för
fossila utsläpp. CO2 -kostnaden för fossila utsläpp antas motsvara att sjöfartssektorn inkluderas i EU:s
utsläppshandelssystem. Med en CO2-kostnad även för sjöfarten så kan bränslebyte till LBG bli en lönsam
åtgärd i perspektivet till 2030 och 2045.
Enligt resultaten förväntas ett bränslebyte till LNG leda till en ökad klimatpåverkan om man tar hänsyn till både koldioxid och metanutsläpp oavsett om man har ett TTP eller ett WTP-perspektiv. Den främsta anledningen till den ökade påverkan är den metanslip som finns i motorerna. Även bränslebytet från konventionellt bränsle (marin gasolja, MGO) till fossil metanol resultera i att öka klimatpåverkan ur ett WTP-perspektiv. Enligt bränsleprisscenarierna 2030 och 2045kommer det att bli lönsamt att gå över till LNG i framtiden. För att motverka och komma till rätta med den ökade klimatpåverkan vid användning av LNG behöver man införa åtgärder och styrning för att minska utsläppen från motorerna men också för att minska utsläppen längs produktions och distributionskedjan för bränslet.
Många av de inkludera energieffektiviseringsåtgärderna och rotorseglen uppvisar negativa åtgärdskostnader för många av bränsleprisscenarierna. Hastighetsminskningar uppvisar också en betydande potential till utsläppsminskning och kostnaderna är negativa för de flesta fall.
Även om beräkningarna enligt de två dataseten gav olika resultat för utsläppsminskningar och åtgärdskostnader avseende användning av landström för fartyg som ligger i hamn så visade bägge
beräkningarna att RoPax fartyg har de bästa förutsättningarna för landströmsanslutning. Kryssningsfartyg använder en stor andel av bränsleförbrukningen i hamn för att producera el och de lokala utsläppen av luftföroreningar i hamnen kan minskas avsevärt om dessa fartyg kan ansluta till landström.
I 2015 års prisnivå så uppvisar SCR de lägsta specifika åtgärdskostnaderna för minskning av NOX-utsläppen
om man jämför mellan de åtgärder som är specifikt avsedda att minska NOX-utsläppen (SCR, bränslebyten
och helelektrifiering), följt av övergång till LNG. Eftersom resultaten visar att kostnaden för övergång till LNG minskar i de framtida scenarierna så kommer detta åtgärdsalternativ för att minska NOX-utsläppen bli
billigare i framtiden.
Beräkningarna med dataset A som också inkluderade N2O emissioner visar att dessa är obetydliga i
jämförelse med de andra inkluderade växthusgaserna (CO2 och CH4). Metanutsläppen är däremot mycket
viktiga vid bränslebyte till både LNG och LBG och därför bör fokus för sjöfartssektorn vara både på CO2 och
1.
Introduction
1.1. Background
Shipping is a significant source of air pollution including sulphur dioxide (SO2), nitrogen oxides (NOX) and
particular matter (PM) that poses negative impacts on human health and ecosystems (Brandt et al., 2013; Cofala et al., 2007; Corbett et al., 2007, Brynolf et al., 2016; Claremar et al., 2017; Cofala et al., 2018). In addition, shipping contributed to ~3% of global greenhouse gas (GHG) emissions in 2015 and the projected development is a continuous increase of this share (Olmer et al., 2017). In April 2018, the International Maritime Organization (IMO) adopted the IMO Greenhouse Gases Emissions strategy, which is a strategy to reduce the GHG emissions from shipping. For other air pollution from maritime shipping, including sulphur, NOX and other pollutants, the IMO also has regulation in the form of Annex VI to the MARPOL1 73/78.
The air emissions from shipping comes from combustion of fuel in the engines and boilers. Most ships have several engines: main engines (for propulsion mainly) and auxiliary engines (for generating power for purposes other than propulsion, such as electricity, lighting etc.). In addition, most vessels also have boilers on board to meet the demand for heating and the supply of hot water. The engines and boilers are usually run on fossil fuels, such as Heavy Fuel Oil (HFO), or Marine Gas Oil (MGO) and the exhaust gases contain fossil carbon dioxide (CO2), as well as methane (CH4), nitrous oxide (N2O), SO2, NOX and PM.
This report is written as part of the Carrot and Sticks project and has the specific objective to assess cost estimates for abatement options for measures reducing the air emissions of SO2 (sulphur dioxide), NOX
(nitrogen oxides), PM (particular matter) and greenhouse gases (GHG) from Swedish shipping along with estimates of emission reductions.
1.2. Objectives
The objective of this report is to assess the costs of specific abatement measures reducing air emissions in terms of NOX, SO2, (PM) and greenhouse gases (CO2, CH4 and N2O) from shipping in or close to Swedish
waters and related emission reductions for the implementation of such measures.
The results from this study are used as a basis for a Cost-Benefit Analysis (CBA) and for policy recommendations regarding policies related to the fulfilment of four of the Swedish Environmental
Objectives related to air emissions: Clean Air, Natural Acidification Only, Zero Eutrophication and Reduced
Climate Impact and for achieving the IMO’s GHG objectives for 2030 and 2050. In addition, the potential of
measures to contribute to the recently adopted target (April 2018) by the International Maritime Organisation (IMO), to reduce greenhouse gas emissions from global shipping by at least 40% by 2030 and 50% by 2050 compared to the level in 2008, is taken into consideration. The related policy analysis and analysis of target fulfilment is presented in Vierth (2020) and Trosvik et al. (2020).
1.3. Delimitations
There is a significant amount of scientific literature estimating and describing options to abate emissions from the shipping sector for compliance with current and forthcoming regulations from the IMO, the EU and others (e.g. (Bouman et al., 2017; Brynolf et al., 2014; Buhaug et al., 2009; Faber et al., 2011; Grahn et al., 2013; Lindstad et al., 2015a, 2015b; MEPC Marine Environment Protection Committee, 2018; Parsmo et al., 2017; Smith et al., 2014). Most of these studies focus on one type of emission or one specific regulation, e.g. sulphur or nitrous oxides or greenhouse gases (GHGs). However, several abatement options have an impact on more than one type of emission. In this study, the abatement costs and reductions of four emission categories; SO2, NOX, PM and GHGs (i.e. CO2, CH4 and N2O) are estimated for each abatement measure.
1 MARPOL = The international convention for the Prevention of Pollution from Ships. This convention was developed
In this study, two sets of representative vessels and emission factors (referred to as dataset A and B) are used to estimate investment costs from a shipowner’s perspective and the associated changes in fuel consumption and emissions for the abatement measures. Further, in this study, a set of relevant abatement measures were selected based on their assumed potential to have an impact on the Swedish Environmental Quality
Objectives for the specified pollutants. These measures include fuel switch, full electrification, SCR (Selective catalytic reduction), speed reductions (slow steaming), onshore power supply (OPS) and a set of energy efficiency measures; slender hull design, advanced route planning, optimized propeller, wind power (by Flettner rotors) and hybridization.
The measures described in this report are not exhaustive. The selection of measures to be analysed was made with the aim of including measures with the potential to have a significant impact on the emissions and possibilities to reduce them in a near term time perspective. The focus in this report is on measures that are ready to be implemented and little or no focus is on measures that are not yet technically mature or have only been implemented as demonstrations.
1.4. Report outline
In chapter 2 the method used for calculating the abatement costs and emission reductions of the included measures is described. It also describes how the measures were selected.
Chapter 3 gives a background on the emission levels of the included emission categories from shipping and a background on some of the important regulations that drives the implementation of emission reducing measures in the shipping sector. In chapter 3 there is also a more general description of abatement options for emissions from shipping with focus on the selected measures. Section 3.2 presents the economic parameters used in the calculations of this study, including fuel prices. Section 3.3. presents the two sets of emission factors used in the calculations and section 3.4 describes the two sets of representative vessels used in the calculations. In section 3.5 the specific assumptions and data used for calculating the costs and emission reductions for the abatement measures are given in detail.
Chapter 4 presents the calculated emission reductions and abatement costs. The detailed data can be found in the Supplementary material
Chapter 5 includes a discussion and the conclusions draw from this work.
2.
Method
This study has a Swedish perspective, since the results are intended to be used in a cost-benefit analysis (CBA) for Sweden for the years 2015, 2030 and 2045, with the aim of estimating the efficiency of contributing to the fulfilment of four of the Swedish Environmental Objectives, i.e. Clean Air, Natural
Acidification Only, Zero Eutrophication and Reduced Climate Impact. For the GHG emissions, the current
project takes a larger perspective than just Swedish, by also considering the IMO GHG reduction targets and by including not only tank-to-propeller (TTP), but also well-to-propeller (WTP) perspectives on emissions. In this study the abatement costs for reducing the emissions of SO2, NOX, PM and greenhouse gases (CO2,
CH4 and N2O) are estimated from a shipowner’s (or operator’s) perspective. This means that infrastructural
costs are not directly included (e.g. investments on the land side for OPS (onshore power supply) or
infrastructure investments for alternative fuel supply in ports etc.). Rather, these costs will be included in the analysis of the efficiency of policy instruments that will be carried out in other parts of the Carrots & Sticks project. It could be argued that costs falling upon actors other than shipowners, (e.g. ports) will be passed on to shippers by increased fees, but these costs have not been included in the abatement cost estimates for the shipowners in this study. The investment costs for the different measures used in the analysis undertaken within this study are based on estimates available in the scientific literature and reports. The base year for the cost calculations is 2015 and, hence, all costs have been recalculated to the monetary values of 2015. Cost estimates are also made for the years 2030 and 2045 using different fuel price scenarios. Fuel prices used are presented in section 3.2 and are based on the scientific literature and statistics.
2.1. Abatement costs
The abatement cost of a specific measure is calculated as the annualized costs, including investments cost and operational costs, of the abatement technology.
𝐴𝐴𝐶𝐶𝑗𝑗 = 𝐶𝐶𝑗𝑗 + 𝛥𝛥𝑂𝑂&𝑀𝑀𝑗𝑗 − 𝐸𝐸𝑗𝑗 , where Eq. (1)
ACj = abatement cost for measure j
Cj = annualized investment cost for measure j
ΔO&Mj = the change in service or operating and maintenance cost related to the use of technology j as
compared to the base-case
Ej = the energy (or fuel) savings from an energy saving measure, which is the product of the price of energy
and the saving of energy according to Eq. (2a) below:
𝐸𝐸𝑗𝑗 = 𝛼𝛼𝑗𝑗 ∗ 𝐹𝐹𝑏𝑏 ∗ 𝑃𝑃 Eq. (2a)
Where, in the case of an energy saving measure: αj = fuel reduction rate of technology j
Fb = pre-installation or original annual fuel consumption for a ship
P = price of fuel
or in the case of a fuel switch:
𝐸𝐸𝑗𝑗 = 𝐹𝐹𝑏𝑏 ∗ 𝑃𝑃𝑏𝑏 − 𝐹𝐹𝑗𝑗 ∗ 𝑃𝑃𝑗𝑗 Eq. (2b)
Where
Fb = original (base-case) annual fuel consumption
Pb = price of original (base-case) fuel
Pj = price of fuel j
The abatement costs are calculated from a shipowner’s perspective and, hence, the investment and operational costs included are those that will fall upon the shipowner.
The total abatement cost is calculated by summing the annualized investment cost (C), and the annual change in operational costs. The annualization of the investment costs is achieved by using an annualization factor (or capital recovery factor, CRF) defined by the equations below:
Annualization 𝐶𝐶 = 𝐼𝐼 ∗ 𝐶𝐶𝐶𝐶𝐹𝐹 Eq. (3) Where I = investment cost (1+r)𝑙𝑙𝑙𝑙∗r 𝐶𝐶𝐶𝐶𝐹𝐹 = (1+r)𝑙𝑙𝑙𝑙−1 Eq. (4) Where
CRF = capital recovery factor r = real interest rate
lt = lifetime of the investment (years)
Data on investment costs and the emission reduction potential of the different abatement measures are presented in section 3.5.
2.2. Selection of abatement measures
In order to limit the abatement measures to a tractable number of measures, a selection was made based on the potential of an individual measure to have a significant impact on the achievement of the Swedish Environmental Quality Objectives; Clean Air, Natural Acidification Only, Zero Eutrophication and Reduced
Climate Impact. The selection excluded measures that are not yet mature (such as fuel cells, ammonia as a
fuel etc.) and measures that, to a large extent, have already been implemented and where additional or further implementation would have a small effect (e.g. measures reducing Sulphur emissions, see Section 3.1.1). Note that omitted abatement measures might be important for emission reductions under the longer time frame, until 2045, but due to the immaturity of the technology and the difficulty in estimating costs, they have not been included in this report.
The included abatement measures are presented in more detail in section 3.5.
2.3. Emission reductions
The emission categories considered in this study are CO2, CH4, N2O2, NOX, SO2 and PM. Emission
reductions for the three greenhouse gases; CO2, CH4, and N2O are calculated separately, but results are
summarised to CO2-equivalents (CO2eq.) by using GWP100-factors (global warming potential factors for the
time span of 100 years). The air pollutants NOX, SO2 and PM also have an impact on the radiative balance
(climate impact) and, therefore, results are also presented in terms of CO2-equivalents using the GWP-factors
for these air pollutants. However, the uncertainty in the GWP-factors for the air pollutants is greater, mainly since these gases are involved in different processes in the atmosphere where they can both contribute to warming and cooling of the climate and there is also a dependency on where these emissions occur.
2 N2O is included in the calculations according to one of the data sets analysed (data set A - see section 2.4), but not in
the calculations according to the other (data set B – see section 3.5). This is because the results from the analysis of data set A showed that these emissions are generally very low and do not have a significant impact on the results.
Therefore, these results should be considered as more uncertain than the GWP summarised emissions that only include greenhouse gases.
The emission reductions are calculated from two different perspectives:
• From a tank-to-propeller (TTP) perspective, which shows the emission changes from the ship (i.e. emissions directly connected to the shipping sector).
• From a well-to-propeller (WTP) perspective, which also includes upstream emissions (emissions related to fuel production, production of electricity used etc.) and thereby indicates the overall impact of an abatement measure in a manner that is more directly related to the targets of reducing total emissions, and not only emissions from the shipping sector.
Data on emission factors and GWP-factors used in the calculations are given in Section 3.3. Two different sets of emission factors for maritime fuels are used:
• emission factors given by Brynolf (2014) and
• emission factors as recommended by Carlsson et al. (2019), complemented by emission factors from Brynolf (2014) for the well-to-tank (WTT) perspective3 and for CH4-emissions (which are not
included in Carlsson et al. (2019)).
2.4. The use of representative vessels and d
ata sets
Many of the investment costs and emissions reduction potential are dependent on different vessel-specific factors such as: vessel category, vessel size, main engine capacity, annual fuel consumption etc. In this study, representative vessels are used for estimating costs and emissions reductions.
At the starting point of this study the data available on fuel consumption for Swedish domestic and
international shipping was not reflecting the actual consumption at an acceptable level of uncertainty. There was also a lack of good data for fuel consumption divided upon different ship types and vessel sizes etc. Therefore, the SMHI (Swedish Meteorological and Hydrological Institute) was commissioned to use the SHIPAIR model for estimating better fuel consumption data for shipping in Sweden and the surrounding seas. The work by SMHI resulted in Windmark (2019) which includes both fuel consumption and detailed information on the characteristics of the fleet that was sailing the waters in 2015. In addition, in September 2019 Carlsson et al. (2019) was published which included the updated and relevant emission factors for Swedish shipping sector.
Due to the changing availability of data, this study includes emission reduction and abatement cost calculations based on two different data sets:
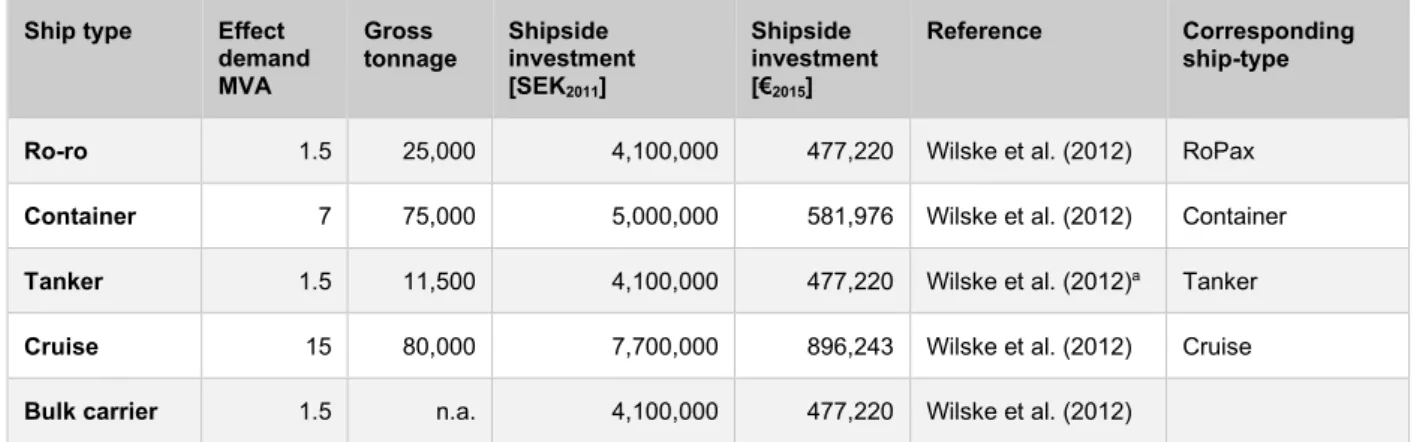
Data set A: Uses the emission factors from Brynolf (2014) and a set of representative vessels presented in Table 16. The set of representative vessels include four vessels representing four different ship types (i.e. one specific size for each ship type) selected on the basis of the ship types that contributed the most to emissions from shipping in the Baltic sea according to Johansson and Jalkanen, (2016) – see section 3.4.
Data set B: Uses the emission factors from Carlsson et al. (2019), complemented by some factors from Brynolf (2014) and the representative vessels presented in Table 15. The set of representative vessels include eight different ship types and different size classes within each ship type. This data set includes several more specific characteristics of each vessel and is based on the data calculated from AIS data using the SHIPAIR model presented in Windmark (2019).
2.5. Sensitivity analysis
The use of the two data sets should not be seen as a sensitivity analysis. The sensitivity analysis is rather performed by applying the different fuel price scenarios (see section 3.2) since most of the measures are very dependent on the fuel prices.
3.
Description of abatement measures, assumptions and d
ata for
calculations
This chapter includes a description of the abatement measures and the data used for the cost and emissions reduction calculations. It also includes a background on some of the important regulations that drives the implementation of emission reducing measures in the shipping sector.
3.1. Emission levels and regulations for emission abatement in shipping
This section includes a short background and description of some incentives and regulations that are effective or are becoming effective for shipping in Sweden and its surrounding waters (mainly including the North Sea and the Baltic Sea). The regulations and incentives described here do not fully cover all incentives and regulations; a full assessment of regulations and incentives on a global level has been done by Christodoulou et al., (2019). The coverage in the present report is mainly of administrative policy instruments (compulsory regulations) and does not include economic and informative instruments such as the Clean Shipping Index or Environmental Ship Index and port fees etc. This chapter also describes the current emission levels and projected emission levels for the studied emission categories.Air emissions from the shipping sector continue to grow as the sector grows. The most concerning emissions from shipping are NOX, SO2, PM and CO2.
According to e.g. Winkel et al. (2016), the contribution of shipping emissions has been increasing globally, while on the other hand the emissions from other sources are declining. Global NOX and SO2 emissions from
all shipping represent about 15% and 13% of the relevant air pollutants from anthropogenic sources reported in the latest IPCC Assessment Report - AR5 (Tocker et al., 2013). In harbour cities or in cases where ports are located near to densely populated areas, ship emissions are often one of the dominant sources of urban air pollution.
According to the 3rd IMO GHG study (Smith et al., 2014), maritime transport emits around 1,000 Mtonnes of
CO2 annually, corresponding to approximately 2.5% of global greenhouse gas emissions. Further, shipping
emissions are predicted to increase between 50 and 250% by 2050, depending on future economic and energy developments. According to EEA (2019a) the maritime transports in the EU accounted for 13% of the greenhouse gas emissions from the transport sector
Fuel use
Traditionally, the most commonly used fuel in marine shipping on a global scale is heavy fuel oil (HFO) with high sulphur content (Lindstad et al., 2015a). Heavy fuel oil is the residual fuel remaining after removal of lighter fractions such as naphtha, petrol, diesel and jet fuels, from crude oil in a refinery.
In Swedish waters and in the North European SECA (comprising the Baltic Sea and the North Sea4) the
distribution of fuel used by ships looks somewhat different than on the global scale, due to the stricter sulphur emissions regulations which apply (see section 3.1.1). As can be seen in Table 1 many ships use Marine gas oil (MGO), Marine Distillate oil (MDO) or Heavy fuel oil with ultra-low sulphur content (ULSHFO), which all are cleaner fuels. High sulphur fuel oil (HSFO) and liquid natural gas (LNG) are used in relatively low quantities.
In this study, the focus is on emissions from shipping in (or near) Sweden and, therefore, the selection of abatement measures is focused on measures relevant for shipowners operating ships in Swedish waters (or surrounding area) and calling at Swedish ports.
Table 1. Fuel consumption for vessel propulsion 2015 per fuel type for different geographical areas. Source: Vierth, (2018).
Fuel type* National transports Swedish waters Economic zone National transports Swedish waters Economic zone Cubic meters Tonnes
HSFO (HFO) 1 164 (1%) 17,107 (6%) 29,159 (7%) 1,164 (1%) 17,107 (8%) 29,159 (9%) ULSFO (HFO) 37,535 (37%) 105,511 (39%) 159,652 (41%) 31,529 (37%) 88,629 (40%) 134,108 (41%) MGO 42,332 (42%) 110,308 (41%) 164,452 (42%) 35,560 (42%) 92,658 (42%) 138,138 (42%) MDO 19,196 (19%) 19,188 (7%) 19,195 (5%) 16,124 (19%) 16,118 (7%) 16,124 (5%) LNG 0 (0%) 17,528 (7%) 17,528 (4%) 0 7,713 (3%) 7,713 (2%) Total 100,227 269,642 389,986 84,377 222,225 325,242
3.1.1. Emissions of sulphur from shipping and related regulation
In Europe, SO2 emissions have shown a decreasing trend over the past 30 years. According to (EEA (2019a)
the sulphur emissions from the EU28 have decreased by 70% between 2005 and 2017 (all sectors, however not including international maritime shipping). Based on the emissions reported under the LRTAP5
Convention,(which includes national and international shipping, but not international maritime shipping) the EEA, (2019) states that national and international shipping in 2017 was responsible for 12% of the total SOX
emissions in the EU. According to Winkel et al. (2016) the SO2 emissions in the year 2000 from international
shipping in the seas surrounding the EU were between 20% and 30% of the land-based emissions, while in 2020 these emissions from maritime activities are projected to be about as large as those from land-based sources.
In the EU, sulphur emissions have been regulated by the EU Directive 1993/12/ (EU Communities Council, 1993) and subsequent amendments (e.g. 1999/32/EC (EU COM, 1999), 2012/33/EU (EU COM, 2012) and, most recently, by EU Directive 2016/802 (EU COM, 2016)), known as the “sulphur Directive”. The Sulphur Directive regulates the sulphur content in fuels used both in land-based and maritime applications. When and where relevant, the Directive adapts EU legislation to developments under MARPOL Annex VI. .
The Baltic Sea and the North Sea have been SECA areas (Sulphur Emission Control Areas) since 2006 and 2007 respectively. ECAs (Emission Control Areas) are sea areas where stricter controls have been
established to minimise airborne emissions as defined by Annex VI of the 1997 MARPOL Protocol. The SECA regions have regulations for all ships (new and old) on the emission of SO2. Since the amount of
sulphur emitted is directly related to the sulphur content of the fuel, the regulation has been set as a maximum allowed sulphur content (by weight) of the fuel used. Using fuels with higher sulphur content is allowed, if the ship is equipped with end-of-pipe solutions (e.g. scrubbers) that reduce the sulphur content in the exhaust gases to levels corresponding to the use of a fuel with sulphur content complying with the set limits. The SECA region in the Baltic, the North Sea and the English Channel has had a limit on the sulphur content of fuel set at a maximum of 0.1% wt. since 2015, see Table 2. This limit can be compared to the global limit on sulphur content in marine fuels, which until the end of 2019 was 3.5% wt. and from 1st
January 2020 is 0.5% wt.
According to Transport Analysis (2017a), the restrictions of only 0.1% wt. sulphur content in marine fuels within the SECA from 2015 resulted in a clear shift to Marine distillate fuels (MD, e.g. MGO and MDO) from Residual Oils (RO, e.g. HFO): For the Swedish domestic shipping, the share of MD fuels more than doubled in the period 2014-2016. The analysis of fuel utilization after the change of sulphur limits in the
North and Baltic Seas clearly show that there has been a significant change. In addition, the ratio of compliance with the SECA regulations seems high (95%) (Transport Analysis, 2017a).
Table 2 summarizes the IMO and EU regulation on sulphur emissions for different types of ships and the progression during the last decade.
Table 2 Allowed sulphur contents of marine fuels according to IMO MARPOL Annex VI and EU regulations (source:(IMO, 2016a)). This shows the historical development up until 1st January 2020. The percentages
are based on a mass to mass basis.
Global sulphur limits outside
SECAs Sulphur limits inside SECAs established to limit SOX and PM
Sulphur limits for passenger ships operating on regular services inside European sea areas according to EU Directive
Ships in EU ports according to EU Sulphur Directive (to be at berth >2 hours)
4.5% prior to 1 January 2012 1.5% prior to July 2010
1.50% prior to 1 January 2020
0.10% after December 2012
3.5% on and after 1 January
2012 1.00% on and after 1 July 2010 0.5% on and after 1 January
2020 0.10% on and after 1 January 2015 0.50% on and after 1 January 2020
The sulphur emissions to air from shipping comes from sulphur in the exhaust gases from the engines and boilers. The emission levels are directly dependent on the sulphur content in the fuel and there are mainly two ways of reducing the sulphur emissions:
1. Shifting to fuels with lower sulphur content or
2. Using scrubbers to remove the sulphur from the flue gases before they reach the atmosphere. There are several types of scrubbers, i.e. wet scrubbers, membrane scrubbers and dry scrubbers. Today, the wet scrubber is the technology that is present in the largest number of onboard applications and these can be operated in two modes:
• open-loop mode in which the treated wash water is disposed back into the sea and
• closed-loop mode where the treated wash water (scrubber liquid) can be collected for disposure in port.
The available scrubber systems can either be open-loop, closed loop or hybrid scrubbers, where the latter can switch between open-loop and closed-loop mode.
There are regulations set by the IMO on several parameters of the wash water from scrubbers that needs to be met before discharge back to the sea (including turbidity, PAHs (polycyclic aromatic hydrocarbons), and pH) and local regulation can also be stricter. The open-loop scrubbers are less expensive but questionable from an environmental point of view, since the scrubber water not only contains sulphur (i.e. the scrubber water will be acid, although the sea water will buffer this, but also other toxic components such as heavy metals etc. that will have a negative impact on the marine ecosystem. The closed loop scrubbers are more expensive and there also needs to be infrastructure in ports to accept the scrubber disposure, as well as the capacity and infrastructure for further handling.
There is an ongoing discussion about the environmental impact of open-loop scrubbers and several ports and countries have already banned the use of them, including Singapore, Latvia, Lithuania, Belgium, Dublin in Ireland, Fujairah and Abu Dhabi in the United Arab Emirates, India and China, In the US; Connecticut, Massachusetts, California and Hawaii (Argus Media, 2019; Reuters, 2019).
According to Lindstad and Eskeland (2016), both the investment costs and the running costs for a closed loop scrubber are double those for an open loop scrubber. In addition, the closed loop system also requires investments in ports for enabling the handling of the discharge.
3.1.2. Emissions of nitrous oxides from shipping and related regulation
Emissions of nitrogen oxides (NOX) cause damage to health and ecosystems. In Europe, shipping contributes
to a large and growing share of the total NOX emissions. According to the EEA (2019) NOX emissions from
shipping (international and international inland, but not international maritime shipping) were in 2017 responsible for 23% of the NOX emissions in the EU. If also considering NOX emissions from international
maritime shipping in the seas surrounding the EU, the share is even bigger. During the last few decades, the EU and its member states have gradually strengthened NOX emission abatement for a wide range of
land-based activities, including industrial installations (stationary) and road vehicle transport. These efforts have resulted in a more than halving of the total emissions in 2018 compared to the level in 1990 (Eurostat, 2018). According to the EEA (2019), all transport modes have reduced their emissions of air pollutants (CO, NH3,
NMVOCs, SOX and NOX) since 1990, except for international aviation and shipping from which several of
these pollutants have increased. For international shipping CO, NOX and NMVOCs have increased.
NOX emissions from shipping do not originate from the fuel as, for instance, do the sulphur and GHG
emissions. NOX is formed during combustion when nitrogen and oxygen in the ambient air reacts at the high
pressures and temperatures in the engine during operation. High temperatures and pressures are necessary to accomplish the high efficiency and power from the engine (Transport Analysis, 2017b).
MARPOL Annex VI regulates NOX emissions from the shipping sector. The regulation applies to each
marine diesel engine with a power output of more than 130 kW installed on a ship, with the exception of engines used solely for emergencies and engines on ships operating solely within the waters of the state in which they are flagged. The latter exception only applies if these engines are subject to an alternative NOX
control measure. The specifics of the IMO NOX regulations are summarized in Table 3.
Table 3. MARPOL Annex VI NOX emission limits. Source: (IMO MEPC, 2014). Tier level, date and comprehensiveness Effective
from Rated engine speed
a and emission limits
Rpm< 130 Rpm 130- <
2000c Rpm > 2000
I – includes vessels built between 2001 – 2010
and applies globallyb 2005 17.0 g NOX/kWh 45*n
-0.2 9.8 g
NOX/kWh
II – includes vessels built from 2011 and
onwards and applies globally 2010 14.4 g NOX/kWh 44*n
-0.23 7.7 g
NOX/kWh
III – includes vessels built from 2016 and onwards, in the North American and US Caribbean NECA – while it applies for vessels built from 2021 in the North Sea and Baltic Sea NECA areas
2016/2021d 3.4 g NO
X/kWh 9*n-0.2 1.96 g
NOX/kWh
a Engine maximum operating speed
b Tier I standards are applicable to existing engines, installed on ships built between 1January 1990 to 31 December 1999, with a displacement ≥ 90 liters per cylinder and rated output ≥ 5000 kW, subject to the availability of an approved engine upgrade kit. Further, it includes any engine that undergoes a major conversion on or after 1 January 2000. Major conversions include the replacement by a new engine, an increase of the maximum continuous rating (MCR) of the engine by more than 10% or substantial modification as defined in the NOX Technical Code.
c n = rpm, revolutions per minute.
d For the NECA in North America and the United States Caribbean Sea, the NOX Tier III levels are effective from 1 January 2016 and in the NECA of the North Sea and the Baltic sea it will be effective from 1 January 2021.
As Table 3 shows, the IMO has decided that the North Sea and the Baltic Sea will be a NECA (Nitrogen Oxides Emission Control Area) as from 2021, and the Tier III NOX emission levels will then be required for
new ships operating within this area. As from 2016, the Tier III levels are already required for new ships within the American ECA regions. The Tier III level corresponds to an 75-76% reduction of NOX emissions
compared to Tier II levels (which is the global requirement for ships built from 2011 and onwards) and an 80% reduction compared to Tier I levels.
Since 1998, Sweden has environmentally differentiated fairway dues. Between 1998 and 2014, the system was differentiated for sulphur oxides (SOX) and nitrogen oxides (NOX) based on reduction certificates. The
implementation of the sulphur directive in the SECA in 2015 made the SOX differentiation obsolete and the
fairway dues were only differentiated for NOX between 2015 and 2017. The procedure for reducing SOX
emissions by switching to fuels with lower sulphur content is easy compared to measures to reduce NOX
emissions (which require investments in e.g. Selective Catalytic Reduction (SCR) systems). The number of vessels with SOX reduction certificates is considerably higher than the number of vessels with NOX reduction
certificates (Lindé and Vierth, 2018). In 2018, the differentiated fairway dues system was replaced by a system that is differentiated based on the Clean Shipping Index.
There are mainly four different ways to reduce NOX emissions from ships:
• Aftertreatment measures (e.g. SCR).
• Combustion modifications (to prevent the formation of NOX).
• Fuel switches (and/or changing engine technology). • Reducing fuel consumption.
NOX emissions in the exhaust gases from ship engines can be reduced to Tier II levels by internal engine
modifications that adjust combustion parameters (Winnes et al., 2016). However, to reach Tier III limits, major changes will be needed. In order to comply with the Tier II standards, there are several technical measures as listed in, for example, SMA (2009). Yaramenka et al. (2017) stated that at the current level of knowledge and technology standards, only catalytic options or fuel switch are abatement options that can result in compliance with the NOX Tier III emission levels. The reduction in NOX due to fuel switch varies
significantly; switching from HFO to LNG reduces the NOX significantly (up to 90% for lean engines),
whereas a fuel switch to MGO only reduces the emissions by a few percent (Brynolf et al., 2014).
SCR (Selective Catalytic Reduction) is a technology that has proven to be able to reduce NOX emissions to
the Tier III standards. In SCR, the flue gases pass over a base metal catalyst via an added reducing agent, normally a water solution of urea. Further, SCR can be used in combination with several marine fuels, i.e. high sulphur levels, and different marine engines. However, low engine load (i.e. low temperatures) may still prove to be an issue for the successful operation of the SCR, along with a potential catalytic deactivation over time (Brynolf et al., 2014).
According to Transport Analysis (2017a), NOX emissions reductions can be met by SCR or fuel switch to
LNG in the short time perspective. Even though there might be situations when engine load is low and, therefore, the function of the SCR is reduced, there are also studies stating that SCR can be designed to reduce the NOX emissions far below the Tier III level (Zetterdahl et al., 2016).
The compilation of vessels with NOX reduction certificates during 2007-2016 by Lindé and Vierth (2018),
show that the most commonly used technology (corresponding to over 75% of the vessels with NOX
reduction certificates) was SCR, followed by installation of a gas turbine ( about 6% of the vessels). There is an ongoing development of technologies to reduce NOX emissions from marine engines and there
are other technologies (other than SCR and fuel shifts) that in combination can reach the Tier III levels. Kumar (2019) lists the following technologies: scavenging air moisturising or In-cylinder in combination with EGR (Exhaust gas recirculation), dual fuel engines (using LNG as a fuel) and two stage turbocharging using Miller cycle.
For the reduction of NOX emissions, the present study includes the most common technologies used;
introduction of SCR and fuel switches, since these measures are judged to potentially have a significant impact on NOX emissions from Swedish shipping or shipping in nearby waters. Other measures introduced to
comply with Tier II standards are judged to have a more limited impact and were, therefore, not included in this study.
3.1.3. Emissions of PM and related regulation
The regulations of NOX and SO2 emissions from shipping on a global scale, as defined in Annex VI to the
MARPOL convention, has a significant impact on the amounts emitted. This regulation also reduces the emissions of PM, since the compliance measures mean utilising fuels and equipment that will lower PM emissions. The Annex VI to the MARPOL convention does not include specific regulation for PM emissions. However, there is regulation for PM from marine engine in several jurisdictions. Some examples of
countries/regions with PM regulations for marine engines (or inland waterways) are; China, where there is regulation on PM for domestic shipping since July 1 2018, see (ICCT, 2017), the EU where there is
regulation on PM for marine engines (inland waterways) since 2004 (EU COM, 2004) and the US which also has a quite long history of regulation for PM for marine diesel engines.
3.1.4. Emissions of greenhouse gases and related regulation
Greenhouse gas emissions from international aviation and shipping fuels are treated separately in the national statistics and reporting and are not included in the national totals. The responsibility for international
agreements and regulations for reducing and limiting the emissions from international marine fuels has been given to the IMO. The process to find global agreements within the IMO has been long.
There are two mandatory mechanisms in Chapter 4 of MARPOL Annex VI on energy efficiency standards for ships, with the main objective being to reduce the GHG emissions from international shipping via improved ship design and operations. The regulatory mechanisms are:
• Energy Efficiency Design Index (EEDI), for new ships
• Ship Energy Efficiency Management Plan (SEEMP), for all ships.
The EEDI is an index that indicates the energy efficiency of a ship in terms of g CO2/tonne-mile; calculated
for a specific reference ship and operational conditions. The intention is that by imposing limits on this index, the IMO will be able to drive ship technologies to more energy efficient ones over time. EEDI is thus a goal-based technical standard that is applicable to new ships. Over time, the EEDI level will be tightened up; gradually leading to more energy efficient ships (IMO, 2016b).
SEEMP is a management tool and establishes a mechanism for ship operators to improve the energy efficiency of a ship during its operational lifecycle. It works according to the planning, implementation, monitoring and review of several energy efficiency measures within a continuous improvement/management cycle (IMO, 2016b).
In April 2018, the IMO agreed on a goal to reduce the GHG emissions from shipping by 50% by 2050 as compared to the 2008 level. Bouman et al. (2017) have made a review of technologies and potential for GHG emission reductions in the shipping sector and state that the second IMO GHG study (Buhaug et al., 2009) is the most comprehensive study of GHG abatement options in the shipping industry. According to Buhaug et al. (2009), shipping’s energy consumption and CO2 emissions could be reduced by up to 75% by applying
operational measures and implementing existing technologies.
According to a study by Lindstad et al. (2015b), the GHG emissions from EU-related maritime transport can be reduced by up to 36% by 2030 by applying known abatement measures and some additional alternative fuels (LNG, biofuels, H2 fuel cells and cold ironing) compared to a reference scenario. Lindstad et al.
(2015b) also include an assessment of the economic impacts of these emission reduction measures. For ten ship types, the costs and benefits were evaluated for a set of abatement measures. Lindstad et al. (2015b) focused on abatement measures that can be implemented in ships in the very near future. The estimated investment costs and CO2 reduction potential for measures included in Lindstad et al. (2015b) are given in
Table 4. Note that several of the measures listed in Table 4 that are not included in the present study, still are important measures that together, will contribute to increased energy efficiency of the global fleet and reductions of GHG emissions. They were omitted in this study in order to keep the number of measures to a reasonable number and abatement measures with higher estimated emission reductions are included instead.
Table 4. GHG emission reduction measures with estimated reduction potential and investment cost by Lindstad et al. (2015b) and indication on which measures that are included in the present study.
CO2 saving potential %
(compared to 2030 reference) Investment cost estimate Considered in this study Profit sharing 2% (for bulk carriers, general
cargo and tankers) No investment required Not included Advanced route
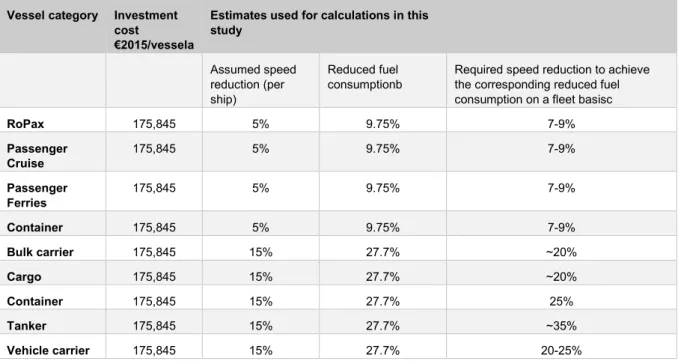
planning 5-10% (depending on vessel category) 50,000 – 100,000 €/vessel Yes included. Slow steaming
(speed reductions)
2-18% depending on vessel category (not applicable for RoPax and LNG/LPG tankers)
No investment required Yes, included. Assumption of emissions and reductions described in section 3.5.5. Efficient lighting 1.5-3% depending on ship type 50,000 – 200,000
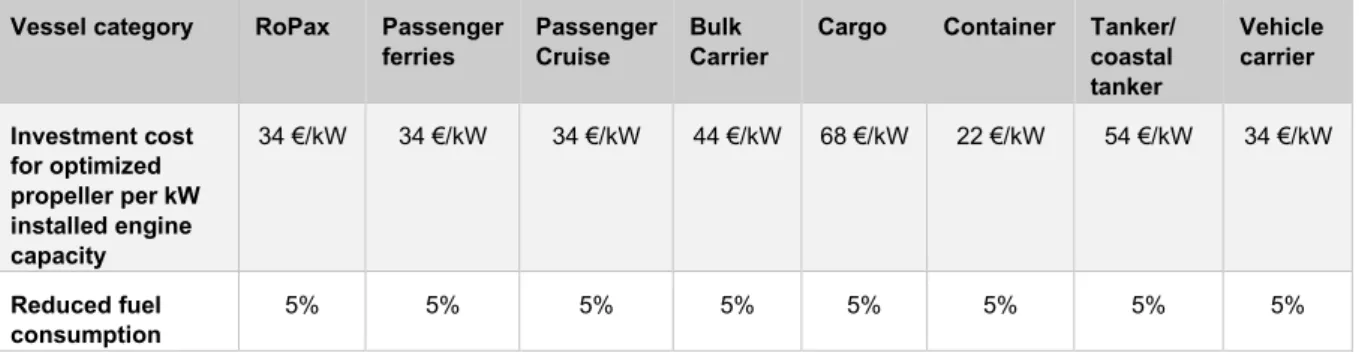
€/vessel Not included, . Optimized
propeller 5% for all ship types Depending on engine size and ship type. Yes, included Slender hull 10-30% depending on ship type ~ 10% of new-build
vessel cost Yes, included for new vessels Ballast water
reduction 2.5% for all ship types 2-5% of hull cost Not included.
Hybridization 5-10% depending on ship type Yes, included
Waste heat
recovery 3.5% for all ship types except tankers Not included. Solar cells 0.2%, but not applicable to all ship
types Not included.
Wind power 5% but not applicable for all ship
types Flettner rotors (type of wind power) are included.
LNG as a fuel 8% for all ship types Included but other cost and
emission reduction estimates used.
Biofuels (as drop
in 10%) 6% for all ship types Not included. But fuel switches to renewable
fuels are included.
H2 fuel cell for
aux. power during sailing
2-4% depending on ship type Not included
H2 fuel cell for
aux. power during sailing and in port
7-11% depending on ship type Not included.
Cold ironing 3-7% Included but emission
reductions and cost estimates are not based on Lindstad et al. (2015b)
A recent report by Faber et al., (2019) lists short term measures for reducing greenhouse gas emissions from ships until 2030 and estimates the impacts of these measures on the annual CO2 emissions relative to a
business-as-usual scenario. Faber et al. (2019) conclude that the measures with the greatest potential to impact the 2030 annual emissions are different speed limiting measures, CO2 intensity and operational
efficiency standards.
The EU has also worked on strategies to reduce and limit emissions from international shipping within its waters. From 1 January 2018, the EU has introduced a new regulation for the use of a monitoring, reporting and verification system (MRV) for maritime emissions of CO2. The objective is to reduce CO2 emissions
from shipping in a cost-efficient way and the system is seen as a starting point for future international agreements about global measures to reduce the greenhouse gas emissions from shipping (Transport
Analysis, 2016). The system includes all vessels larger than 5000 GT and they shall report fuel consumption and CO2 emissions per voyage on an annual basis. From 1 January 2019, the IMO introduced the IMO DCS
(Data collection system) valid for vessels larger than 5000 GT. This system collects data on consumed fuel in total, distance travelled and hours underway under a ship’s own propulsion. The EU regulation is mandatory for all vessels calling at EU ports, whereas the IMO regulation is mandatory for vessels globally. Since ships calling into EEA ports will have to report under both the IMO and the EU systems from 1 January 2019, the EU has made an impact assessment of different options of aligning the EU MRV and the IMO DCS systems (EU COM, 2019). Although some alignment between the two systems might be introduced, the IMO system will not replace the EU system.
Abbasov et al. (2018) also assessed possible options for decarbonizing the European shipping sector. The study simplifies the number of possible solutions by saying that carbon-based alternative fuels, i.e. fuels that result in CO2 emissions from the vessels (i.e. the combustion of carbon-containing fuels) should be avoided,
since there are other sectors that are more difficult to decarbonize that will need those fuels (e.g. biofuels). Instead, Abbasov et al. (2018) focus on electrification by either battery electric propulsion or propulsion relying on fuel cells using hydrogen or ammonia. Abbasov et al. (2018) emphasize that full battery electric propulsion is the most energy efficient pathway (not considering the loss of cargo carrying capacity due to space lost for accommodating the batteries) and that this technology is more readily available compared to fuel cells. According to their analysis, battery electric propulsion could be more cost-effective for small and mid-size ships, notably RoRo vessels that are mainly engaged in shortsea coastal shipping.
3.1.5. Background on selected abatement measures
The sources of air emissions from shipping are the combustion of fuel in engines, including main engines (for propulsion), auxiliary engines (for power, lighting etc.) and boilers (for heating and hot water). Figure 1 categorises different options for reducing air emissions from shipping and gives examples of the abatement options (not exhaustively). In order to limit the number of measures handled within this study, a selection was made. The selected measures include only those that could have a significant impact on the emission levels in a short to medium time perspective and excluded measures that are far from technical maturity (fuel cells, ammonia) or that are already largely implemented and where additional implementation would have a small effect. The included measures are:
• Fuel switch from MGO to: LNG, LBG, fossil methanol or renewable methanol • Full electrification by rechargeable batteries.
• Onshore power supply • Selective Catalytic Reduction. • Wind power (by Flettner rotors).
• Energy efficiency measures including Hybridization, Advanced route planning, Optimized propeller and Slender hull design.
Figure 1. Description of factors influencing air emissions and options for reducing emissions from maritime shipping. Source: Adjusted from Hansson (2020).
Based on the already strict sulphur requirements for shipping in Swedish waters and the surrounding waters (i.e. the SECA regions of the North Sea and the Baltic Sea) it was decided not to include measures
specifically reducing sulphur emissions (scrubbers) in the present study. Such measures have already been introduced to a large extent in the shipping in nearby waters (SECA region) and there are also forthcoming stricter global regulations that will further reduce emissions from shipping outside the SECA regions. Hence, additional measures to those already in place are estimated to have a small impact on the Swedish
Environmental Quality Objectives (EQO) on acidification.
Table 5 gives an overview on which abatement measures impact which emission categories. In the following sections, the selected abatement measures are described in more detail, along with their current status in Sweden.