Mälardalen University Press Licentiate Theses No. 249
IMPACTS OF THERMO-PHYSICAL PROPERTIES
ON CHEMICAL ABSORPTION FOR CO
2CAPTURE
Worrada Nookuea 2016
School of Business, Society and Engineering
Mälardalen University Press Licentiate Theses
No. 249
IMPACTS OF THERMO-PHYSICAL PROPERTIES
ON CHEMICAL ABSORPTION FOR CO2 CAPTURE
Worrada Nookuea
2016
Copyright © Worrada Nookuea, 2016 ISBN 978-91-7485-306-3
ISSN 1651-9256
Summary
Following the climate change mitigation target in Paris agreement, the global warming has to be limited to 2.0°C above the preindustrial levels. One of the potential methods is carbon capture and storage (CCS), which can signifi-cantly reduce the CO2 emissions from the vast point sources such as power
plants, industries, and natural gas processes.
The CCS covers four steps which are capture, conditioning, transport, and storage. For the capture part, post-combustion capture is easier to implement based on today’s technologies and infrastructure compared with pre-combus-tion and oxy-fuel combuspre-combus-tion captures, since the radical changes in the struc-ture of the existing plant are not required.
To design and operate different CCS processes, the knowledge of thermo-physical properties of the CO2 mixtures is of importance. In this thesis, the
status and progress of the studies related to the impacts of the uncertainty in thermo-physical properties on the design and operation of the CCS processes were reviewed. The knowledge gaps and the priority of property model devel-opment were identified.
According to the identified knowledge gaps in the review, the impacts of thermo-physical properties which are the density, viscosity, diffusivity of the gas and liquid phases, and the surface tension and heat capacity of the liquid phase on the design of the absorber column for the chemical absorption using aqueous monoethanolamine were quantitatively analysed. An in-house rate-based absorption model was developed in MATLAB to simulate the absorp-tion process, and the sensitivity study was done for each property. Further, an economic evaluation was performed to estimate the impacts of the properties on the capital cost of the absorption unit.
For column diameter of the absorber, the gas phase density shows the most significant impacts; while, the density and viscosity of the liquid phase show the most significant impacts on the design of the packing height and also the capital cost of the absorption unit. Therefore, developing the flue gas density model and liquid phase density and viscosity models of the aqueous solvents with CO2 loading should be prioritised.
Sammanfattning
Enligt Parisavtalets mål för klimatförändringar ska den globala uppvärm-ningen begränsas till 2.0 °C över förindustriella nivåer. En av de potentiella metoderna är avskiljning och lagring av koldioxid (CCS), som avsevärt kan minska CO2-utsläppen från stora punktkällor såsom kraftverk, industrier och
naturgasprocesser. CCS omfattar fyra steg som är avskiljning, konditionering, transport och lagring. Avskiljning genom efterförbränning är lättare att ge-nomföra baserat på dagens teknik och infrastruktur jämfört med avskiljning före förbränning och genom oxybränsle förbränning, eftersom radikala för-ändringar av de befintliga anläggningars struktur inte behövs.
För att utforma och driva olika CCS processer, är kunskap om termofysi-kaliska egenskaperna hos CO2 blandningarna av stor betydelse. I denna
av-handling har status och framsteg för studier rörande effekterna av osäkerheten i termofysikaliska egenskaper på konstruktion och drift av CCS processer granskats. Kunskapsluckor och prioritering av utveckling av modeller för egenskaperna identifierades.
Enligt de i översynen identifierade kunskapsluckorna, har effekterna av de termofysikaliska egenskaperna densitet, viskositet och diffusivitet av gas- och vätskefaserna, och ytspänningen och värmekapacitet av vätskefasen på ut-formningen av absorptionskolonnen för kemisk absorption med användning av vattenhaltig monoetanolamin analyserats kvantitativt. En hastighetsbaserad absorptionsmodell har utvecklats i MATLAB för simulering av absorptions-processen och känslighetsanalys gjordes för varje egenskap. En ekonomisk utvärdering genomfördes också för att ytterligare uppskatta effekterna av egenskaperna på kapitalkostnaden för absorptionsenheten.
För bestämning av diametern av absorbatorns kolonn visar gasfasens den-sitet den mest betydande inverkan; medan vätskefasens denden-sitet och viskosi-teten visar den mest betydande inverkan på utformningen av fyllmaterialets höjd och även kapitalkostnaderna för absorptionsenheten. Därför bör utveckl-ing av modeller för rökgasens densitet och vätskefasens densitet och viskositet för det vattenbaserade lösningsmedlet med absorberad CO2 prioriteras.
Acknowledgements
The licentiate thesis was conducted at the School of Business, Society and Engineering, Mälardelen University, Västerås, Sweden. The financial support by the Swedish Energy Agency and Swedish Research Council is gratefully appreciated. I also deeply appreciate the traveling grants from the foundation of tandläkare Gustav Dahls memory and Åforsk.
Greatly appreciation to my supervisors Prof. Jinyue Yan, Assoc. Prof. Hai-long Li and Assoc. Prof. Eva Thorin for giving me the opportunity to work in this project. I am deeply grateful for their continuing support, guidance, and patience since the first day of my doctoral study.
I would like to thank Yuting Tan from the Royal Institute of Technology for his collaboration and support in our project and joint publications. The warm welcome and the experimental collaborations from Dr. Fu Wang from Tianjin University, Dr. Jie Yang from the University of Shanghai for Science and Technology and Prof. Xinhai Yu from the East China University of Sci-ence and Technology are greatly appreciated. I would also like to thank Dr. Anders Avelin for reviewing my thesis and giving the valuable comments.
I have received the generous support and encouragement from my dear friends and colleagues especially from Dr. Guilnaz Mirmoshtaghi, Anbarasan Anbalagan, Tan Sie Ting, Dr. Pietro Elia Campana, Md Lokman Hosain, Chaudhary Awais Salman, Gero Meyer, Nima Ghaviha, Jingjing Song, Yang Zhang, Nathan Zimmerman, Jan Skvaril, Zahra Mohammadi, and for these I am very grateful.
Finally, I also would love to thank my family for their unconditional love and support. Special thanks to my beloved husband, I love you to the moon and back.
List of papers
This thesis is based on the following papers, which are referred to in the text by their Roman numerals:
I. Tan Y, Nookuea W, Li H, Thorin E, Yan J. Property impacts on carbon capture and storage (CCS) processes: A review. Energy Convers Manag 2016;118:204–22. (First two authors contributed equally to this work) II. Nookuea W, Tan Y, Li H, Thorin E, Yan J. Sensitivity study of
thermo-physical properties of gas phase on absorber design for CO2 capture using
monoethanolamine. Energy Procedia 2015;75:2305–10.
III. Nookuea W, Tan Y, Li H, Thorin E, Yan J. Impacts of thermo-physical properties of gas and liquid phases on design of absorber for CO2 capture
using monoethanolamine. Int J Greenh Gas Control 2016;52:190–200. For paper I, I contributed in reviewing and analysis of the chemical absorption, physical absorption, physical adsorption and membrane separation. A Ph.D. student, Yuting Tan from the Royal Institute of Technology (KTH) contrib-uted in reviewing and analysis of the CO2 conditioning, transport and storage
processes. For paper II and III, I contributed in developing an in-house rate-based absorption model for the simulation of the absorption column including to conducting the sensitivity analyses of the gas and liquid phase thermo-phys-ical properties on the design of the absorber column and the annual capital cost of the absorption unit.
List of papers not included
I. Nookuea W, Wang F, Yang J, Tan Y, Li H, Thorin E, Yu X, Yan J. Vis-cosity data of aqueous MDEA–[Bmim] [BF4] solutions within carbon
cap-ture operating conditions. The 8th International Conference on Applied Energy (ICAE2016). 8–11 October, 2016. Beijing, China.
II. Tan Y, Nookuea W, Li H, Thorin E, Yan J. Improving design of multi-stream heat exchanger in CO2 cryogenic capture process with
considera-tions of impacts of thermophysical properties, Manuscript for the Energy Conversion and Management.
III. Tan Y, Nookuea W, Li H, Thorin E, Yan J. Evaluation of viscosity and thermal conductivity models for CO2 mixtures applied in CO2 cryogenic
process, Manuscript for the International Journal of Greenhouse Gas Con-trol.
IV. Tan Y, Nookuea W, Li H, Thorin E, Yan J. Property impacts on performance of CO2 pipeline transport. Energy Procedia. 75 (2015),
Contents
1. INTRODUCTION ... 1
1.1 Background ... 1
1.2 Knowledge gaps ... 3
1.3 Objective ... 3
1.4 Contributions of the thesis ... 4
1.5 Thesis outline ... 4
2. METHODOLOGY AND MODEL DESCRIPTION ... 6
2.1 Process simulation of chemical absorption ... 7
2.1.1 Reaction model ... 7 2.1.2 Mass balances ... 9 2.1.3 Energy balances ... 10 2.2 Absorber design ... 11 2.2.1 Column diameter ... 11 2.2.2 Packing height ... 12 2.3 Thermo-physical properties ... 15
2.4 Annual capital cost ... 16
3. STATUS AND PROGRESS OF THE PROPERTY IMPACT STUDIES (PAPER I) . 18 3.1 Chemical absorption ... 18
3.1.1 Related properties in chemical absorption ... 18
3.1.2 Existing studies of property impacts on chemical absorption ... 19
3.2 Physical absorption ... 22
3.2.1 Related properties in physical absorption ... 22
3.2.2 Existing studies of property impacts on physical absorption ... 23
3.3 Physical adsorption ... 24
3.3.1 Related properties in physical adsorption ... 24
3.4 Membrane separation... 26
3.4.1 Related properties in membrane separation ... 26
3.5 Summary of the important findings ... 27
4. THERMO-PHYSICAL PROPERTY IMPACTS ON THE ABSORBER DESIGN AND THE ANNUAL CAPITAL COST OF THE ABSORPTION UNIT (PAPER II,III) .. 29
4.1 Validation of the absorption model ... 29
4.2 Impacts on the column diameter ... 31
4.3 Impacts on the packing height ... 32
4.4 Impacts on the annual capital cost of the absorption unit ... 34
5. CONCLUSIONS ... 36
REFERENCES ... 39 PAPERS ... 45
List of figures
Figure 1. Simulation results of the liquid phase CO2 loading and CO2
capture rate profile using the liquid phase density calculated with two different correlations. ... 2 Figure 2. Investigation done in this licentiate thesis. ... 6 Figure 3. Gas and liquid phases mass transfer occurring in a control
volume based on the two-film theory of mass transfer (adapted from [13] and [21]). ... 11 Figure 4. Design algorithm of the column diameter and packing height. .. 14 Figure 5. Chemical absorption process flow sheet (adapted from [48]). ... 19 Figure 6. Process flow sheet of physical absorption with two-stage flash
desorption (Adapted from [56])... 23 Figure 7. Flow diagram of a conventional PSA CO2 capture process
(Adapted from [63]). ... 25 Figure 8. Two-stage membrane system for CO2 capture from flue gas
(Adapted from [85]). ... 27 Figure 9. Simulation result validation (a) CO2 concentration profile in the
gas phase (b) CO2 loading in the liquid phase. ... 30
Figure 10. Sensitivity analysis results of the influences of the gas phase density, liquid phase density and liquid phase viscosity on (a) gas flux at flooding and (b) column diameter ... 32 Figure 11. Sensitivity analysis results of the influences of the fluid
properties on the total packing height (a) the gas phase properties (b) the liquid phase properties. ... 34 Figure 12. Sensitivity results of the fluid properties on the percentage of
List of tables
Table 1. Input summary for absorption process simulation and absorber design [12]. ... 7 Table 2. Required properties for determination of the design parameters.
... 13 Table 3. The thermo-physical data and correlations used in the MATLAB
absorber model. ... 15 Table 4. Uncertainty ranges of property models of CO2 mixtures. ... 15
Table 5. Base case parameters and the list of main equipment used for the economic analysis [8]. ... 16 Table 6. Existing studies of property impacts on chemical absorption
processes. ... 21 Table 7. Existing studies of property impacts on physical absorption. .... 24 Table 8. Status of the existing studies of the property impacts on the CO2
capture processes. ... 28 Table 9. The property ranges of the base case along the column. ... 29
Nomenclature
Symbolsa
A Required capacity or size of equipment
b
A Base capacity or size of equipment
AC Annual capital cost, $ e
a Effective interfacial area, m2/m3
p
a Packing specific surface area, m2/m3
2 CO
C
CO2 molar concentration, kmol/m32, CO i
C CO2 molar concentration at the gas-liquid interface,
kmol/m3
MEA
C MEA molar concentration, kmol/m3
Cp Heat capacity, kJ/kgK
T
C Capital cost of the plant, $ 0
C Purchasing cost of equipment, $
0 1
C Purchasing cost of the base case, $
0 2
C Purchasing cost at the desired time, $
2 CO D Diffusivity of CO2, m2/s MEA D Diffusivity of MEA, m2/s p
d Nominal packing size, m E Enhancement factor
E Instantaneous reaction
G D
F Design gas flux, kg/m2s
LV
F Flow parameter
,
G mass fl
F Gas flux at flooding, kg/m2s
Fr Froude number
mass
G Gas mass flow rate, kg/s
mol
G Molar flow rate of gas per unit cross-sectional area of the column, kmol/m2s
s
G Molar flow rate of inert gases, kmol/s g Gravitational constant, m/s2
2 CO
H Henry’s law constant, kmol/m3kPa
R
H Heat of reaction, kJ/kmol
S
H Heat of solution, kJ/kmol
h Heat transfer coefficient, W/m2K
1
I Cost index values at the time of the base case 2
I Cost index values at the desired time
M
J Colburn factor for mass transfer
H
KG Overall mass transfer coefficient incorporating gas and
liquid side transfer resistance, kmol/m2skPa
G
k Gas film mass transfer coefficient, kmol/m2skPa L
k Liquid film mass transfer coefficient, m/s 2
k Second-order rate constant, m3/kmols
mass
L Liquid mass flow rate, kg/s
mol
L Molar flow rate of liquid per unit cross-sectional area of the column, kmol/m2s
M Hatta modulus
2 CO
N
Molar flux of CO2, kmol/m2sn
Cost componentPr Prandtl number
T
P Total pressure, kPa
2 CO
p Partial pressure of CO2 in bulk gas phase, kPa
R Universal gas constant, J/molK
Re Reynolds number
Sc Schmidt number
2 CO
S
Source term representing the overall rate of absorption of CO2St Mass transfer Stanton number H
St Stanton number which is a modified Nusselt number
T Temperature, K
u
Superficial velocity, m/smol
W Molar flow rate of water per unit cross -sectional area of the column, kmol/m2s
We Weber number MEA
X Mole fraction of MEA in water
2 CO
Y Mole fraction of CO2 in gas phase
fl Y Capacity parameter
z
Packing height, m Greek Letters Density, kg/m3 µ Viscosity, kg/ms Dimensionless constant depends on the packing size
MEA Stoichiometric number of MEA in the reaction (A)
Surface tension, N/m2c Critical surface tension of packing material, N/m2
Thermal conductivity, kJ/msK
Plant life time, year
Interest rate, % Cross-sectional area of the column, m2
Subscripts
AVG Average
G Gas
L Liquid
Abbreviations
CCS Carbon Capture and Storage
CEPCI Chemical Engineering Plant Cost Index
COS Carbonyl sulfide
e-NRTL Electrolyte Nonrandom Two-liquid
EOS Equation of state
GDPC Generalized pressure drop correlation
GHG Greenhouse gas
IEA International Energy Agency
KSMHV2 Kwong–Soave with modified Huron–Vidal mixing rules
MEA Monoethanolamine
NGCC Natural gas combined cycle
PC-SAFT Perturbed-Chain Statistical Associating Fluid Theory equation of states
PR Peng–Robinson
PRMHV2 Peng–Robinson with modified Huron–Vidal mixing rules
PRWS Peng–Robinson with Wong–Sandler mixing rules PSA Pressure swing adsorption
PSRK Predictive Soave–Redlich–Kwong RK-ASPEN Redlich–Kwong-ASPEN
RKSWS Redlich–Kwong–Soave with Wong–Sandler mixing rules
SR-POLAR Schwartzentruber–Renon TSA Temperature swing adsorption VSA Vacuum swing adsorption
1
1.
Introduction
1.1 Background
As reported by the International Energy Agency (IEA), to achieve the 2-degree target of climate change by 2050, Carbon Capture and Storage (CCS) accounts for 13% of the total greenhouse gases (GHG) mitigation potential [1]. The CCS chain consists of four steps: capture, conditioning, transport, and storage. The capture technologies can be divided into three categories which are post-combustion, pre-combustion and oxy-fuel combustion captures.
For post-combustion, CO2 at low concentrations is captured from the flue
gas (≈ 4 mol% from natural gas combined cycle (NGCC) and ≈ 15 mol% from the coal-fired power plant). In comparison with the other two technologies, post-combustion is easy to implement as a retrofit option for existing plants since the significant changes in the plants are not required. Pre-combustion capture is competitive in economy and efficiency since it captures CO2 from
the syngas produced by the gasification process with high CO2 concentration
(≈ 35 - 45 mol%). However, in comparison with the traditional pulverized coal-fired power plant, the capital cost of the gasification process is often higher. For oxy-fuel combustion, because the combustion occurs in a nitrogen-less environment, results in flue gases mainly containing CO2 and steam
(H2O). CO2 of high purity (≈ 80 - 98%) can be easily separated by simple
water condensation and downstream purification. Even though the process is technically feasible, it requires a large amount of oxygen from the air separa-tion unit which is costly and energy intensive [2,3].
Before CO2 is transported, it typically passes through a conditioning
pro-cess to meet transportation requirements. CO2 conditioning involves processes
such as compression/pumping, condensation, and liquefaction [4]. CO2 can be
transported to the storage sites either by pipeline or in vessels. CO2 can either
be stored geologically by injecting CO2 into geologic formation deep
under-ground or be sequestrated in the ocean.
The most readiness post-combustion capture technology is chemical ab-sorption. By using aqueous amines, it can capture CO2 from gas streams with
low CO2 concentrations due to the high reaction rate of aqueous amines with
CO2 [4]. However, the process is considered not economically feasible due to
the high capital cost and thermal energy requirement [5,6]. From the techno-economic analyses of chemical absorption based CO2 capture plants show that
2
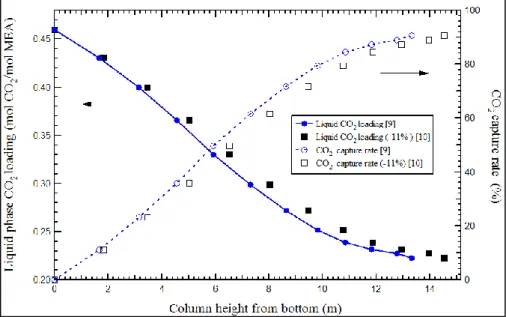
hydrodynamic properties, and mass and energy transfer accurately play an im-portant role in the absorber design and the thermo-physical properties are es-sential for the calculations. For example, the two liquid phase density correla-tions proposed by [9] and [10] were evaluated in [11]. The average difference in the calculated liquid phase density between these two correlations is 11%. As shown in Figure 1, when both correlations are used to calculate the liquid phase CO2 loading and the CO2 capture rate, the significant deviations were
observed. Consequently, these differences will further result in uncertainties in the prediction of packing height of the absorbers. Several other thermo-physical properties, such as the viscosity, diffusivity and surface tension, are involved in the calculations of hydrodynamics, and mass and energy transfer. However, the impacts of the thermo-physical properties on the design param-eters of the absorber, such as column diameter and packing height, have rarely been studied.
Figure 1. Simulation results of the liquid phase CO2 loading and CO2 cap-ture rate profile using the liquid phase density calculated with two different correlations.
3
1.2 Knowledge gaps
Different CCS processes involve different thermo-physical properties with different property impacts.
For the design and operation of different CCS processes, the sound under-standing on the thermodynamic and transport properties of the CO2 mixtures
is required. Moreover, the priority of the property model development should also be identified. Several studies on the CCS processes have been focused on the novel materials, process optimisations and techno-economic analyses. However, the systematic analysis of the property impacts on the CCS process has rarely been conducted.
The addressed research questions in this licentiate thesis include: RQ1: What are the processes that are most sensitive to the properties? RQ2: What are the property impacts on the absorber design for chemical
absorption?
RQ3: What developments are needed for the property models?
1.3 Objectives
The overall objective of this thesis is to establish the state of the art of property impact studies and provides a suggestion for the future research on the prop-erties of CO2 mixtures. Furthermore, it also aims to identify the key properties
and the priority for the property model development for chemical absorption process with aqueous amine solution. The specific goals of the thesis can be listed as the following points:
To identify the impacts of the related thermo-physical properties on the design and operation of the CO2 capture processes: chemical absorption,
physical absorption, physical adsorption and membrane separation, by re-viewing existing works, including pointing out the knowledge gaps of the property impact studies.
To quantitatively analyse the impacts of the thermo-physical properties of gas and liquid mixtures on the designs of the column diameter and packing height, as well as the impacts on the absorption unit capital cost for chem-ical absorption.
To identify the key properties and the priority of the property model de-velopment for the chemical absorption process.
4
1.4 Contributions of the thesis
Corresponding to the appended papers, the main contributions of this licenti-ate thesis consist of:
Paper I reviews the existing studies of the thermo-physical properties of CO2 and CO2 mixtures and their impacts on the design and operation of
the CO2 capture processes including chemical absorption, physical
ab-sorption, physical adsorption and membrane separation. The paper also identifies the knowledge gaps of the property impact studies of each pro-cess. Besides, the priority analysis of the property models development from the available information in the literatures was further conducted. Paper II develops an in-house rate-based absorption model in MATLAB
for the simulation of the absorption column using aqueous monoethano-lamine (MEA). The impacts of gas phase density, viscosity, and diffusiv-ity on the design packing height were also studied.
Paper III improves the in-house rate-based absorption model from paper II for the better prediction of the absorption phenomena along the packing height. The sensitivity studies of the gas and liquid phase thermo-physical properties were applied to obtain the quantitative results of their impacts on the design of column diameter and the total packing height. Moreover, an economic evaluation and the sensitivity study on the capital cost of the absorption unit were also conducted.
1.5 Thesis outline
This licentiate thesis is written based on the appended paper and divided into the following six chapters.
Chapter 1 Introduction
The chapter introduces the thesis background, knowledge gaps, objectives, thesis contributions, and outline.
Chapter 2 Methodology and model description
The overall methodology, the model developed for the reactive chemical absorption simulation, the absorber design, the ther-mos-physical property database and models, and the annual capital cost evaluation are described.
Chapter 3 Status and progress of the property impact studies (Paper I)
The chapter reviews the existing studies of the related thermo-physical properties and their impacts. The knowledge gaps and the priority for property model development are also defined.
5
Chapter 4 Thermo-physical property impacts on the absorber design and the annual capital cost of the absorption unit (Paper II, III)
The simulation results from the rate-based absorption model, and the validation are reported. Moreover, the chapter also re-ports the sensitivity results of the gas and liquid phase property on the absorber diameter, packing height and the annual capital cost of the absorption unit.
Chapter 5 Conclusions
The main findings of the research are concluded in this chapter.
Chapter 6 Future studies
6
2. Methodology and model description
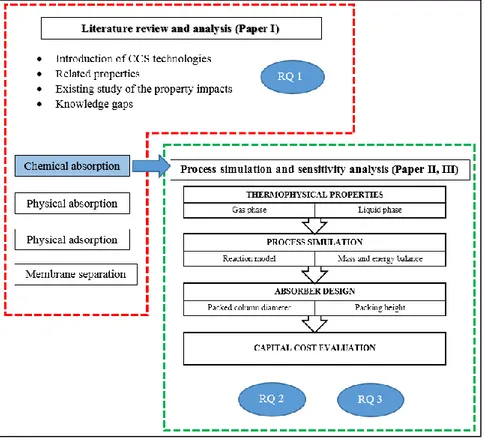
The overall research methodology is demonstrated in Figure 2. First the liter-ature review was conducted regarding the property impacts on the CO2 capture
processes (Paper I), such as chemical absorption, physical absorption, physi-cal adsorption and membrane separation. Chemiphysi-cal absorption was chosen for the further study to identify the quantitative impacts of the related properties in absorber design and annual capital cost (Papers II and III).
An in-house model about the absorption column was built in MATLAB and validated. The sensitivity analyses were conducted to quantitatively eval-uate the impacts of different properties on the design of the random packing absorber which are the diameter and the packing height. The annual capital cost of the absorption unit was estimated according to the operation parame-ters of a 400 MW coal-fired power plant.
7
2.1 Process simulation of chemical absorption
The input data for the simulation in paper II and III, as listed in Table 1, was taken from [12]. Moreover, for the absorption model validation, the calculated CO2 concentration of the gas phase and liquid phase CO2 loading profiles
along the packing height were compared with the Aspen simulation results reported in [12].
To simulate the CO2 absorption, the reaction model, mass balance and
en-ergy balance are considered.
Table 1. Input summary for absorption process simulation and absorber design [12].
Simulation input data [12] Flue gas
Gas flow rate (kmol/hr) 10,000 Inlet CO2 concentration (%mol) 11.77 Inlet gas temperature (K) 328.15 Absorber inlet pressure (kPa) 111.33
Solvent
Solvent type 30 wt% MEA Rich solvent flow rate (kmol/hr) 47,080 Lean solvent temperature (K) 313.15 Lean loading (molCO2/molMEA) 0.22 Rich loading (molCO2/molMEA) 0.46 CO2 capture rate (%) 85
Absorber
Packing type Random packing Cascade Mini Rings #2 Packing height (m) 15
Internal diameter (m) 7
2.1.1 Reaction model
A reaction model based on two-film theory for fast reaction and a gas - liquid contactor model based on the mass and energy balances are used for the ab-sorption process simulation [13]. Reactions (A), (B) and (C) represent the overall reactions representing the reaction mechanism for CO2-MEA systems
which are carbamate formation, bicarbonate formation and reversion of car-bamate to bicarbonate, respectively.
CO2 + 2RNH2 → RNHCOO− + RNH3+ (A)
CO2 + RNH2 + H2O → HCO3− + RNH3+ (B)
8
The rate of bicarbonate formation is negligible compared to the formation of carbamate since the absorption process was run at CO2/MEA mole ratios less
than 0.5. Thus, reaction (A) can represent the overall reactions and is consid-ered to be approximately irreversible [13,14]. The overall reaction rate is sec-ond-order with respect to CO2 and amine concentrations. Equation (1) is the
correlation proposed by [15] for the second-order rate constant( )k2 depends on the temperature ( )TL of the liquid solution.
2 2152 log 10.99L k
T (1)
For the reaction model, the overall rate of absorption of CO2 in aqueous amine
based on the two-film theory for a fast second-order reaction can be expressed by equation (2) [13]: 2 2 2 (1/ ) ( / ) CO CO G e CO L e p r k a H k a E (2)
where ae is the effective interfacial area,
H
CO2 is Henry’s law constantrepresented the solubility of CO2 in the aqueous solvent, kG is the gas film
mass transfer coefficients, kL is the liquid film mass transfer coefficients and 2
CO
p is the partial pressure of CO2 in bulk gas phase. The mass transfer
coef-ficients and effective interfacial area were determined by the correlations pro-posed by [16]: 2 2 1/3 0.7 , 2.0 , ( ) p CO G G G G G p p p G G CO G G a D u µ k a d a µ D RT (3)
2 0.5 2/3 1/3 0.4 , 0.0051 L L L L L p p e L L CO L L u µ µ g k a d a µ D (4)
0.75 0.1 0.05 0.2 1 exp 1.45 e c L L L p L a Re Fr We a (5)where ap is the packing specific surface area, dpis the nominal packing size,
is dimensionless constant which depends on the packing size, DCO G2, and2, CO L
D are the diffusivities of CO2 in gas and liquid, respectively, R is the
universal gas constant, TG is the gas phase temperature, uG and uL are the superficial velocity of gas and liquid, respectively,
cis the critical surface tension of packing material,
L is the surface tension of liquid, µGand µL are9
the viscosity of gas and liquid, respectively,
G and
L are the density of gas and liquid, respectively, ReL, FrL and WeLare Reynolds, Froude and Weber number, respectively: L L L p L u Re a µ (6) 2 L p L u a Fr g (7) 2 L L L L p u We a (8)
where 𝑔𝑔 is the gravitational constant. The applicable ranges of the effective interfacial area correlation are 0.04 500 ReL , 5 10 1 .8 1 0 9 2
L Fr , 8 1 .2 10 0.272 L We and 0.3 / 2 c L [17].
The enhancement factor needs to be considered for the mass transfer which is enhanced by chemical reaction [18]:
1.35 1.35 1/1.35 1 1 1 [(1/ ( 1)) (1/ ( 1)) ] E E E (9) 2 2 , , , , 1
MEA L MEA L MEA CO L CO i C D E D C (10) 1 M E tanh M (11) 2, 2 , 2 2 CO L MEA L L D k C M k (12)where CCO i2, is the CO2 molar concentration at the gas-liquid interface, CMEA L, is the MEA molar concentration in bulk liquid, DMEA L, is the diffusivity of MEA in liquid, and
MEA is the stoichiometric number of MEA in the reaction (A).2.1.2 Mass balances
To calculate mass and energy balances, the column was divided into small control volumes, and in each control volume, the concentration and properties of both liquid and gas phases were assumed to be homogeneous. The CO2
10
concentration profile in the gas phase can be retrieved from the steady-state, one-dimensional species conservation equation:
2 2 2 , , ( ) G CO G CO G CO d u C dN S dz dz (13)
where CCO ,G2 is the molar concentration of CO2 in the gas phase, NCO G2,
2, 2
(u CG CO G G Ymol CO ) is the molar flux of CO2, YCO2 is the mole fraction of
CO2 in the gas phase,SCO2is the source term representing the overall rate of
absorption of CO2, which can be retrieved from equation (2). However, in this
study, the concentration of CO2 in the gas phase at the top of each control
volume was assumed. The MEA concentration and the temperature of the liq-uid phase at the top and bottom of each control volume were calculated as demonstrated in Figure 3. To retrieve the MEA concentration along the column, the mass balance over each control volume need to be calculated fol-lowing equation (14) [13]: 2 2 1 1 ( ) CO i CO i MEA mol MEAi MEA m l i o Y Y G W X X (14)
where XMEA is the mole fraction of MEA in water, Wmol is the molar flow rate of water and Gmol is the molar flow rate of gas per unit cross-sectional area of
the column.
2.1.3 Energy balances
During the absorption, not only the heat of solution but also the heat of reac-tion are released due to the exothermic chemical reacreac-tion which increases both the liquid and the gas temperature. Equation (15) and (16) were used to deter-mine the temperature profile of the gas and liquid phases, respectively with the assumption that there is no heat loss to the surrounding [13]:
2 ( ) G mol CO GdT G e G L G Y Cp h a T T dz (15) 2 2 ( ) CO L G L mol CO G mol R mol S dY dT dT Cp G Y Cp G H H d dz L z dz (16)
where Lmol is the molar flow rate of liquid per unit cross-sectional area of the
column,hG is the gas phase heat transfer coefficient of the gas phase, HR and
S
H are the heat of reaction and the heat of solution, respectively, CpG and
L
Cp are the heat capacity of gas and liquid phase, respectively, z is the pack-ing height. The values of HR and HS were taken from [19]. The values of
11
G
h were obtained from dimensionless analogy, the well-known Chilton-Col-burn j-factor [20]. 2/3 . M J St Sc (17) 2/3 . H H J St Pr (18) Then
2/3 2 2/3 , ( / )
G G G G G CO G h k Cp D (19)Where JM and JH are the Colburn factor for mass and heat transfer, respec-tively,
St
is the mass transfer Stanton number, StH is the Stanton number, which is a modified Nusselt number,Sc
is the Schmidt number, Pr is the Prandtl number,
G is the thermal conductivity of gas phase.2.2 Absorber design
2.2.1 Column diameter
The generalized pressure drop correlation (GDPC) was used for the diameter calculation of the packing column based on the pressure drop and flooding conditions. The required fluid properties for the calculation are the liquid
Lout Gin A AA YCO2,i+1 TG,i+1 YCO2,i TG,i XMEA,i TL,i Gas-liquid interface Bulk gas [CO2] Liq uid PCO2 PCO2,i Gas Bulk liquid Liquid film Gas film [CO2]i XMEA,i+1 TL,i+1 ∆z A Lin Gout
Figure 3. Gas and liquid phase mass transfer occurring in a control volume based on the two-film theory of mass transfer (adapted from [13] and [21]).
12
phase viscosity and the densities of the gas and liquid phases. To obtain the gas flux at flooding, the fitted equation for Eckert’s graph at flooding was applied [20]:
2 2 ,
(1000 )
0.2
G mass fl H O fl L G L L F Y g (20) 2 0.289( ) 1.081 1.682 fl LV LVlogY logF logF (21)
mass L LV mass G L F G (22)
where Yfl is the capacity parameter, H O2 is the water density,
is thepack-ing factor, FLV is the flow parameter, Gmass and Lmass are the mass flow rates
of gas and liquid, respectively, and Fmass flG , is the gas flux at flooding,
respec-tively. The design gas flux
G DF was chosen at 80% ofFmass flG , . After obtaining
the G D
F , the column cross-sectional area, and diameter can be retrieved.
2.2.2 Packing height
For packing height calculation, the pressure drop along the column was taken from [22], and both the liquid and gas phases are assumed to move in a plug flow manner. The integral of the rate-based model for calculating the height of packing
z and the correlation of the overall mass transfer coefficient
KG
are from [23]: 1 2 2 2 2 2 , 2 , , , ( )(1 )
y CO G s e T y CO G CO L CO G dy G z a P KG y y y (23) 2 1 1 CO G L H k k E KG (24)where Gs is the molar flow rate of inert gases, PT is the total pressure,
isthe cross-sectional area of the column, yCO L2, and yCO G2, are the mole
frac-tions of CO2 in the bulk liquid and in the gas phase, respectively,
KG
is theoverall mass transfer coefficient incorporating gas and liquid side transfer re-sistances. For the calculation of packing height, since the overall reaction can be expressed by reaction (A) and was considered to be irreversible, equation (25) is used. Also, for the simplicity, the effect of back pressure was not con-sidered.
13
1 2 2 2 2 , 2 , (1 , )
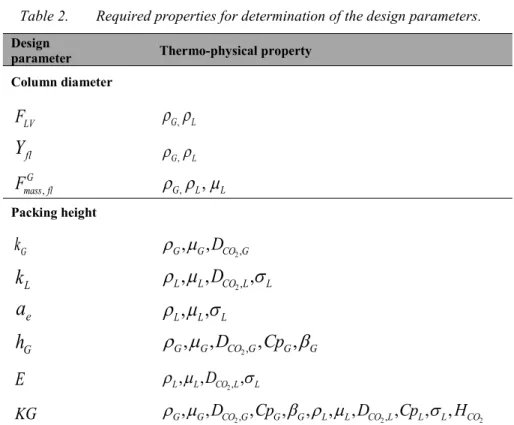
y CO G s e T y CO G CO G dy G z a P KG y y (25)The important properties used in the column design are listed in Table 2. Although CpLis not necessary for the design parameter calculation, it is
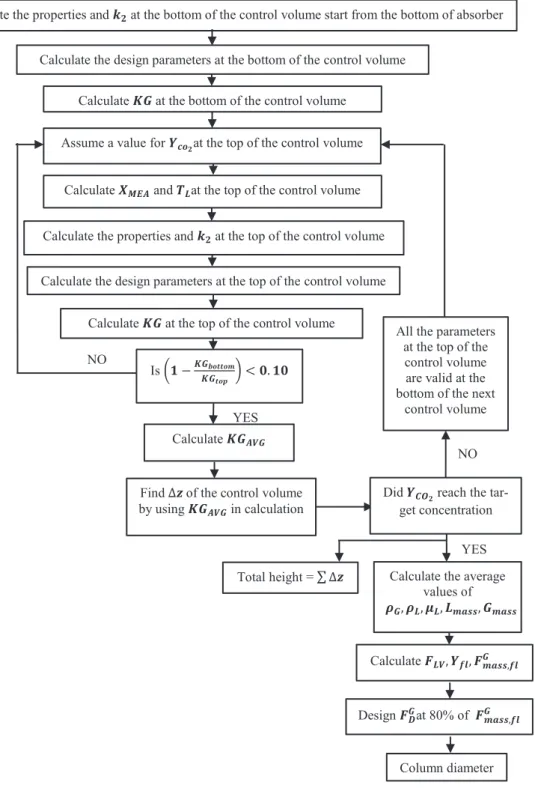
es-sential for the energy balance. The overall design algorithm of the column diameter and packing height is demonstrated in Figure 4.
Table 2. Required properties for determination of the design parameters. Design
parameter Thermo-physical property
Column diameter LV
F
G, L flY
G, L , G mass flF
G,,
L L Packing height Gk
G, ,
GD
CO G2, Lk
L, ,
LD
CO L2,,
L ea
L, ,
L L Gh
G,
G,
D
CO G2,,
Cp
G,
GE
L, , , L DCO L2, L KG
G, , ,G DCO G2, CpG,
G, L, , ,L DCO L2, CpL, ,
L HCO214
Figure 4. Design algorithm of the column diameter and packing height
.
Column diameter Design 𝑭𝑭𝑫𝑫𝑮𝑮at 80% of 𝑭𝑭𝒎𝒎𝒎𝒎𝒎𝒎𝒎𝒎,𝒇𝒇𝒇𝒇𝑮𝑮Calculate 𝑭𝑭𝑳𝑳𝑳𝑳, 𝒀𝒀𝒇𝒇𝒇𝒇, 𝑭𝑭𝒎𝒎𝒎𝒎𝒎𝒎𝒎𝒎,𝒇𝒇𝒇𝒇𝑮𝑮
Calculate the average values of 𝝆𝝆𝑮𝑮, 𝝆𝝆𝑳𝑳, 𝝁𝝁𝑳𝑳, 𝑳𝑳𝒎𝒎𝒎𝒎𝒎𝒎𝒎𝒎, 𝑮𝑮𝒎𝒎𝒎𝒎𝒎𝒎𝒎𝒎
YES
Total height = ∆𝒛𝒛
Did 𝒀𝒀𝑪𝑪𝑶𝑶𝟐𝟐 reach the tar-get concentration All the parameters
at the top of the control volume are valid at the bottom of the next
control volume
Find ∆𝒛𝒛 of the control volume by using 𝑲𝑲𝑮𝑮𝑨𝑨𝑳𝑳𝑮𝑮 in calculation
Calculate 𝑲𝑲𝑮𝑮𝑨𝑨𝑳𝑳𝑮𝑮
Assume a value for 𝒀𝒀𝒄𝒄𝒐𝒐𝟐𝟐at the top of the control volume Calculate the design parameters at the bottom of the control volume
Calculate the properties and 𝒌𝒌𝟐𝟐 at the bottom of the control volume start from the bottom of absorber
Calculate 𝑲𝑲𝑮𝑮 at the bottom of the control volume
Calculate 𝑿𝑿𝑴𝑴𝑴𝑴𝑨𝑨 and 𝑻𝑻𝑳𝑳at the top of the control volume
Calculate 𝑲𝑲𝑮𝑮 at the top of the control volume Is 𝟏𝟏 −𝑲𝑲𝑮𝑮𝒃𝒃𝒐𝒐𝒃𝒃𝒃𝒃𝒐𝒐𝒎𝒎
𝑲𝑲𝑮𝑮𝒃𝒃𝒐𝒐𝒕𝒕 < 𝟎𝟎. 𝟏𝟏𝟎𝟎 NO
NO Calculate the design parameters at the top of the control volume
Calculate the properties and 𝒌𝒌𝟐𝟐 at the top of the control volume
15
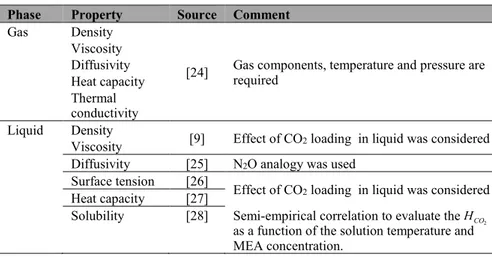
2.3 Thermo-physical properties
The database [24] provides all required thermo-physical properties of the flue gas mixtures under the studied conditions was used to obtain the gas phase properties. The different property models selected for the liquid phase proper-ties are illustrated in Table 3.
Table 3. The thermo-physical data and correlations used in the MATLAB absorber model.
Phase Property Source Comment
Gas Density
[24] Gas components, temperature and pressure are required Viscosity
Diffusivity Heat capacity Thermal conductivity
Liquid Density [9] Effect of CO
2 loading in liquid was considered Viscosity
Diffusivity [25] N2O analogy was used Surface tension [26] Effect of CO
2 loading in liquid was considered Heat capacity [27]
Solubility [28] Semi-empirical correlation to evaluate theHCO2 as a function of the solution temperature and MEA concentration.
Table 4 illustrates the collected uncertainty ranges of property models. The accuracies of calculated thermo-physical properties vary with the type of prop-erties and the models used. From the collected data, the gas phase diffusivity shows the highest uncertainty range which is up to 20%. To identify the property impacts within the possible deviation range of the property models, the sensitivity studies were conducted to evaluate the deviation range at ±20%.
Table 4. Uncertainty ranges of property models of CO2 mixtures.
Phase Mixture Property Uncertainty Range % Source
Gas CO2/N2 Density ±14 [29–31] CO2/N2 Viscosity ±8 [32] CO2/N2, CO2/O2 Diffusivity ±21 Liquid CO2/MEA/H2O, MEA/H2O Density ±11 [11,9,33,34] Viscosity ±13 [9,33,34] Diffusivity ±3 [35,36] Surface tension ±3 [26,37,38] Heat capacity ±4 [27,39,40]
16
2.4 Annual capital cost
The quantitative analysis of the property impacts on the annual capital cost (AC) of the absorption unit was analysed. The base case for the capital cost calculation was from [8] which is a 400 MW coal-fired power plant. Table 5 illustrates the plant specification necessary for the economic evaluation.
Table 5. Base case parameters and the list of main equip-ment used for the economic analysis [8].
Parameter Cost estimation input data [8]
Net power output (MWe) 400 Flue gas flow rate (kg/s) 320
CO2 (vol%) 13.73
Solvent flow rate (kg/s) 1398
MEA (wt%) 30
Lean loading (molCO2/molMEA) 0.27 Rich loading (molCO2/molMEA) 0.48 Liquid-to-Gas ratio 5.31 Blower inlet temperature (K) 323.15 Blower inlet pressure (kPa) 101.60 CO2 capture rate (%) 90
Main equipment type Material
Column Stainless steel
Packing, (Mellapak 250Y) Stainless steel
Blower Carbon steel
Pump Stainless steel
The column diameter and packing height of the base case are 15.00 m and 25.06 m, respectively. The charts of purchasing cost reported in [41] were used to retrieve the purchasing cost for the column, blower, and pump at at-mospheric pressure with carbon steel and stainless steel construction. Moreo-ver, the cost for stainless steel Mellapak 250Y packing was retrieved from [8].
The equipment purchasing cost outside the validity range of the charts were calculated based on the six-tenths rule which includes the effect of capacity [42]: 0 0 n a a b b C A C A (26)
where C0 is the purchasing cost of equipment and
A
is the capacity or sizeof equipment, a and
b
refer to the required capacity and the base capacity, respectively,n
is the cost component which was assumed at 0.6 in this study [8,42].The effects of inflation deviation over the time were taken into account by adjusting the purchasing cost data from the year 2002 to 2014 for the column,
17
blower, and pump, while from the year 2011 to 2014 for the packing using the correlation from [42], as given below:
0 0 1 2 1 2 I C C I (27) where 0 1
C is the known purchasing cost of the base case, 0 2
C is the purchasing
cost at the desired time, I1and I2are the cost index values based on the Chemical Engineering Plant Cost Index (CEPCI) at the time for purchasing the equipment in the base case and the desired time for the cost analysis. The CEPCI for the year 2002, 2011, and 2014 were taken from [43,44].
The total cost of CO2 absorption unit ( )CT is estimated from the total
pur-chasing equipment cost by the use of Lang Factor method [42]. In order to estimate the AC, the plant life time ( )
and interest rate
were assumed to be 20 years and 10%, respectively:(1 ) 1/ (1 )
T
C
18
3. Status and progress of the property impact
studies (Paper I)
Each capture technology involves different properties at different operating conditions. Moreover, the different properties impact the process in different degrees. Paper I reviews existing studies of the related properties and their impacts on the CO2 capture processes: chemical absorption, physical
absorp-tion, physical adsorption and membrane separation.
3.1 Chemical absorption
3.1.1 Related properties in chemical absorption
As demonstrated in Figure 5, the main units for chemical absorption are an absorber, a desorber, a reboiler and a heat exchanger. CO2 is absorbed in the
absorber before being released by vapor stripping in the desorber. The steam for solvent regeneration is produced by the reboiler, while the heat of rich and lean solvents are exchanged in the heat exchanger. Chemical absorption using aqueous amines can be applied to capture CO2 from gas streams with low CO2
concentrations due to the high reaction rate of the solvent with CO2 [5]. For
chemical absorption, large volumes of the absorber and desorber with a large amount of thermal energy are typically required to achieve a high recovery rate of CO2. The main investment and operating costs are from the capital cost
of the absorber/desorber columns and the cost of the required thermal energy, respectively. Therefore, the sizing of the absorber/desorber columns and the operating condition and energy requirement of the reboiler are important is-sues for process application [45–47].
Several properties are required for the design of the absorber/desorber col-umns. Apart from that, the energy demand for solvent regeneration can be estimated using the phase equilibrium data, heat capacity and thermal conduc-tivity. The sensible heat for solvent heating, the latent heat for water evapora-tion and the heat of reacevapora-tion for the desorpevapora-tion of CO2 are the three parts of
en-19
thalpy balance by the use of thermal conductivity and heat capacity. Moreo-ver, the phase equilibrium is required for the estimation of the latent heat and the heat of reaction [12,46,47].
Figure 5. Chemical absorption process flow sheet (adapted from [48]).
3.1.2 Existing studies of property impacts on chemical
absorption
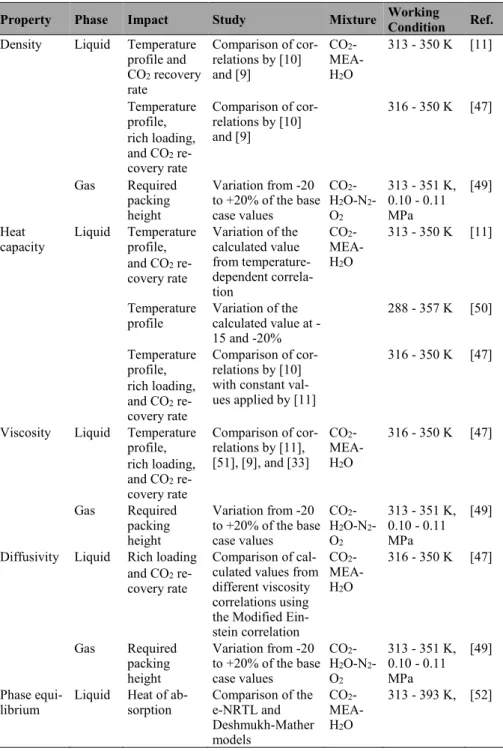
Table 6 illustrates the existing studies of property impacts on chemical ab-sorption processes.
Density
From [11] the authors compared the results of the temperature bulge of the liquid phase in the packed column from a rate-based absorption model using two different liquid phase density correlations [10,9]. It was found that an 11% difference in density affects the magnitude and location of the temperature bulge. However, the quantitative impacts of the density were not reported.
[47] reported that the deviation in density values from the correlation by [10] and [9] caused significant deviations in the liquid temperature profiles, particularly in the area near the temperature bulge. However, the impacts on the rich CO2 loading and CO2 recovery rate are insignificant. The deviation of
the rich stream temperature, the rich loading and the recovery rate between the two cases were 0.7%, 0.2%, and 0.7%, respectively.
The gas phase density impact on the random packing height design for MEA absorption was determined in [49]. A combination of the reactive ab-sorption process model and the integral rate based model was used to calculate the required packing height of the absorber. However, the reported impact of gas phase density is found to be overestimated.
20
Heat capacity
Three constant values based on a temperature-dependent correlation were used to investigate the impact of the liquid phase heat capacity in [11]. The deviation of heat capacity significantly impacts the location and magnitude of the bulge in the liquid phase temperature profile. Apart from the temperature profile, a reduction of 40% and 77% in heat capacity reduced the CO2 recovery
rate by 1.7% and 4.9%, respectively.
Faramarzi et al. [50] varied the heat capacity of the liquid phase at – 15% and – 20% to identify the impacts on the liquid temperature profile. The re-duction in heat capacity clearly increases the magnitude of the temperature bulge at the rich end of the column.
The impact of the heat capacity of liquid phase on a rate-based CO2
ab-sorber model was studied in [47]. A 16% deviation in heat capacity caused deviations in the rich stream temperature, the rich stream loading, and the CO2
recovery rate that were 3.0%, 0.5%, and 1.3%, respectively.
Viscosity and diffusivity
As reported in [47], the simulation results using correlations of [9],[51] and [33] compared with the correlations by [11] gave 1% variation for the rich stream temperature and the rich stream loading and 2-3% variation for the CO2
recovery rate. However, the quantitative results for the diffusivity impact were not reported. The variation of the simulation results was found to be more sensitive to the viscosity and diffusivity deviations compared to other proper-ties.
In [49], the viscosity gives the same range of impact magnitude but in op-posite trend with the density. For the packing height design, the most signifi-cant impact was from the deviation of the diffusivity. However, the reported impacts of viscosity and diffusivity of the gas phase were found to be overestimated.
Phase equilibrium
In [52], the heat of absorption necessary for the estimation of the thermal en-ergy requirement was retrieved from the different thermodynamic methods: e-NRTL model and the Deshmukh-Mather models. In comparison with the ex-perimental data, both models gave an acceptable prediction of the heat of ab-sorption. The e-NRTL model generates a better fit to the experimental result about absorption heat than does the Deshmukh-Mather model, particularly at high CO2 loading.
21
Table 6. Existing studies of property impacts on chemical absorption processes.
Property Phase Impact Study Mixture Working Condition Ref.
Density Liquid Temperature profile and CO2 recovery rate Comparison of cor-relations by [10] and [9] CO2 - MEA-H2O 313 - 350 K [11] Temperature profile, rich loading, and CO2 re-covery rate Comparison of cor-relations by [10] and [9] 316 - 350 K [47] Gas Required packing height Variation from -20 to +20% of the base case values CO2 -H2O-N2 -O2 313 - 351 K, 0.10 - 0.11 MPa [49] Heat
capacity Liquid Temperature profile, and CO2 re-covery rate Variation of the calculated value from temperature-dependent correla-tion CO2 - MEA-H2O 313 - 350 K [11] Temperature
profile Variation of the calculated value at -15 and -20% 288 - 357 K [50] Temperature profile, rich loading, and CO2 re-covery rate Comparison of cor-relations by [10] with constant val-ues applied by [11]
316 - 350 K [47]
Viscosity Liquid Temperature profile, rich loading, and CO2 re-covery rate Comparison of cor-relations by [11], [51], [9], and [33] CO2 - MEA-H2O 316 - 350 K [47] Gas Required packing height Variation from -20 to +20% of the base case values CO2 -H2O-N2 -O2 313 - 351 K, 0.10 - 0.11 MPa [49] Diffusivity Liquid Rich loading
and CO2 re-covery rate
Comparison of cal-culated values from different viscosity correlations using the Modified Ein-stein correlation CO2 - MEA-H2O 316 - 350 K [47] Gas Required packing height Variation from -20 to +20% of the base case values CO2 -H2O-N2 -O2 313 - 351 K, 0.10 - 0.11 MPa [49] Phase
equi-librium Liquid Heat of ab-sorption Comparison of the e-NRTL and Deshmukh-Mather models CO2 - MEA-H2O 313 - 393 K, [52]
22
3.2 Physical absorption
3.2.1 Related properties in physical absorption
Another leading commercial option for CO2 capture is physical absorption,
especially for pre-combustion capture which has a higher CO2 concentration
in the gas stream. It is efficient and economical when operated at higher pres-sures and lower temperatures. Less energy is required for solvent regeneration compared to chemical absorption. Moreover, it is not limited by the fixed stoi-chiometry of the reaction as in the case of chemical absorption, since the ab-sorption mechanism occurs only in one step which is the dissolution of CO2
into the liquid solvent [19,53,54].
As demonstrated in Figure 6, physical absorption mainly consists of two steps which are CO2 absorption and solvent regeneration by desorption and
dehydration. The solvents used in physical absorption generally have a high vapor pressure. Thus, they should be operated at low temperature and high pressure to avoid the loss. For the solvent regeneration, depending on the re-quired purity of the CO2 stream, different processes can be employed: flash at
reduced pressure, as shown in Figure 5; stripping; or distillation [54,55]. The key components of physical absorption consist of the absorber, refrig-eration system, and regenrefrig-eration units. The majority of the power and energy demands are for the refrigeration system, feed gas compressor, and solvent pump. In comparison with chemical absorption, similar but less complicate design procedure can be used for the column design of physical absorption. The saturated absorption amount of the solute in the solvent can be estimated from the vapor-liquid equilibrium of the system [56].
Due to the operation at very low temperature, the main energy consumption of this process is for the refrigeration system. For the heat exchanger design and the cooling load estimation, the heat transfer coefficient is needed. Several properties of the fluids in the heat exchanger are required in the calculation of this parameter [57,58]. In the case of shell and tube heat exchangers, the tube-side heat transfer coefficient is a function of the Reynolds number, the Prandtl number, and the tube diameter. The first two parameters are the function of density, viscosity, thermal conductivity, heat capacity, and superficial velocity of the stream [59]. For the flash regeneration, the rich solvent is flashed through several stages to reduce the solubility at a lower partial pressure. Therefore, the phase equilibrium of the mixture is important [54,55].
23
Figure 6. Process flow sheet of physical absorption with two-stage flash desorption (Adapted from [56])
3.2.2 Existing studies of property impacts on physical
absorption
The existing studies of property impacts on physical absorption processes are listed in Table 7. The impacts of implementing different property models on the top column temperature, the pressure, the mole flow and the mole fraction in the Rectisol process operation were determined in [54]. Unfortunately, the specific impact of each thermodynamic property was not assessed. Except for the CO2 concentration of the output purified syngas (approximately 15%
er-ror) and the mole flow of the rich solvent (approximately 30% erer-ror), the Per-turbed-Chain Statistical Associating Fluid Theory equation of states (PC-SAFT EOS) yielded simulation results with the smallest deviations compared with the design data. However, for predicting the CO2 concentration of the
output purified syngas and the mole flow of the rich solvent, a revised PC-SAFT provides better prediction results with 0.07% error for the former and 4.9% error for the latter.
By comparing with the on-site data, the uncertainties in property prediction of the thermodynamic models in commercial process simulators, such as ProII with Provision and ASPEN for Rectisol absorption process were pointed out in [60]. The work concluded that due to the system is operated under extreme condition. Therefore the systematic thermodynamic behavior is far from nor-mal. The impacts of thermodynamic properties on the simulated stage temper-ature and stream composition for the CO2 absorption units using different
24
property models were evaluated. However, the quantitative impact of each property was not presented.
Table 7. Existing studies of property impacts on physical absorption.
Property Phase Impact Model Mixture Operating condition Ref.
Liquid phase den-sity, heat capacity, enthalpy, and phase equilib-rium Liquid/ gas Top column temperature, pressure, stream flow rate and com-position PR, PSRK, RK-AS-PEN, and PC-SAFT and Modi-fied PC-SAFT EOS CO2 -CH3 OH-H2-N2 -H2S -CH4 - CO-COS 223 - 254 K 3.3 - 4.4 MPa [54] Stage temper-ature and stream com-position PSRK, RK-ASPEN, RKSWS, SR-POLAR, PRWS, KSMHV2 and PRMHV2 CO2 -CH3 OH-H2-N2 -H2 S-H2 O-Ar-CH4 - CO-COS 245 K 3.63 MPa [60]
3.3 Physical adsorption
3.3.1 Related properties in physical adsorption
Different from the first two technologies, physical adsorption captures CO2 by
the use of solid sorbent. The two main feasible adsorption technologies, pres-sure/vacuum swing adsorption (PSA/VSA) and temperature swing adsorption (TSA) [61,62]. Figure 7 demonstrates the typical adsorption process which consists of the compressor, the cooler, the adsorption column, and the desorp-tion column. The flue gas is firstly compressed and sent to the adsorpdesorp-tion col-umn, where the CO2 is captured by the adsorbent, and the impurities are
expelled from the top of the adsorption tower. The CO2 is then separated, and
the adsorbent is regenerated in the desorption tower [63,64]. The majority of energy demands in physical adsorption is for the compressor. Moreover, the adsorption column is also a significant component of the process, and its de-sign and operation greatly impact the performance of the adsorption rate and the purity of the CO2 product [65,66].
For the process design and optimisation of the adsorption of the fluid on the adsorbent occurs in a fixed bed, a comprehensive model consisting of cou-pled partial differential equations of mass, energy and the momentum balance with equilibrium equations is necessary [61]. The gas-solid adsorption equi-librium is the most important parameter for the mass balance of the adsorption process since it controls the dynamic behavior, the adsorption capacity and
25
also the mass transfer coefficient of a packed column. The Sherwood number related to the Reynolds number and the Schmidt number is used for the deter-mination of the mass transfer coefficient. Therefore, the properties of CO2
mixtures, such as their density, viscosity, and diffusivity, are required for de-termining the mass balance of the adsorption column [67,68].
The gas phase energy balance can be expressed by an energy conservation equation and is related to the heat transfer coefficient, the bulk density of the CO2 mixtures, and the heat dispersion. The energy flows of the system consist
of a heat transfer between CO2 mixtures and the surface of the solid adsorbent
as well as the energy transferred to the column wall. For the heat transfer cal-culation, the density, viscosity, thermal conductivity, and heat capacity of the CO2 mixtures are necessary [69,70].
The momentum conservation equations [71,72] and the Ergun equation [73] are used to retrieve the pressure and velocity profiles necessary for the momentum balance. Moreover, the pressure drop of the CO2 mixtures due to
viscous energy losses can also be estimated. This parameter is important for the evaluation of the working capacity and the required compression work. To estimate the pressure drop, the viscosity, density, velocity, and properties of adsorbents are needed [74,75].
As mentioned above, several properties are related to the design of the ad-sorption column and operating condition. However, to the best of the authors’ knowledge, there is no research on the property impacts of the CO2 mixtures
on CO2 adsorption column design and operation.
Figure 7. Flow diagram of a conventional PSA CO2 capture process (Adapted from [63]).
26
3.4 Membrane separation
3.4.1 Related properties in membrane separation
By the use of a polymeric membrane, CO2 is separated from the flue gas by a
solution-diffusion mechanism. Starting with the sorption of CO2 in the
mem-brane structure, followed by diffusion through the memmem-brane, and ends with desorption on the permeate side of the membrane [76,77]. The separation by inorganic membranes is more complicate, since it involves molecular sieving, surface diffusion, Knudsen diffusion, and capillary condensation mechanisms [78,79].
The membrane separation process generally consists of compressors, mem-brane modules, vacuum pumps, heat exchangers and expanders as demon-strated in Figure 8 [80,81]. Compressors and vacuum pumps are required to maintain the separation driving force, which is a partial pressure difference between the feed and the permeate side. The gas temperature significantly in-creases after the compression, therefore before entering the membrane mod-ules, the gas must be cooled to the optimal operating temperature, between 313 K and 343 K for polymeric membranes [82]. Moreover, some work can be recovered by the expander.
For membranes, the selectivity and permeability of membranes are im-portant properties, which indicate the purity and degree of separation of the CO2 [81,83]. For the flue gas, the solubility of gases in membranes and the
diffusion coefficient of the separated species through the membranes are the key properties, both of which properties vary with the gas and polymer type [84].
The required membrane surface area is the main capital cost for this sepa-ration technology which can be derived from the gas flux through the mem-brane. The gas flux values are directly proportional to the diffusion coefficient of CO2 through the polymer [83].
Unfortunately, to the best knowledge of the authors, no studies have been conducted on the property impacts of the CO2 mixtures on the membrane CO2
27
Figure 8. Two-stage membrane system for CO2 capture from flue gas (Adapted from [85]).
3.5 Summary of the important findings
The impacts of the properties on the process parameters of chemical absorp-tion were quantitatively studied. The density and heat capacity of the liquid phase have notable effects on the location and magnitude of the temperature bulge in the liquid phase temperature profile along the packed bed absorber. However, in comparison with the viscosity and diffusivity of the liquid phase, the variation in the rich stream loading and CO2 recovery rate caused by the
deviations of the density and heat capacity were less significant. For the gas phase properties, the impact of the gas phase diffusivity was found to be more obvious than the impacts of the density and viscosity. The impact of the phase equilibrium used to retrieve the activity coefficients of the species for the cal-culation of the heat of absorption was also reported. The heat of absorption of CO2 in the amine solution is affected by the deviation of the phase equilibrium,
correspondingly, it affects directly on the calculation of the energy require-ment for the solvent regeneration. For both transport and thermodynamic properties, the large knowledge gaps were found in the quantitative studies of the property impacts on chemical absorption processes. Several parts of the design and operation have not been studied concerning the property impacts, especially in the desorption part which is more complicated than the absorp-tion. For several properties, such as surface tension and thermal conductivity, the property impact studies were not found.
For the physical absorption process, only the impacts of liquid phase den-sity, heat capacity, enthalpy, and phase equilibrium on the Rectisol process were found. The focused process parameter are the temperature, pressure, mole flow, and mole fraction of each component of the streams leaving the absorbers. However, the quantitative results of the property impacts are not
![Table 1. Input summary for absorption process simulation and absorber design [12].](https://thumb-eu.123doks.com/thumbv2/5dokorg/4839268.130876/23.718.181.576.267.608/table-input-summary-absorption-process-simulation-absorber-design.webp)
![Figure 3. Gas and liquid phase mass transfer occurring in a control volume based on the two- two-film theory of mass transfer (adapted from [13] and [21])](https://thumb-eu.123doks.com/thumbv2/5dokorg/4839268.130876/27.718.79.673.401.675/figure-liquid-transfer-occurring-control-volume-transfer-adapted.webp)
![Table 5. Base case parameters and the list of main equip- equip-ment used for the economic analysis [8]](https://thumb-eu.123doks.com/thumbv2/5dokorg/4839268.130876/32.718.151.528.246.535/table-base-case-parameters-equip-equip-economic-analysis.webp)
![Figure 5. Chemical absorption process flow sheet (adapted from [48]).](https://thumb-eu.123doks.com/thumbv2/5dokorg/4839268.130876/35.718.129.635.149.405/figure-chemical-absorption-process-flow-sheet-adapted.webp)