IS CYCLING A SAFE MODE? COMPARING APPLES WITH APPLES
Dr Glen KooreySenior Lecturer in Transportation,
Dept of Civil and Natural Resources Engineering, University of Canterbury, Private Bag 4800, Christchurch 8140, New Zealand
Phone: +64-3-3642951, Email: Glen.Koorey@canterbury.ac.nz
Wai Kit (Ben) Wong
MET Candidate, Dept of Civil and Natural Resources Engineering University of Canterbury, Christchurch, New Zealand
Email: ben_wwk@hotmail.com
ABSTRACT
In many countries, one of the barriers to acceptance and encouragement of cycling by politicians, policymakers, and the public is the perceived danger of the mode. This is not helped by "official" comparisons of different travel modes that typically show cycling as having a far greater injury crash rate (e.g. deaths/injuries per kilometre travelled) than other modes such as driving and walking. For example, in New Zealand, cycling is assessed as having a crash rate per km travelled nine times greater than driving. On this basis, some research and policy reports have warned against people shifting from "lower risk" modes (like driving) to "higher risk" modes (like cycling).
Such assessments may be quite unfair, from the point of view of not "comparing apples with apples". Simple comparisons of overall data ignore a number of factors, including different crash reporting rates, the relative amount of time taken by each mode to travel the same distance, the age distributions and "road experience" of travellers, and the types of road environments or facilities where people are travelling. It also ignores the cumulative "safety in numbers" effect, whereby more people cycling actually helps to reduce the individual risk of each person, and also fails to consider relative health costs other than road crashes, e.g. due to physical inactivity and motor vehicle emissions.
This paper explains how these factors affect the relative safety of different travel modes. Road crash data from 2003-09 and corresponding data from the New Zealand Household Travel Survey was used to compare the relative crash rates for travel modes in New Zealand. This results in quite different (and in many cases much more favourable) conclusions about the relative safety of cycling. For example, per hour travelled, cycling had a similar crash rate for 15-19 year olds and over 75’s when compared to driving a light motor vehicle, even before health considerations were accounted for. There were notable differences in the relative risk of modes when comparing urban vs rural roads and major vs minor roads. In similar-speed environments, a “safety in numbers” effect was also observed for cycling. The results have implications for how crash risk data should be presented and used by public agencies. It also helps to identify the road environments where protection from traffic for people cycling would be most beneficial.
1 INTRODUCTION
In many countries, one of the barriers to acceptance and encouragement of cycling by politicians, policymakers, and the public is the perceived danger of the mode. This is not helped by "official" comparisons of different travel modes that typically show cycling as having a far greater crash rate (e.g. deaths or injuries per kilometre travelled) than other modes such as driving and walking.
New Zealand is typical of this type of problem. Nationally, cycling makes up only about 1.4% of all personal trips and only about 0.6% of all personal kilometres travelled (MoT 2012a). With relatively little dedicated cycling infrastructure (except for a few cities), part of the reason for the low take-up of cycling in New Zealand is the perceived danger in using this mode. Simple comparisons of injury crash rates between cycling and other travel modes seem to support this concern. On this basis, some research and policy reports have warned against people shifting from "lower risk" modes (like driving) to "higher risk" modes (like cycling) (Cairney 2010; Stipdonk & Reurings 2012).
This paper identifies why such assessments may be quite unfair, from the point of view of not "comparing apples with apples". Simple comparisons of overall data ignore a number of factors, particularly the differing characteristics of both the travellers and their environments when considering trips made by different modes.
This paper explains how these factors affect the relative safety of different travel modes. New Zealand road crash data from 2003-09 and corresponding data from the New Zealand Household Travel Survey was used to compare the relative crash rates for travel modes in New Zealand. The aim was to address the key question for a person considering their travel options:
"What is the risk to me in making the same type of trip on the same types of facility by bike instead of driving?"
Although the data will compare a variety of different road transport modes, a lot of attention will be on comparing bicycle trips with their equivalent driving trips (although noting that the same “type” of trip, or trip purpose, may not necessarily be to the same destination). In terms of travel behaviour change, switching between these two modes is often the focus of a lot of policy and planning.
2 BACKGROUND CONTEXT
The New Zealand Household Travel Survey is an ongoing survey of household travel conducted for the Ministry of Transport (MoT 2012a). Each year, people in 4,600 households throughout New Zealand are invited to participate in the survey by recording all their travel over a two-day period. Each person in the household is then interviewed about their travel and other related information. From this information, national estimates can be made about the amount of personal travel by different modes, in terms of trips, distance travelled and time spent travelling. The data can also be split by age groups and trip purposes. To produce more robust estimates, survey data from multi-year periods are generally aggregated to provide an ongoing series of rolling averages for monitoring trends.
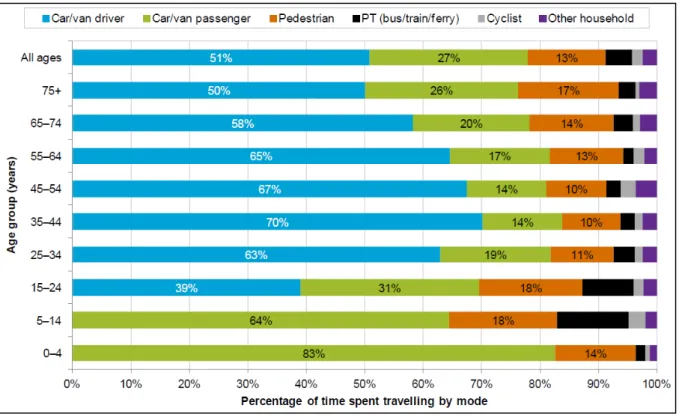
Figure 1 shows the travel patterns for different age groups. The highest percentage of cycling occurs for the 5–14 year old age group. The minimum driving age in New Zealand is
and public transport exist in the 5–14 year old age group when compared to the other age groups. However, clearly cycling is a very minor travel mode across all age groups.
Figure 1: Percentage of total time spent travelling by each mode of travel in New Zealand 2008-11 (MoT 2012a)
Having determined estimates of travel, the relative risk of different travel modes can also be calculated by considering the reported road crashes against the amount of travel. All injury crashes in New Zealand involving a vehicle are required to be reported to the Police (there is no similar law for property-damage only crashes), although in practice most ‘cycling-only’ crashes are not reported (this is discussed further in Section 3.4). These are recorded in CAS, the Crash Analysis System and can be easily interrogated by factors such as road environment and road user type and age.
Figure 2 shows the relative risk of death or injury for different transport modes per 100 million km travelled (100 MKT). Motorcycling is the “riskiest” travel mode with 540 deaths or injuries per 100 MKT, followed by cycling (245) and walking (120). Drivers of light four-wheeled vehicles (cars, vans, etc) have 27 deaths or injuries per 100 MKT while their passengers have a rate of only 18 and bus passengers only 3. From Figure 2, it can be seen that the overall risk of death or injury from cycling due to road crashes is around nine times greater than the risk of death or injury when driving from driving when the metric “km travelled” is used (MoT 2012b).
This simple comparison however ignores the relative amount of time taken by each mode to travel the same distance, and thus the relative exposure to danger. For example, typical uncongested driving speeds are generally between 50km/h (urban) and 100 km/h (rural), whereas typical cycling speeds are usually more like 20-30km/h (less for children, more for
provide a more valid assessment. How this relates to overall trip distances is discussed further in Section 3.1.
Figure 2: Deaths or injuries in motor vehicle crashes per 100 million km travelled per year, 2007-11 data (MoT 2012b)
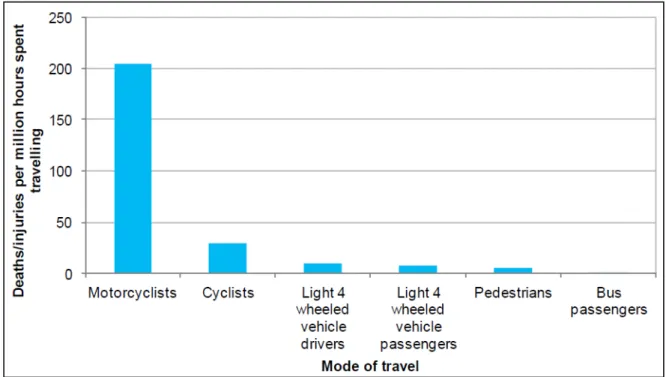
Figure 3 shows the relative risk of death or injury for different transport modes per million hours travelled (MHT). Motorcycling remains the riskiest travel mode by time with 205 deaths or injuries per MHT. While cycling is next worst (29), it is considerably better now in comparison to other modes such as light four-wheeled vehicle drivers (10) and their passengers (7). It is also notable how much better pedestrians fare in this comparison (5 deaths or injuries per MHT).
Figure 3: Deaths or injuries in motor vehicle crashes per million hours spent travelling, 2007-11 data (MoT 2012b)
From Figure 3, it can be seen that the risk of death or injury from cycling is now around three times greater than the risk for light four-wheeled vehicle drivers from driving when the metric “hours spent travelling” is used. It is likely that the relative risk will differ between rural and urban environments, due to the different speed differences in each case. Either way, clearly the use of a “per time” metric presents a more realistic and more generous assessment of the risk of cycling than a “per distance” metric.
3 ANALYSIS
From the initial analysis presented above, further investigation was undertaken using the raw data from the Household Travel Survey (2003-09) and CAS crash data over the same period. As well as the choice of metric identified above, a number of factors have been identified that may affect the relative risk determined.
3.1 Average Distance Travelled
A reasonable response to the above argument about using a “per time” metric is that someone cycling at a slower speed than a motor vehicle is likely to be exposed for a longer time on the road in order to reach the same destination. While that may be true if the same destination is assumed, there is reasonable evidence to suggest that often people cycling adjust their travel plans to take account of their more limited range and speed. This behaviour is also reflected in the concept of a fixed “travel time budget”, and it has been postulated that people switching modes may adjust their destinations to suit (O’Fallon & Wallis, 2012).
For example, an analysis of the 2003-09 Travel Survey data finds that the average trip length by occupants of light motor vehicles and public transport users is approximately
9-10km. By contrast, the average trip length for people cycling is only 3.4km (only in the 25-29 year age group is the average distance similar to drivers, being 8.7km).
This indicates that cyclists are typically choosing closer destinations to achieve their travel aims. For example, they may choose to frequent a local shopping centre when biking rather than travel to a larger shopping mall further away as they might do when driving; these would both be considered the same “type” of trip. The distance to other key destinations (e.g. work) may also influence whether they choose to bike or travel by another mode. In doing so they therefore self-minimise the level of exposure they face when riding their bicycle.
3.2 Age Distribution of Travellers
The age distributions and subsequent "road experience" of different types of traveller is likely to have an effect on the relative risk of a crash. It is no surprise for example that, given their limited physical and cognitive abilities, we do not allow children to operate potentially dangerous devices like motor vehicles. However they are still exposed to crash risk when travelling by other modes.
Figure 4 shows the distribution of kilometres travelled by light motor vehicle occupants and cyclists by age groups. Obviously, virtually no drivers feature below 15 years old due to the minimum licensing legislation (there is a very small amount of illegal under-age driving noted however). Largely because of the predominance of travel as children, it is seen that light vehicle passenger travel has the youngest average age of only 27 years. The average age for cycling is 33 years old, considerably less than the average age for driving at 44 years.
Road safety policy worldwide identifies the risks inherent in travel by children and young adults, due to their lack of experience and maturity. Figure 4 clearly shows that cyclists are more likely to be under 30 years old than drivers; conversely, drivers are over-represented in the “more mature” age groups. It is somewhat understandable therefore why the average driving crash risk is less than that for cycling, when effectively one might be comparing (say) a 40-year-old driver with a 12-year-old cyclist.
Figure 4: Age distribution of travel by modes (percentage of km-travelled by each mode)
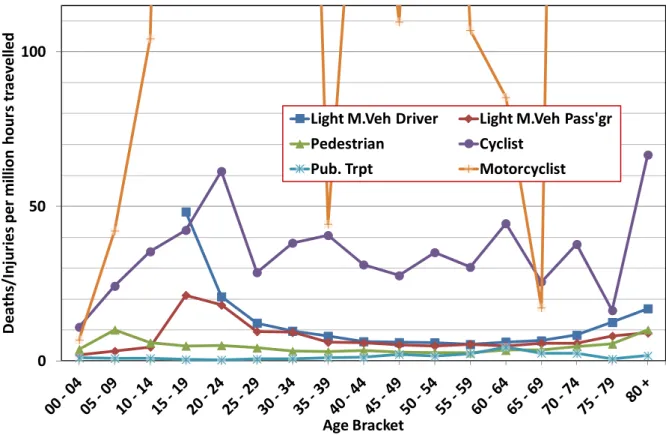
If we break down the travel and crash data by age group, it is possible to identify the relative risks for each age cohort. Figure 5 summarises the breakdown for each mode when the age of travellers is taken into consideration.
0% 2% 4% 6% 8% 10% 12% 14% 16% Age Group
Light Veh Driver (Ave. Age 44 yrs) Light Veh Pass'gr (Ave Age 27 Yrs) Cyclist (Ave Age 33 Yrs)
Figure 5: Death/injuries per million hours travelled by Age Bracket for each mode
It can be seen that the crash rate for cycling is actually slightly better than that for driving for the 15-19 year age bracket. The two crash rates are also very comparable for the 75-79 year age bracket, as the relative risk of driving starts to climb up.
3.3 Road Environment Travelled
The types of road environments or facilities where people are travelling vary considerably, from ordinary local streets to rural highways and motorways. It is no surprise therefore that different injury risks are faced in different road environments.
New Zealand’s travel and crash data identifies six main road categories for analysis: state highways (Government-managed arterial routes) comprise “motorways”, “urban highways” and “rural highways”, while “major urban roads”, “minor urban roads” and “other rural roads” are managed by local City/District Councils. Travel data on a km-travelled basis was available for each road category in terms of traveller mode and age.
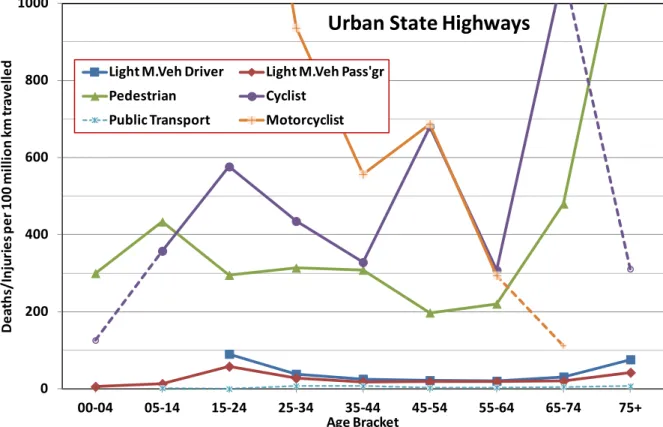
Figure 6 shows an example of the calculations for a specific road environment, “Urban state highways”. Note that some injury rates are shown with a dashed line to indicate that only a small sample of crashes (<10 over seven years) was available to calculate them; these figures should be used with some caution. Overall it is notable that the cycling crash rates (average ~430 deaths/injuries per 100 MKT) are about twelve times greater than the driving crash rates (average ~36 deaths/injuries per 100 MKT), i.e. worse than the national average ratio of nine. This perhaps reflects the much greater exposure to traffic on these roads.
0 50 100 Dea th s/ In ju ries p er m ill io n ho ur s t ra ev el led Age Bracket
Light M.Veh Driver Light M.Veh Pass'gr Pedestrian Cyclist
Figure 6: Urban state highways: Death/injuries per 100 million km by Age and Mode
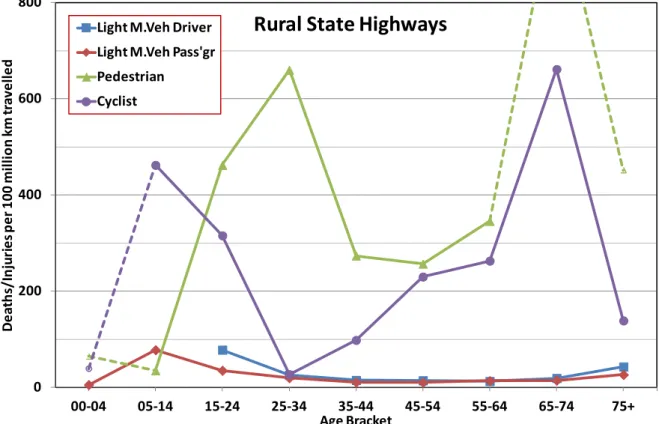
Similar analyses can be undertaken for other road environment types. Figure 7 shows the analysis for rural state highways (motorcyclist and public transport crash rates have been removed for clarity; many of these had very small crash samples anyway). Although some of the relative risks for the older cyclists are still considerably worse than drivers of the same age, overall the cycling crash rate (108 deaths/injuries per 100 MKT) is less than five times greater than the overall crash rate for light motor vehicle drivers (23). This perhaps reflects the reduced exposure to motor traffic, relative to urban areas. Given the relative speed differences of driving and cycling in rural areas (about 3:1-4:1), an approximate comparison of these modes on a “per hour” basis would suggest that the relative risk for cycling is less than twice that for driving (and for some of the younger age groups, considerably better).
0 200 400 600 800 1000 00-04 05-14 15-24 25-34 35-44 45-54 55-64 65-74 75+ De at hs /I nj uri es p er 1 00 m ill io n k m tr av el le d Age Bracket
Urban State Highways
Light M.Veh Driver Light M.Veh Pass'gr Pedestrian Cyclist
Figure 7: Rural state highways: Death/injuries per 100 million km by Age and Mode
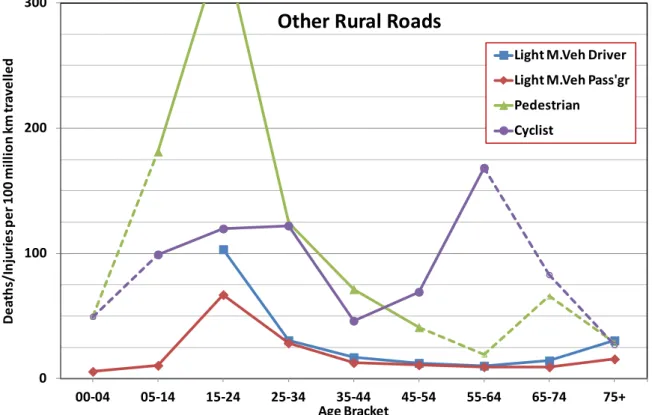
This trend is even more prevalent when considering other rural roads; see Figure 8. Now the overall relative risk of cycling deaths/injuries (81 per 100 MKT) is only three times that of driving (26). Given that these rural roads generally have much less traffic than rural state highways, this is clearly affecting the relative risk. When the relative speeds of each mode are taken into account, it is likely that the overall risk of deaths/injuries per hour are very similar.
Finally, if we consider minor urban roads (see Figure 9) there is also a slightly improved situation relative to the national average, with a cycling rate of 302 per 100 MKT being only seven times greater than the driving average of 41. It is notable however that both rates are worse than average, reflecting both the greater presence of other traffic and the lower design standards usually found on such roads. Although the lower speed environment may improve the chances of less severe crashes, this is clearly being outweighed by the much greater effect of traffic volumes. This illustrates quite nicely the relative benefits of providing more segregated cycling facilities (not commonly provided to date in New Zealand).
Looking at the crash risk for motorways, motorists there face a crash rate there only 30-50% that of other road environments (11.8 deaths/injuries per 100 MKT vs 23.2-41.3); this is not unexpected considering the high standard of design and limited access control. However a mode like cycling does not have access to motorways, generally having to mix with traffic and pedestrians in other road environments instead. Interestingly a small amount of cycling is coded as having occurred on motorways, which may refer to some of the pathways parallel to some motorways, and these environments only have a crash rate of 16.8 deaths/injuries per
0 200 400 600 800 00-04 05-14 15-24 25-34 35-44 45-54 55-64 65-74 75+ De at hs /I nj uri es p er 1 00 m ill io n k m tr av el le d Age Bracket
Rural State Highways
Light M.Veh Driver Light M.Veh Pass'gr Pedestrian Cyclist
intersections. Even if they did, it is not clear how they would be included in this analysis; generally off-road cycle crashes (i.e. not involving a motor vehicle) are not recorded in CAS.
Figure 8: Other rural roads: Death/injuries per 100 million km by Age and Mode 0 100 200 300 00-04 05-14 15-24 25-34 35-44 45-54 55-64 65-74 75+ De at hs /I nj uri es p er 1 00 m ill io n k m tr av el le d Age Bracket
Other Rural Roads
Light M.Veh Driver Light M.Veh Pass'gr Pedestrian Cyclist 0 100 200 300 400 500 00-04 05-14 15-24 25-34 35-44 45-54 55-64 65-74 75+ De at hs /I m ju rie s p er 1 00 m ill io n k m k t ra ve lle d Age Bracket
Minor Urban Roads
Light M.Veh Driver Light M.Veh Pass'gr Pedestrian Cyclist
3.4 Crash Reporting Rates
Another issue not considered here but relevant from the perspective of individual travellers is the different crash reporting rates by mode. Langley et al (2003) noted for example that only about half of all cycle injury crashes involving a motor vehicle were recorded in the national crash database, and very few not involving a motor vehicle (but still on public roads) were captured. The latter is not surprising given that only injury crashes involving a motor vehicle were legally required to be reported before ~2001 and few people are aware of the technical requirement to also report ‘cycle-only’ injury crashes since then. Munster et al (2001) estimated from New Zealand hospital data that four times as many cyclists are injured from cycle-only crashes on the carriageway or on pathways than those involved in motor vehicle collisions (note that this does not include off-road mountain-biking track accidents).
The different age distributions of various travel modes are likely to have an influence on the overall reporting rate. Age affects both the propensity for reporting and the relative fragility of road users (i.e. their susceptibility to more serious injuries and death). Alsop & Langley (2001) found for example that “severe” injuries were about 35% more likely to be reported than “minor” injuries, and that under 20-year olds (especially under-15s) were less likely to report crashes. Given that the age distribution for cycling is younger than for driving (and includes children under 15), it is likely that these factors will result in lower reporting rates for cycling crashes.
From the above discussion, the net effect of taking crash reporting rates into account is probably not to the advantage of cycling. Nevertheless it is important to appreciate the limitations of using reported crash data for analyses like this.
3.5 “Safety in Numbers”
If cycling is seen to have a higher crash rate than other travel modes, there may be concerns about encouraging more cycling, with a resulting increase in personal risk. However much has been written about the "safety in numbers" effect, whereby more people cycling actually helps to reduce the individual risk of each person cycling; similar effects have been proposed for walking too. Jacobsen (2003) summarised this effect, using a series of North American and European examples comparing different towns or countries to demonstrate its reliability, and suggested that motorists adjust their behaviour in the presence of greater numbers of pedestrians or cyclists.
In New Zealand, Turner et al (2006) also noted such an effect when developing crash prediction models for walking and cycling; they demonstrated that a 300% increase in cycling numbers would more than halve the corresponding crash rates. It seems misguided therefore to worry about more people choosing to use a “less safe” travel mode like cycling, when in fact the very act of more people cycling is likely to improve the crash rate for everyone.
An attempt was made to try to demonstrate a safety in numbers effect by comparing the different road environments. It was hypothesised that similar road environments with relatively more cycling would have lower crash rates. Although vehicle-km data was available for the whole country, no equivalent data was available about the total length of road in each road environment category, so as to determine typical traffic flow rates. Therefore, ratios of the total cycling-km and driving-km were calculated instead, to reflect the relative likelihood that a motorist would encounter a cyclist. Figure 10 shows the relationship between these ratios and cycling crash rates for each of the six road environments.
Ignoring the result for motorways (previously discussed), it can be seen that there is a clear split in crash rates between high-speed (rural) and low-speed (urban) road environments, presumably governed by the relative differences in rural/urban traffic volumes. Within these two groups, a shift to the quieter roads where cycling is relatively more prominent does result in somewhat lower crash rates for cycling (interestingly the opposite of what is found in the crash rates for drivers). It should be noted too that the effect of cycling facilities on these results is likely to be negligible; there are still relatively few such facilities on New Zealand roads and most of them actually tend to be on the busier state highways and major urban roads anyway. While further data to help quantify average motor vehicle flows would be useful, the findings do suggest that a “safety in numbers” effect may be present. However, further work is probably needed to control for other possible road and traffic attributes.
Figure 10: Effect of prevalence of cycling on crash rates
3.6 Health Effects of Travel Modes
The above discussion has all focused on the relative risk of death and injury from road crashes. If one wishes to get a more complete picture of personal risk however, then other health effects other than road crashes need to be considered too, e.g. due to physical inactivity and motor vehicle emissions. By way of context, typically an average of ten people die each year in New Zealand from cycling crashes; meanwhile about 300-500 premature deaths each year are estimated due to motor vehicle emissions, and about 2500 deaths/year due to symptoms related to physical inactivity (obesity, diabetes, cardiovascular, etc).
Lindsay et al (2011) estimated the effects on health if more short trips were undertaken by
Urban State Hwy
Motorway
Rural State Hwy
Other Rural Road
Major Urban Road
Minor Urban Road
0 100 200 300 400 500 600 700 0.0% 0.5% 1.0% 1.5% 2.0% 2.5% De at hs /I nj uri es p er 1 00 m ill io n k m tr av el le d
crashes, but would also avoid about 116 deaths annually as a result of increased physical activity, and lead to six fewer deaths due to local air pollution from vehicle emissions.
4 DISCUSSION AND CONCLUSIONS
This paper has identified why assessments of cycling crash risk relative to other modes may be quite unfair, from the point of view of not "comparing apples with apples". Simple comparisons of overall data ignore a number of factors, including:
• The relative amount of time taken by each mode to travel the same distance, and thus the relative exposure to danger.
• The average distance travelled by users of different modes for the same kinds of trips. • The age distributions and "road experience" of different types of traveller.
• The types of road environments or facilities where people are travelling, including streets, paths, motorways, etc.
• Different crash reporting rates by mode.
• The cumulative "safety in numbers" effect, whereby more people cycling actually helps to reduce the individual risk of each person.
• Relative health costs other than road crashes, e.g. due to physical inactivity and motor vehicle emissions.
This results in quite different (and in many cases much more favourable) conclusions about the relative safety of cycling. For example, per hour travelled, cycling had a similar crash rate for 15-19 year olds and over 75’s when compared to driving a light motor vehicle, even before health considerations were accounted for. There were notable differences in the relative risk of modes when comparing urban vs rural roads and major vs minor roads. In similar-speed environments, a “safety in numbers” effect was also observed for cycling. The results also suggest that people cycling would strongly benefit by protection from traffic in busy road environments, e.g. segregated facilities.
The results have implications for how crash risk data should be presented and used by public agencies. Simple overall statistics are likely to be very misleading about the personal risk of someone choosing to change travel modes, whilst neglecting their age or the environment in which they will cycle. Concerns about the relative “danger” of cycling also ignore the significant health gains obtained as well and the positive impact of the “safety in numbers” effect.
ACKNOWLEDGMENTS
The authors would like to acknowledge the assistance of the NZ Ministry of Transport, especially Lynley Povey, in providing the Travel Survey data necessary for this analysis.
REFERENCES
Alsop J., Langley J. (2001). Under-reporting of motor vehicle traffic crash victims in New Zealand. Accident Analysis & Prevention, Vol.33, pp.353–359.
Cairney P. (2010). The Road Safety Consequences of Changing Travel Modes. Austroads
Publication No. AP–R361/10, Austroads, Sydney, Australia.
Jacobsen, P. (2003). Safety in Numbers: more walkers and bicyclists, safer walking and bicycling. Injury Prevention, Vol.9, No.5, pp.205-209.
Langley J., Dow N., Stephenson S., Kypri K. (2003). Missing cyclists. Injury Prevention, Vol.9, pp.376-379.
Lindsay G, Macmillan A, Woodward A. (2011). Moving urban trips from cars to bicycles: impact on health and emissions. Australian & New Zealand Journal of Public Health. Vol. 35(1), pp.54-60.
MoT. (2012a). New Zealand Household Travel Survey 2008–2011: Comparing Travel Modes. March 2012, New Zealand Ministry of Transport, Wellington, NZ.
MoT. (2012b). Risk on the Road: Introduction and mode comparison. New Zealand Ministry of Transport, Wellington, NZ.
Munster, D., Koorey, G., Walton, D. (2001) Role of road features in cycle-only crashes in New Zealand. Transfund NZ Research Report No. 211. Wellington, NZ.
O’Fallon C., Wallis I. (2012) A wider look at how travellers value the quality and quantity of travel time. NZ Transport Agency research report 469. Wellington, NZ. 128pp.
Stipdonk H, Reurings M. (2012). The effect on road safety of a modal shift from car to bicycle. Traffic Injury Prevention, 13(4), pp.412-21.
Turner, S., Roozenburg, A., Francis, T. (2006), Predicting accident rates for cyclists and pedestrians, LTNZ Research Report 289, Land Transport New Zealand, Wellington, NZ.