J
Ö N K Ö P I N GI
N T E R N A T I O N A LB
U S I N E S SS
C H O O L JÖNKÖPING UNIVERSITYH o w i n d u s t r y c h a n g e h a s a f
-f e c t e d E u r o p e a n a i r l i n e s
D e v e l o p m e n t o f p r o f i t a b i l i t y a n d c a p i t a l s t r u c t u r e y e a r 2 0 0 0 - 2 0 0 8Bachelor thesis within Business Administration
Author: HELANDER, ANNA
HOURANI, RAYAN
Tutor: ÖSTERLUND, URBAN
Acknowledgements
We deeply would like to thank our tutor Urban Österlund for excellent guidance, sugges-tion and encouragement during the time of writing our thesis. Without his great advice, this thesis would have been difficult to complete.
We would also like to thank Jan-Olof Müller for his great encouragement, when times were hard.
A big thank you for constructive critique and helpful advice to our opponents and fellow students during the seminars throughout the semester.
Last but not least, a big thank you to the interviewees Helen Jakobsson and Anders Lid-man, for sparing a moment to answer our interview questions.
... ……….. Anna Helander Rayan Hourani
Title: How industry change has affected European airlines –
Development of profitability and capital structure year 2000 - 2008
Authors: Helander, A. & Hourani, R.
Tutor: Österlund, U.
Date: January, 2009
Subject terms: airline industry, industry change, corporate analysis, ratio analysis,
traditional airlines, LCC
Abstract
Background: The airline industry of today functions in a very intense and competitive
market and is also very sensitive to change. Over the last years the airline industry has changed and been affected drastically. Factors like sudden shocks, such as the terrorist at-tacks of September 11th in 2001 and the SARS (Severe Acute Respiratory Syndrome) phe-nomenon in China 2003, change in macroeconomic factors, such as GDP growth in differ-ent regions, changes in the oil price and fluctuations in exchange rates, and also by the fact that the airline industry have experienced a general change in structure and trends. A con-sequence of these shocks and general industry changes, also made worse by the ongoing fi-nancial crisis and escalation of fuel price many airlines have lost a significant part of their market value. The fact that during a normal year around eight airlines in the world go bank-rupted but that Sterling became the 31st in 2008 strengthens this statement.
Problem: All these incidents the airline industry has been exposed to, combined with the
overall industry change in structure and trends, have given the European airline industry the shape that it has today, and the change is not over. This emphasizes the importance and interest to map out the airline industry of today with the most recent and major events in consideration and also the curiosity for the fact that differences in how the different airlines have been affected should exist.
Purpose: The purpose of this thesis is to investigate how industry change has affected the
profitability and capital structure of European airlines, individually and in comparison with each other.
Method: Six actors in the airline industry were selected for a descriptive type of study that
takes a deductive approach. Secondary numerical data from the airlines‟ annual reports was used and analyzed and conclusions were drawn based on existing theories. Quantitative calculations for different financial ratios were made. To get analysts‟ viewpoints and more depth and detailed description of the topic, a qualitative approach was used in the form of interviews. For a more structured analysis and to easier evaluate the development of the fi-nancial situation of the airlines an observational scheme was developed.
Conclusions: For the three financial aspects studied, significant patterns were observed
that could be explained by the shocks and trends that have changed the European airline industry. The strongest empirical findings indicating affects of this kind was for the levels of profitability, both for traditional airlines and Low Cost Carriers. The shocks of Septem-ber 11th and SARS, with their respective consequences and aftermaths, were reflected in the findings and also the effects of the general industry trend of an increase in competition.
Definitions and abbreviations
AEA – The Association of European Airlines, made up by 35 major airlines, and has
repre-sented the European airline industry for more than 50 years. Based on broad knowledge of the industry and extensive networks, AEA is an important platform for industry. AEA is relied upon by policy-makers and the media as a reliable contributor to debates and the or-ganization works in partnership with the institutions of the European Union and other stakeholders in the value chain, to ensure the sustainable growth of the European airline industry in a global context (AEA: About us, 2008). All airlines in this thesis but LCCs Ry-anair and EasyJet are members of AEA.
Airline industry – in this thesis used interchangeably with aviation industry and air
trans-port industry. All refer to the commercial transtrans-portation by air performed by scheduled and chartered airlines. However, the focus of this study is on scheduled airlines.
ASK – Available Seat Kilometers (see section 2.4.2.1). BA – British Airways (see section 4.1.1).
IATA - International Air Transport Association, an international trade body, created in
1945 by a group of 57 airlines. Today, IATA represents some 230 airlines (78 in the Euro-pean region), in 126 different countries, comprising 93% of scheduled international air traf-fic. The organization also represents, leads and serves the airline industry in general (IATA: About us, 2008). All airlines in this thesis, except LCCs Ryanair and EasyJet, are members of IATA.
ICAO – International Civil Aviation Organizations, a specialized agency of the UN
(United Nations) which has at present a membership of 190 states. These are required to report certain statistics to ICAO as specified by the ICAO Council. The major parts of the statistics are submitted on established forms annually or at other fixed reporting periods (ICAO: About ICAO, 2008). All states relevant in this thesis are member states of ICAO.
Industry change: industry change, in this thesis, refers to the change in the airlines‟
exter-nal environment caused by: alterations in general industry trends such as level of competi-tion and customer preferences; changes in macroeconomic factors such as GDP growth and fluctuations in exchange rates; and sudden shocks such as the terrorist attacks of Sep-tember 11th in 2001 and the SARS phenomenon.
LCC – Low Cost Carrier (also known as low fare airline, no-frills airline, etc.). This is a
relatively new type of airline, introduced to the European market by Ryanair in 1991. The strategy of a LCC differs from a traditional airline in several ways, but mainly in that the level of service is lower, offered fares are lower, usually it uses secondary airports, it flies point-to-point and operate one single type of aircraft (Luftfartsstyrelsen: Flygtendenser 02/2008, 2008). LCCs included under study in this thesis are, Ryanair and EasyJet
PLF – Passenger Load Factor (see section 2.4.2.5).
RPK – Revenue Passenger Kilometer (see section 2.4.2.3).
Traditional airline – all other scheduled airlines not applying a typical LCC strategy (see
LCC above). Also referred to as network airlines and full-service airlines (AEA: Yearbook 2004).
Table of Contents
Acknowledgements ... i
Abstract ... ii
Definitions and abbreviations ... iii
Table of Contents ... iv
1
Introduction ... 1
1.1 Background ... 1
1.2 Problem and research questions ... 2
1.3 Purpose ... 3
1.4 Selections and delimitations ... 3
1.5 Perspective ... 4
2
Frame of reference ... 5
2.1 Industry overview... 5
2.1.1 Deregulation of the European airline industry ... 5
2.1.2 Important events and changes in relevant macroeconomic factors 2000 – 2008 ... 6
2.1.3 LCC vs. traditional airlines ... 11
2.2 Industry change and Porter’s Five Forces ... 12
2.2.1 Rivalry Among Existing Competitors ... 13
2.2.2 Threat of new entrants ... 13
2.2.2.1 Rivalry Among Existing Competitors and Threat of new entrants applied to the airline industry ... 13
2.2.3 Bargaining Power of Suppliers ... 14
2.2.3.1 Bargaining Power of Suppliers applied to the airline industry ... 14
2.2.4 Bargaining Power of Buyers ... 15
2.2.4.1 Bargaining Power of Buyers applied to the airline industry ... 15
2.2.5 Threat of Substitute Products or Services ... 18
2.2.5.1 Threat of Substitute Products or Services applied to the airline industry ... 18
2.3 Ratio analysis ... 18
2.3.1 Different purposes of ratio analysis ... 19
2.4 The ratios chosen for this thesis ... 19
2.4.1 Traditional financial ratios ... 19
2.4.1.1 Liquidity ... 20 2.4.1.1.1 Current ratio ... 20 2.4.1.1.2 Quick ratio ... 20 2.4.1.2 Indebtedness ... 20 2.4.1.2.1 Debt-equity ratio ... 21 2.4.1.3 Profitability ... 21 2.4.1.3.1 Profit margin ... 21
2.4.1.3.2 Return on equity (ROE) ... 21
2.4.2 Industry specific ratios ... 21
2.4.2.1 Available seat kilometers (ASK) ... 22
2.4.2.2 Revenue passenger kilometers (RPK) ... 22
2.4.2.3 Passenger Load Factor (PLF) ... 22
3
Method ... 23
3.3 Qualitative and quantitative approach ... 24
3.4 Primary and secondary data ... 24
3.5 Data collection and literature search ... 24
3.6 Model for observation ... 25
3.7 Interview ... 27
3.8 Reliability and validity ... 27
3.9 Comparability ... 28
3.10 Methodological problems ... 28
3.11 Source criticism ... 29
4
Empirical findings and analysis ... 30
4.1 The airlines ... 30 4.1.1 British Airways ... 31 4.1.2 Finnair ... 35 4.1.3 Iberia ... 39 4.1.4 Lufthansa ... 43 4.1.5 EasyJet ... 47 4.1.6 Ryanair ... 50
4.2 Comparative analysis of the different airlines ... 53
4.3 Analysts’ viewpoints on the current crisis and the future outlook for the industry ... 64
4.3.1 Chris Tarry – Aviation Industry Research and Analysis (CTAIRA) 64 4.3.2 Anders Lidman ... 65
4.3.3 Helen Jakobsson ... 66
4.3.4 Comparative analysis of the analysts’ viewpoints ... 66
5
Conclusion ... 68
5.1 Critique ... 69
5.2 Further research ... 69
References ... 71
Appendix 1 – Development of US Dollar against Euro ... 1
Appendix 2 – Cost structure, traditional airlines ... 1
Appendix 3 – Cost structure, LCCs ... 2
Appendix 4 – Interview questions ... 3
Appendix 5 - Chris Tarry, Aviation Industry Research and
Analysis (CTAIRA) ... 4
Appendix 6 - Helen Jakobsson, the Swedish Civil
Aviation Authority (Luftfartsstyrelsen) ... 5
Appendix 7 - Anders Lidman, Aeropol ... 6
Appendix 8 – ASK ... 7
Appendix 9 – Quick ratio ... 8
Appendix 11 - Calculations of financial ratios ... 10
Figure 1. Porter's Five Forces (Porter, 2008). ... 12
Figure 2. Crude oil and jet fuel price development and fuel cost share of total cost for an average airline (AEA: Industry outlook presentation, 2008).15 Figure 3. GDP growth for different regions of the world (AEA: AEA meeting with AEA meeting with Czech government, policy makers and industry in Prague, 2008). ... 16
Figure 4. The development of AEA member airlines’ RPK (Revenue Passenger Kilometers), and how industry crises have affected it, from 1980 until May 2008, and a forecast made by AEA for the rest of 2008 (AEA: State of the industry, 2008). ... 17
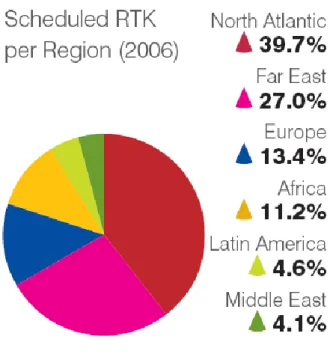
Figure 5. *RTK – Revenue Tonnes Kilometers (both passengers and cargo included) (AEA: Yearbook 2007) ... 31
Figure 6. *RTK – Revenue Tonnes Kilometers (both passengers and cargo included) (AEA: Yearbook 2007) ... 35
Figure 7. *RTK – Revenue Tonnes Kilometers (both passengers and cargo included) (AEA: Yearbook 2007) ... 39
Figure 8. *RTK – Revenue Tonnes Kilometers (both passengers and cargo included) (AEA: Yearbook 2007) ... 43
Figure 9. Development of RPK (% change) - traditional airlines (data for Finnair was not presented in their 2001 annual report and is therefore missing)53 Figure 10. Development of RPK (% change) - LCC ... 54
Figure 11. Development of PLF (% change) – traditional airlines (data for Finnair was not presented in their 2001 annual report and is therefore missing). ... 55
Figure 12. Development of PLF (% change) – LCC ... 56
Figure 13. Development of total cost/RPK (% change) – traditional airlines (RPK for Finnair was not presented in their 2001 annual report and is therefore missing) ... 56
Figure 14. Development of total cost/RPK (% change) – LCC ... 57
Figure 15. Development of current ratio (% change) – traditional airlines ... 58
Figure 16. Development of current ratio (% change) – LCC ... 59
Figure 17. Development of debt-equity ratio (% change) – traditional airlines .. 60
Figure 18. Development of debt-equity ratio (% change) – LCC ... 61
Figure 19. Development of profit margin – traditional airlines ... 62
Figure 20. Development of profit margin – LCC ... 63
Table 1. Scheduled services by region of airline registration in 2007 (ICAO Contracting states) (ICAO, 2008). ... 6
Table 2. Differences between LCCs and traditional airlines (O’Connell & Williams, 2005) ... 11
Table 3. Annual average growth rates (%) of traffic volumes (tkp) and capacity (atk – available tonnes kilometers) globally and for specific geographical regions (IATA: Financial Forecast, 2008). ... 14
Table 4. Growth of scheduled RPK (AEA: Yearbook 2007 & 2000). ... 15
Table 7. British Airways financial ratios ... 34
Table 8. Finnair industry specific ratios ... 36
Table 9. Finnair cost structure (* - in million € ) ... 37
Table 10. Finnair financial ratios ... 37
Table 11. Iberia industry specific ratios ... 40
Table 12. Iberia cost structure (* - in million € ) ... 41
Table 13. Iberia financial ratios ... 42
Table 14. Lufthansa industry specific ratios ... 44
Table 15. Lufthansa cost structure (* - in million € ) ... 45
Table 16. Lufthansa financial ratios ... 46
Table 17. EasyJet industry specific ratios ... 47
Table 18. EasyJet cost structure (* - in million £. ** - in 2008 no information on specified employee cost was available, therefore it is assumed this cost is included in the ‘other cost’ column). ... 48
Table 19. EasyJet financial ratios ... 49
Table 20. Ryanair industry specific ratios ... 50
Table 21. Ryanair cost structure (* - in million € )... 51
1
Introduction
This chapter will introduce the thesis by presenting the background and the problem of the chosen topic. Relevant research questions will be stated and also the purpose of the thesis. A presentation of the selections and delimitations made and what perspective that was taken will also be presented in this chapter.
1.1 Background
"We are in the worst trading environment the industry has ever seen", said Mr. Walsh [CEO, British Airways]. "We have already seen 30 or so airlines go bust this year and it would be fair to expect a similar number of casualties worldwide over the next three to four months." (Hickman & Prosser, 2008).
The invention of the airplane is one of few inventions that have changed how people live and experience the world. The techniques for the planes‟ design and construction were immensely improved due to government subsidies and demands for new airplanes during the World Wars (Investopedia, 2008).
The first commercial airplane routes were established in Europe after World War II. Air travel is today so common that a life without it is hard to imagine. It is not only the airline industry that has evolved but also the way people live and do business (Investopedia, 2008). Today the airline industry operates in a very intense and competitive market. In earlier days the airline industry was partially government owned, but since the deregulation of the mar-kets (in the 1970s in the US and starting in the late 1980s in Europe) the industry has be-come more privately held (Investopedia, 2008).
In the beginning of 1990s the concept of LCC (Low Cost Carrier) was introduced in Europe. The numbers of LCCs have increased massively during the last 10-15 years and 2007 was a record years for the LCCs, with over half a billion passengers in total. The LCCs represent more than 20 % of the world market and almost 40 % on the European market (Luftfartsstyrelsen: Flygtendenser 02/2008, 2008).
During a normal year around eight airlines in the world go bankrupted, but Sterling became the 31st that went bankrupted during 2008 (Bergfelt, 2008). A combination of the high fuel price, which peaked in July 2008, and the current recession that is affecting the world today are two of the main reasons for the crisis in the airline industry. The crisis has greatly af-fected the industry and forced many airlines to major cut-backs in airplanes, workforces and routes. Some airlines have had to reorganize and some have, as mentioned, gone bank-rupted. The situation today has been said to be the worst crisis in the history of the airline industry (Östlund, 2008).
The European airline industry has changed and been affected drastically over the last years. This industry change is not only a consequence of factors such as sudden shocks, as the terrorist attacks of September 11th in 2001 and the SARS (Severe Acute Respiratory Syn-drome) phenomenon in China 2003, but also by changes in macroeconomic factors, such as GDP growth in different regions, oil price and fluctuation in exchange rates, and by the fact that the airline industry have experienced a general change in structure and trends.
A result of the industry change, and also made worse by the ongoing financial crisis, many airlines have lost a significant part of their market value. Most likely, at least a part of these companies will manage to adjust to the structural changes of the industry and see their market value once again increase (IATA: Airlines Financial Health Monitor, 2008).
1.2 Problem and research questions
As discussed in the background the airline industry has been exposed to many events dur-ing the last years such as the terrorist attacks of September 11th, SARS, and the most recent event of a sharp rise in the price of crude oil that caused the escalation of fuel price. All these shocks, combined with the overall change in industry structure and trends and changes in macroeconomic factors, have given the European airline industry the shape that it has today.
This emphasizes the importance and interest to map out the airline industry of today with the most recent and major events in consideration.
Differences in how the European airlines have been affected should exist. It is therefore in-teresting to investigate how different European airlines have been affected by the recent years industry change and how this differs between the airlines. An event such as a rapid increase in fuel price is something that demands fast acting from a company‟s side. How-ever preparation and acting before this can vary between the companies, which, in turn, should be expected to appear in actual levels of profitability and capital structure.
Since LCCs‟ and traditional airlines‟ strategies are very different (see section 2.2.2), one would assume that also their capital structure and pattern of profitability differs. Therefore it is interesting to take into consideration the differences between the LCCs and the tradi-tional airlines in the context of how industry change has affected European airlines.
Thus, the previous discussion leads to the following research questions:
- How has the level of profitability, liquidity and indebtedness of the different airlines developed 2000-2008, and how does this reflect the industry change?
- Can a pattern of change in ratio levels be observed within the individual airline
looking at data for 2000-2008?
- Can a pattern of change in ratio levels be observed between the different airlines
looking at data for 2000-2008?
- What do analysts say about today‟s crisis and what do they predict for the near fu-ture?
1.3 Purpose
The purpose of this thesis is to investigate how industry change has affected the profitabil-ity and capital structure of European airlines, individually and in comparison with each other.
1.4 Selections and delimitations
Due to finite data access for other geographical areas, this thesis was focused on the Euro-pean airline industry. Still, EuroEuro-pean carriers covered the largest market share of interna-tional traffic in 2007. If including domestic traffic, the European was second after the North American carriers (ICAO, 2008). Thus, the European airline industry was for this study considered to be of more than significant size and interest to investigate. Today the European airline industry consists of about 500 airlines (Luftfartsstyrelsen: Flygtendenser 02/2008, 2008). However, the number of comparable airlines with annual report data avail-able to the public was not sufficient for conducting a statistically reliavail-able study. For this reason, six actors in the industry were selected for a descriptive type of study. This thesis focuses on the study of six of the major European airlines. The larger corporations
gener-ally equal larger market shares which in turn meant a result more representative of the mar-ket as a whole. Furthermore, the small actors often have a more niched strategy, making it harder to compare them to others. Another advantage with the large airlines was easily available information. Selection was primarily based on size, with the aim of achieving a geographical spread within the European industry, and also based on the comparability be-tween the airlines. Today the airline industry can roughly be divided into three types of air-lines; LCCs, traditional airlines and charter carriers. The last type almost exclusively devotes their operations to chartered traffic, i.e. not scheduled traffic.
Four of the chosen actors for this study were so called traditional airlines (see Definitions and abbreviations). These were chosen since they constitute four of the industry‟s largest, and thus most important, traditional airlines, in terms of both turnover and RPK flown. The other two chosen actors were the largest actors of the LCC segment of the industry (AEA: Yearbook 2007), a segment of increasing importance (see section 2.2.2). The chosen airlines were;
Airlines Type of airline Headquarters based
- British Airways traditional UK
- Finnair traditional Finland
- Iberia traditional Spain
- Lufthansa traditional Germany
- Easy Jet LCC UK
- Ryanair LCC Ireland
An observational scheme was developed and used for analyzing the chosen airlines (see section 3.6). This scheme covers, in a structured way, financial aspects, industry specific as-pects and the development of financial ratios.
All numerical data used in the analysis were based on the firms‟ annual reports from fiscal year 2000 to 2007/08 and interim reports from the two last years of the same period. The thesis focused mainly on passenger traffic, both business- and leisure travelling. How-ever, one should also be aware of the use of air transportation as a mean of transporting cargo and mail, which different airlines devote different amount of their activities to. This was taken into consideration when analyzing the chosen airlines.
1.5 Perspective
The perspective of this thesis, since using only publicly available information, was taken from an external party‟s point of view. Furthermore the thesis, although discussing events that occurred all over the world that were of importance for the entire airline industry,
2
Frame of reference
This chapter starts by giving an industry overview followed by a discussion of the i n-dustry change and Porter’s five forces. Ratio analysis in general and the chosen ratios for this thesis will also be presented. This frame of reference was used to delimitate the study and to later analyze the empirical findings.
2.1 Industry overview
To not overwhelm the reader with historical information about the airline industry, this in-dustry introduction will be brief and focus, as the thesis, on the European inin-dustry.
2.1.1 Deregulation of the European airline industry
Extensive government intervention and control characterized the air transport industry in Europe before the mid 1980s. The state was in possession of all of the major airlines in Europe and national regulatory authorities had the responsibility to assess suggested changes in fares and to supervise capacity and entry. They also had the task to consider the financial health of existing or prospective airlines. Pricing and capacity set by bilateral agreements between the involved governments determined the nature of air services be-tween countries in Europe. The typical trends were dominance of routes by state-owned flag carriers and revenue sharing. To understand this regime one must know that it re-flected the worldwide long-established perception that traffic rights were valuable national assets. These could be traded for equal traffic rights or even other rights. The perception was embowered in the 1944 Chicago Convention, which recognised each state‟s exclusive sovereignty over its airspace. Under the Treaty of Rome, signed in 1957 by the members of the European Union, air transport between the member states was given special treatment since it was specifically excluded from the general provisions of transport policy. Until 1986 there was even uncertainty about whether the Treaty‟s competition provisions applied to the industry (Johnson, 2003).
The regulatory environment in Europe today is nothing like that of the mid 1980s. The de-velopment towards a deregulated industry was initiated as a number of countries adopted a more liberal approach to their own domestic air transport system, e.g. in the UK in 1982 when the government started to permit competition on the important Anglo-Scottish routes out of Heathrow. To achieve a more relaxed regulatory framework some of the agreements between EU countries were also altered. Those between the UK and the Neth-erlands, Germany, Belgium, Luxembourg and Italy were all liberalized between 1985 and 1988. Starting in 1987, EU-level air transport policy was implemented in three stages and reached completion in 1997. Although the regime in Europe is now very alike that in the US, the approach on how to get there was much more evolutionary in contrasts with the concentrated change that occurred at the end of the 1970s in the US. There are now basi-cally no restrictions on entry, fares or frequencies on intra-EU routes. However, bilateral agreements still characterize air transport between EU and non-EU destinations. Concur-rent with these developments, there has been a complete or partial privatization of a num-ber of state-owned airlines in Europe. However, the public ownership element is still sub-stantial in many European airlines (Johnson, 2003).
Table 1. Scheduled services by region of airline registration in 2007 (ICAO Contracting states) (ICAO, 2008).
International Passenger-kms
performed (% of total) Total Passenger-kms per-formed (% of total)
Europe 40,20% 27,60%
North America 17,20% 33,80%
Asia and Pacific 27,30% 26,80%
Africa, Latin America &
Caribbean, Middle East 15,30% 11,80%
Total 100% 100%
Some idea of the relative overall scale of the European scheduled air transport industry 2007 may be obtained from Table 1. Europe was one of the three largest regions, in terms of scheduled passenger kilometers by region of airline registration. European registered air-lines are superior when not considering domestic passenger kilometers. In the information in the table clearly reflect the significant size of the domestic markets in North America; for total passenger kilometers North America is the largest region but when only account-ing for international passenger kilometers the region is significantly smaller than that of Europe and Asia and Pacific (ICAO, 2008).
2.1.2 Important events and changes in relevant macroeconomic factors 2000 – 2008
The information in this section mostly applies to the traditional airlines. However, the changes in macroeconomic factors such as the price of crude oil and global economic growth most likely affected the LCCs as well.
2000:
2000 was a year in which demand was strong but still many of the AEA member airlines struggled to break-even.
This was largely due to the fact that the US Dollar exchange rate, relative to the Euro and other European currencies, appreciated significantly in parallel with an increase in fuel price (see Appendix 1). Since airlines normally purchase their fuel in US Dollars, the appreciation worsened the impact of increased fuel prices (AEA: Yearbook 2001).
2001:
Already through the summer of 2001 the industry was in a bad state especially in the North Atlantic market.However, after the tragic events of September 11th, the final quarter was a financial disaster and the industry as a whole experienced its worst loss ever. The airline in-dustry was hit from several sides by the terrorist attacks and suffered substantial damage (AEA: Yearbook 2002).
A dramatic drop in demand followed and in the last four months of 2001 massive traffic losses were recorded. The immediate effect on traffic was comparable to the aftermath of the Gulf War in 1991 but the following depression was much more drawn out this time (AEA: Yearbook 2002).
The North Atlantic market experienced the largest loss in traffic, with significant decreases continuing through 2002. But all areas in which AEA carriers operate, except the Mid At-lantic route group, suffered major decreases in traffic following the terrorist attacks. The traffic trend for Far Eastern routes, which had been weak already earlier in the year, dropped significantly as well. In the last four months of the year, intra-European traffic of the AEA carriers decreased by 11.6% compared to the same period of 2000 (AEA: Year-book 2002).
A number of airlines had to stop their operations and surviving airlines made major capac-ity cuts, which in all meant that many thousands of jobs was lost also in the industries that serve the airlines (AEA: Yearbook 2002).
As one would have thought, security was also massively increased after what happened. The enhancements included both, for the customers, „visible‟ security enhancement at air-ports, e.g. through much stricter and more time-consuming checks and inspections, as well as other developments less observable. All of the AEA fleet‟s aircraft was equipped with armoured cockpit doors and most airlines implemented intensive programmes of staff screening, security awareness training, and better surveillance of sensitive areas (AEA: Yearbook 2004). As an immediate result of the September 11th attacks, the airlines dra-matically changed the way they insured themselves. They were expected to cover this new risk, while at the same time regular premiums increased substantially (AEA: Yearbook 2002).
2002:
The global economic slowdown of 2001 continued in 2002. The previous year‟s downturn in the US economy was followed in 2002 by a partial recovery (AEA: Yearbook 2003). In Europe, the drop in 2001 was not as bad, but it worsened in 2002. Japan, which was the European airlines‟ second-largest overseas market, underperformed both the EU and the US with almost no growth in 2002, as in 2001 (AEA: Yearbook 2003).
The global economic situation had affected consumer wealth and confidence, which in turn affected traffic volumes. The economic crisis in Argentina was probably the largest reason for why AEA carriers showed a significant negative result for the South Atlantic route group (AEA: Yearbook 2003).
2003:
The airline industry was hit with two exceptional traffic suppressing events in 2003 – the Iraq War and the SARS outbreak (AEA: Yearbook 2004).
Already in the start of the year demand had decreased in anticipation of the Iraq War. The Iraq War, which began in the end of March, had an immediate effect on AEA traffic levels which decreased with 15 % in Europe, 10 % on the North Atlantic routes and somewhere in between on the Far Eastern. Many routes to the Middle East where suspended (AEA: Yearbook 2004).
The European market recovered to growth almost as fast as the North Atlantic. The re-covery from the drop due to the war itself was stalled by the substantial impact of the SARS phenomenon, which in particular degraded the load factors on Eastern routes for AEA carriers (AEA: Yearbook 2004).
Sustained powerful increases in the Chinese economy, pushing the passenger market into a position where it challenges Japan in importance for AEA airlines, came to an abrupt end in 2003 with the devastating impact of SARS (AEA: Yearbook 2003).
To illustrate the severity of the SARS phenomenon, during the six months from the start of the outbreak until the market returned to growth, Far Eastern traffic of AEA member air-lines declined by 23.1 %. However, the SARS impact was not limited to Far Eastern routes and the loss of long haul traffic invariably affected short haul routes as connecting passen-gers were reduced in numbers. The industry was taken by surprise by the severity of the crisis, the speed with which it struck and the length of time it continued. Although the AEA member airlines executed capacity cutbacks, they did not match the traffic losses (AEA: Yearbook 2004).
Not until October-November 2003 did traffic begin to show „normal‟ patterns, with growth rates of around 4-5 % inEurope, 7-8 % on the North Atlantic, andabout 4 % to the Far East, giving an overallfigure, including other regions, of around 6 % (AEA: Year-book 2004).
Other things worth to mention about 2003 are that currency fluctuations, in the shape of a strong Euro compared to the US dollar, which affected costs, revenues and market condi-tions (see Appendix 1).
In 2003, world economies generally maintained their slow climb back from 2001, with a growth of 2% for the OECD countries as a whole. These were global figures, to which the European economies compared relatively poorly. With a 2003 growth of only 0.7%, the EU was the only main economic region to post inferior figures than in 2002 (AEA: Year-book 2004).
2004:
The global airlines experienced a global economic slowdown as a consequence of the SARS phenomenon and the Iraq War and therefore suffered four years of losses and no growth. The continued crisis forced the airlines to build up new solutions to be able to meet the shifting needs of the customers and the market (AEA: Yearbook 2004).
Major swings characterized 2004, i.e. recuperation from the SARS phenomenon and effects of the war in Iraq. Minor growth could be observed on the Eastern routes, this however, decreased towards the end of the year (AEA: Yearbook 2005).
With an increase of 26 % in fuel price compared to the previous year, the industry contin-ued to suffer from these very high prices. The extreme changes in exchange rates led to significant appreciation of the Euro against the US Dollar (see Appendix 1), which influ-enced the airlines‟ results (AEA: Yearbook 2005).
The strongest economic performance from a worldwide perspective since 1976 was ob-served in 2004. This with a growth of 5,1 %. The US and China accounted for half of the total increase together (AEA: Yearbook 2005).
In 2004, China had a GDP growth of 9,5 % followed by an investment boom. With GDP growths of 2,6 % and 2,4 % respectively, Japan and Europe continued to underperform. These were however the highest figures in a long time (AEA: Yearbook 2005).
Threats and difficulties still remained in spite of a positive economic environment. High fuel prices that affected inflation were most the evident signs of these hardships. The high
levels of fuel prices were expected to stay strong as the demand for crude oil increased around the world. An increase in the airlines‟ costs was an impact of the continued escala-tion of fuel price (AEA: Yearbook 2005).
As the EU experienced its largest expansion ever with ten new members, there was a sig-nificant growth in traffic to and from these countries (AEA: Yearbook 2005; AEA: Year-book 2004 ).
The Single European Sky legislation was adopted in 2004, which created framework for a unified European airspace. The purpose of this legislation was to take apart the old frag-mented Air Traffic Control system that has for the past 15 years caused delay, inefficiency and environmental damage. This would bring together a large number of sovereign territo-ries and also similar pre-existing route networks (AEA: Yearbook 2005).
2005:
2005 was the first in many years were a stable traffic growth could be observed. The finan-cial picture was still dominated by energy prices but for the world economy, 2005 was a good year (AEA: Yearbook 2006).
The by many anticipated inflation did not occur, in spite of the record high fuel prices. In the 25 EU member countries the GDP growth was down to 1,6 % compared to 2,5 % the previous year. The economies that generally showed the strongest growth were the smaller ones. The growth in Europe was mainly caused by high levels of export as a result of the general positive trend in world trade. This combined with the fact that the Euro depreci-ated against the US Dollar (see Appendix 1) (AEA: Yearbook 2006).
Consumer eagerness for spending was damped as a result of high energy prices that have pushed up total inflation (AEA: Yearbook 2006).
2006:
2006 was a prosperous year for the airline industry, when no remarkable external events af-fected the traffic (AEA: Yearbook 2007).
With all regions performing well the world economies grew strongly this year. China, India and Russia had an exceptionally strong growth of 10 %, 8,3 % and 6,5 % respectively. Europe had a growth that was not as strong (2,8 %), but still the highest this century. The US and Japan also showed strong growth rates, even though they were much lower. Ger-many‟s, UK‟s and France‟s strong performances were the main reason for the growth in Europe (AEA: Yearbook 2007).
The recuperation on the European market were due to factors such as; higher employment levels, lower interest rates, higher investment levels etc (AEA: Yearbook 2007).
Given that the European economy is mainly export-led, the strength of the Euro had nega-tive implications for trade (see Appendix 1) (AEA: Yearbook 2007).
2007:
A ground-breaking Air Transport Agreement was signed between the EU and the US in April 2007, this after three years of negotiations. The agreement was developed to eliminate many of the rules governing operations between Europe and the US and will come in to ef-fect in March 2008 (AEA: Yearbook 2007).
Traffic volumes increased extensively, as for the three previous years and the airline indus-try reached new heights this year. It was mainly the traffic on long haul routes that in-creased, while the development of domestic traffic was significantly weaker. Globally traf-fic in particular for the Middle East and African routes increased, whilst the traftraf-fic devel-opment on Latin American routes were considerably weaker. The traffic in Europe in-creased with 6,5 % compared to the previous year (Luftfartsverket: Flygets utveckling 2007, 2008).
The improvements in result for the airlines were due to the decrease in fuel price during the remaining half of the year in 2006. Many airlines have in addition to these implemented programs for reducing costs the last years (Luftfartsstyrelsen: Omvärldsbevakning 2007, 2007).
2008:
The previous two-year strong global business cycle was weakened in during the fall in 2007, mainly in the US. What started as a strong concern on the financial markets, spread to the prices of real estate, consumers‟ expectations about the future and consequently their con-sumption confidence. Concerns grew and spread to Europe during the spring and summer of 2008, and during the fall large parts of the world economy entered a recession (Luft-fartsstyrelsen: Omvärldsbevakning 2008, 2008).
Air travelling is to a high degree dependant on the business cycle and has already affected the air travelling in Sweden as well as globally. The figure for the global international air travelling decreased with 2,9 % in September compared to the same month the previous. Many airlines was affected by the crisis and showed weaker financial results for the first nine months in 2008 compared to earlier. Reasons for this were a combination of high fuel prices and a decrease in demand for air travel (Luftfartsstyrelsen: Omvärldsbevakning 2008, 2008).
AEA stated in November 2008 that the single largest and most volatile cost factor for their members were the fuel (AEA: AEA meeting with AEA meeting with Czech government, policy makers and industry in Prague, 2008).
In 2008, a large number of airlines all over the world went bankrupted and more bankrupt-cies, take-overs and consolidations are to be expected (Luftfartsstyrelsen: Omvärldsbevakn-ing 2008, 2008).
The highest growth in passenger traffic has during the last five years been observed on emerging markets in Asia and within Asian countries and in Europe. The growth on more mature markets such as Northeast Asia, Europe and North America has been slightly smaller. Furthermore, the growth in international traffic to and from the Middle East has been very strong (Luftfartsstyrelsen: Omvärldsbevakning 2008, 2008).
The intensive climate debate with the airline in focus has forced through several environ-ment related measures and projects, both from the airline industry and from state govern-ments (Luftfartsstyrelsen: Omvärldsbevakning 2008, 2008).
The European Commission directive to include the aviation in the EU emission trading system (ETS) was decided by the EU Council in October to be adopted. The decision was opposed by the US and IATA. The new directive is required to be inverted into national law within twelve months. Operators that will be included in the ETS are all flights arriving
and departing from an EU airport, excluding those with very low levels of traffic. This starts from January 1st 2012 (Air Transport World, 2008).
2.1.3 LCC vs. traditional airlines
The differences between LCCs and traditional airlines are in more than one aspect essential for the study of this thesis. Not only since the two groups are compared against each other but also because it is important to understand what defines the two different groups. The concept of LCC was introduced in Europe in the beginning of the 1990s, however this concept has existed in the US for a longer period of time. During the last 10-15 years the numbers of LCCs have increased massively and 2007 was a record year for the LCCs, with over half a billion passengers in total. Internationally the LCCs represent more than 20 % of the world market and on the European market they represent almost 40 %, a figure which is expected to increase to 45 % in 2009 (Luftfartsstyrelsen: Flygtendenser 02/2008, 2008).
Most people have an intuitive feeling for what constitutes a LCC and a traditional airline respectively. However, where to draw the line between a LCC and a traditional airline has become more difficult over time as the traditional airlines have been forced to change their services to cut costs, to be able to compete. The define LCC-strategy assumes that both service- and cost levels deviate from those of the traditional airlines (Luftfartsstyrelsen: Flygtendenser 02/2008, 2008).
Below the most important differences between LCCs and traditional airlines are listed see Table 2).
2.2
Industry change and Porter’s Five Forces
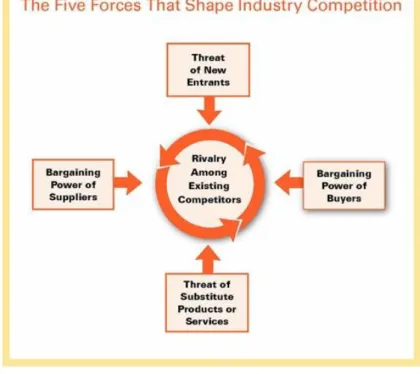
Figure 1. Porter's Five Forces (Porter, 2008).
To help clarify in what way the conditions of the airline industry have changed during the years of this study, 2000-2008, the model of the five forces that affect the industry structure by Michael Porter was included. (see Figure 1.).
The five forces described in Porter‟s model together create the conditions for profitability in a specified company. The forces can (and most likely will) change with time and are spe-cific to each industry (Porter, 2008).
Using the model made it easier to identify which forces that had, and which will, affect the European airline industry and, further more, in what way. With the model as guidance, af-ter each section in this chapaf-ter, follows explanations of the dynamics in the European air-line industry. This gives the reader an overview of the industry trends of the period and of the forces that cause the structure of the industry to change.
“In terms of response to purely economic stimuli, these figures are the weakest our industry has seen for 25 years, and with the major European economies still in transition to a recessionary state they cannot be expected to recover in the immediate future. The toxic combination of economic slowdown, a steep decline in business and consumer confidence, and fuel price-driven inflation which is hitting both the airlines and their customers is challenging the very structure of the industry.”
– Ulrich Schulte-Strathaus, AEA Secretary General (AEA: European Air line traffic in August/September, 2008 p. 1).
2.2.1 Rivalry Among Existing Competitors
The threat that arises from industry competition will be more significant the more competitors there are in a market, the stronger and more aggressive they are. But an industry can also be unattractive if it is very stable or decreasing in size. High fixed costs and high exit barriers will also contribute towards making it harder to compete within an industry. The degree of competition within an industry affects both prices (revenues) and costs. Tough price competition lowers the prices, while competition through extensive marketing increases costs (Porter, 2008).
2.2.2 Threat of new entrants
New entrants in a market are a threat because it changes the level of competition. How big this threat is depends on how high the entry barriers are of the market. High entry barriers mean fewer new entrants, and thus less of a threat (Porter, 2008).
2.2.2.1 Rivalry Among Existing Competitors and Threat of new entrants
applied to the airline industry
Since the initiation of deregulation and liberalization of the European market in the mid 1980s, the competition in the airline industry has grown sharper due to the increase in the number of airlines, destinations offered and the number of passengers (Luftfartsstyrelsen: Flygtendenser 02/2008, 2008). During the last ten years the competition in the intra-European traffic has increased significantly, much so due to the growth in numbers of LCCs, which have increased their total market share, in terms of intra-European seat ca-pacity, from 5 % in the summer of 2000 to 26 % in 2007 (AEA: AEA Yearbook 2001, 2001; AEA Yearbook 2007, 2007). This has challenged traditional airlines‟ strategies and forced them to look over their costs structure to keep up with the new actors in the market (Luftfartsstyrelsen: Flygtendenser 02/2008, 2008).
Depending on what routes the different airlines operate and on how large portion of their activities are on long haul traffic, they are subjects to different levels of competition from non-European airlines. North Atlantic routes, in passenger kilometer terms, forms the most important region for the AEA airlines and these face strong competition from US mega-carriers with an almost identical flight frequency (AEA: AEA Yearbook 2005, 2005). The LCCs by now dominate the intra-European market and this has affected the market in several ways, e.g. the whole industry, but especially traditional airlines, have implemented extensive cost saving programs to take market shares of competitors (Luftfartsstyrelsen: Flygtendenser 02/2008, 2008).
The company structures of European airlines have also changed. With the deregulation and liberalization of the market the privatization of the then common „flag carriers‟ (publicly owned airlines) also started. Among the 25 largest airlines in Europe, the share of publicly owned companies decreased from 28 to 16 % from 1996 until 2005. Today the airlines in the European industry are more diverse in their structures of ownership and many of the „flag carriers‟ have been in part or fully privatized. Further there has been an explosive
in-crease in the number of private airlines operating in different segments (Luftfartsstyrelsen: Flygtendenser 02/2008, 2008).
Considering the Threat of New Entrants in Porter‟s model there is rather a reverse trend in the international airline industry today. As mentioned before, the industry has since the end of 2007 experienced an above average number of bankruptcies. The European industry is also made less attractive for new entrants today since there already is a problem of excess capacity (see Table 3) and competition is hard between already existing actors.
Table 3. Annual average growth rates (%) of traffic volumes (tkp) and capacity (atk – available tonnes kilome-ters) globally and for specific geographical regions (IATA: Financial Forecast, 2008).
Rather, with the increase in fuel prices (which have by end of 2008 fallen back) and other costs for the airlines, consolidations, co-operations, fusions and such are an inevitable de-velopment. The trend to create larger units, either by acquisitions or by mergers, can be ex-pected to increase in the near future, this also among the LCCs (Luftfartsstyrelsen: Flygtendenser 02/2008, 2008).
2.2.3 Bargaining Power of Suppliers
Suppliers with great bargaining power can affect price and quality and are therefore not attractive for a com-pany. This situation often occurs when there exist few substitutes to the supplier in question, when the sup-plier is delivering an important input to the company and when the costs of changing supplier are high. To avoid suppliers with strong bargaining power it can be preferable for the company to strive for win-win relationships with its suppliers or, as an alternative, use a variety of different suppliers (Porter, 2008).
2.2.3.1 Bargaining Power of Suppliers applied to the airline industry
To understand the importance of different suppliers to the airline industry one need first to understand the general cost structure of the industry.
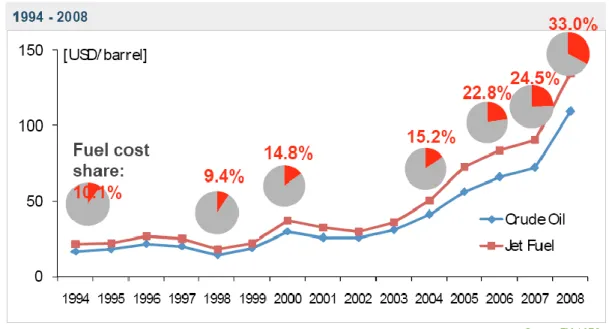
As mentioned earlier, AEA stated in November 2008 that that fuel is the single biggest, and most volatile cost factor for their member airlines(AEA: AEA meeting with AEA meeting with Czech government, policy makers and industry in Prague, 2008). Oil and fuel cost has during the period under study increased in importance (see Figure 2), much so due to sharp rises in the global market price of crude oil.
All airlines are dependent on the use of jet fuel and this is further more a cost that they can not affect. This makes the bargaining power of suppliers of jet fuel significant, even more
so in recent years as the part of the airlines‟ fuel cost has increased in relationship to total cost (see Figure 2)
Figure 2. Crude oil and jet fuel price development and fuel cost share of total cost for an average airline (AEA: Industry outlook presentation, 2008).
2.2.4 Bargaining Power of Buyers
In the same way as for suppliers, customer segment be-comes less attractive the stronger their bargaining power gets. This due to the fact that the buyers bargaining power affects the market price and thereby also revenues. Costs can also be affected when buyer bargaining power is high enough to demand changes in a company‟s products or services (Porter, 2008).
2.2.4.1 Bargaining Power of Buyers applied to the airline industry
During the ten years 1997 – 2007, the global international traffic almost doubled from 438 to 818 million passengers. Still, the total of national traffic in the world is significantly lar-ger with more than 1,4 billion passenlar-gers, of which the huge national market of the US constitutes a considerable part. There has been an evident increase in the number of pas-sengers within Europe as well the last ten years (see Table 4 below). This increase is, in large part, a result of the expansion of the LCCs (Luftfartsstyrelsen: Flygtendenser 02/2008, 2008).
Table 4. Growth of scheduled RPK (AEA: Yearbook 2007 & 2000).
Scheduled RPK 2006 (millions) 1999 (millions) % change
Intra-Europe 226 647.0 121 883.4 85,95%
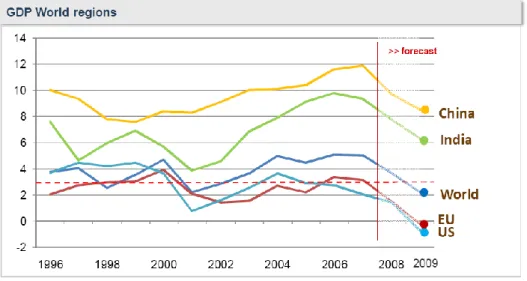
The amount of business travellers has dropped and leisure travelling has increased during the same period. People travelling in business have traditionally been the most important source of income for the traditional airlines. Although business travellers only accounts to 15 % of the airlines‟ passengers they represent 28 % of the revenues. The trend of this type of customer, increasingly prioritizing lower prices to a high level of service is troublesome for the airlines not in the LCC segment (Luftfartsstyrelsen: Flygtendenser 02/2008, 2008). Not surprisingly, given the evidence on income elasticity, the industry is sensitive to fluc-tuations in the general level of economic activity (Johnson, 2003). Since the European and most other economies in the world have experienced significant fluctuations during the pe-riod of study this has evidently affected the amount of air traffic. Figure 3 shows how growth in GDP has developed since 1996.
Figure 3. GDP growth for different regions of the world (AEA: AEA meeting with AEA meeting with Czech government, policy makers and industry in Prague, 2008).
In Europe, passenger development reached a high late summer 2008 and has since then had a weak trend. This was the first time since the early 1980s that the traffic loss was due to essentially economic factors (AEA: European Air line traffic in August/September, 2008). AEA predicts, in accordance with this, that the current economic downturn and weak economic outlook will reduce demand increasingly in the near future (AEA: AEA meeting with AEA meeting with Czech government, policy makers and industry in Prague, 2008).
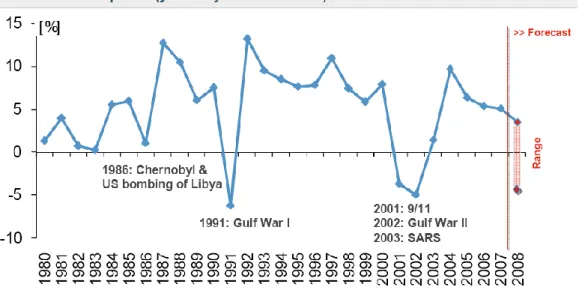
Figure 4. The development of AEA member airlines‟ RPK (Revenue Passenger Kilometers), and how indus-try crises have affected it, from 1980 until May 2008, and a forecast made by AEA for the rest of 2008 (AEA: State of the industry, 2008).
As hinted before, customer confidence have also, throughout the years, been affected by sudden shocks in the world. In 1990-91 during the six weeks of the Gulf War the sur-rounding world was hit hard, and the traffic in Europe fell drastically compared to the pre-vious year. A corresponding fall in capacity did however not match this fall. Capacity utili-zation, measured by RPK as a percentage of ASK fell considerably as a result of this (see Figure 4) (Johnson, 2003).
A sudden shock that also led to an instant extensive decline was the terrorist attacks of September 11th in 2001. The airlines did this time however react more rapidly by cutting capacity and employment. Significant capacity problems prior to September 11th were how-ever the reason some of these cuts (Johnson, 2003).
Aggressive price cutting and strong marketing campaigns were the LCCs way of respond-ing to the crisis. This did in some cases lead to substantial increases in traffic and large ex-pansion plans, e.g. Ryanair had at the beginning of 2002 orders for 100 new aircraft, this when the major airlines were reducing their fleets (Johnson, 2003).
As mentioned previously (section 2.3.2.1), the LCCs dominate the intra-European market and this has affected the consumer behaviour of this market in a number of ways. New trends of the market are; an increase in weekend travelling at the cost of longer vacations and also an increase in online booking of air travels, which has increased the bargaining power of the customer by making it easier to compare prices and other alternatives, but at the same time has decreased distribution and agency costs for the airlines (Luftfartsstyrel-sen: Flygtendenser 02/2008, 2008).
Air passengers of today are very aware of prices. Both business travellers and those travel-ling for leisure often make plans and book flights based on fare levels. As a result, even small differences in price level between airlines significantly affect number customers.
The LCCs were early in realizing the price sensitivity of customers. Today they represent a significant part of the intra-EU market and they are steadily gaining market shares. Compe-tition and price awareness has meant an increased pressure for airlines to lower their fares. To achieve higher cost efficiency, many airlines have recent years accordingly made exten-sive rationalizations concerning their operating cost structure e.g. by making it easier to book flights online and by cutting back on customer service. The price awareness of pas-sengers makes many airlines focus their marketing on fare levels (Flygets utveckling 2007, 2008).
2.2.5 Threat of Substitute Products or Services
The substitutes available affect the company and its competition to a high degree. The more and the closer substitutes, the more effected are prices and thus revenues (Porter, 2008).
2.2.5.1 Threat of Substitute Products or Services
ap-plied to the airline industry
As a consequence of in the long term increasing oil prices, much due to decreasing reserves and increasing cost to extract oil form current and new reserves, other alternatives are needed but yet not found and implemented on a large scale.
Increasing environmental concern, expressed by changing consumer preferences and creasing government regulation, is also a threat for the long term growth of the airline in-dustry. Another force affecting the future structure of the European airline industry, which will not be discussed further in this paper, is the affect of political regulations on such as system for trading of certificates of emission and taxes. During recent years high speed trains have appeared as an important competitor to the European airlines, especially on routes like Brussels – Paris, London – Paris and Amsterdam – Paris. Also within national markets, such as France and Spain, the competition of high speed trains has gained impor-tance (Luftfartsstyrelsen: Flygtendenser 02/2008, 2008).
2.3 Ratio analysis
Ratio analysis is a form of corporate analysis. Corporate analysis, from the point of view of an external stakeholder, can refer to the analysis of a variety of different aspects of a com-pany, such as of market development, competitiveness, financial stability and profit devel-opment (Carlson, 2004).
Quantitative analysis is, by practioners, the most commonly used form of corporate analy-sis. The financial aspect of corporate analysis is particularly suited for quantitative analyanaly-sis. Financial analysis can easily be related to the company‟s current bookkeeping, since all companies present their activities using quantitative measures in reports such as balance sheets and income statements. Through combining different parts of the available reports, new information can be generated. This type of new information is usually called ratios and can be used for analyzing the company‟s development in a more comprehensive way and makes it easier to compare it to competitors. Already existing information is sometimes re-ferred to as ratios as well, this when the information in question is believed to be of impor-tance for understanding and evaluating the development of the company (Carlson, 2004). Ratios can thus be defined as:
Important financial information, derived from one or more accounting values and/or factors of
re-calculation
Important existing value from accounting reports Accordingly ratio analysis is defined as:
An evaluation of the level of different ratios and their respective development/trend.
2.3.1 Different purposes of ratio analysis
One of the most common purposes of ratio analysis is to analyze the own company‟s status and trends of development. Another important area in which ratio analysis is used is for following the development of competing firms in order to evaluate a company‟s relative development. Without the knowledge of the normal levels of a ratio for an industry, it is not possible to set realistic objectives within the own company (Carlson, 2004).
Apart from the internal purposes of using ratio analysis, external parties may also want to evaluate a company based on financial reports information. Calculating and comparing fi-nancial ratios helps to avoid the problems involved in comparing companies that are of dif-ferent sizes (Jaffe, Jordan, Ross & Westerfield, 2008). Financial ratios based on information from financial reports are frequently used with the explanation that they are considered to be hard, objective measures and that they are based on publicly available information (Bal-caen & Ooghe, 2006).
2.4 The ratios chosen for this thesis
The five financial ratios included in the financial aspect part of the observational scheme will now be presented. These are followed by a presentation of the three ratios specific to the airline industry.
2.4.1 Traditional financial ratios
The following are traditional definitions financial ratios, based on information available to the public through financial reports from companies.
Measure of…
Current ratio liquidity/short-term solvency
Quick ratio liquidity/shot-term solvency
Debt-equity ratio indebtedness/solvency
Profit margin profitability
2.4.1.1 Liquidity
Liquidity ratios are intended to measure short-term solvency of a company. Of primary concern is the company‟s ability to be able to cover for short term claims and conse-quently, the focus of these ratios are current liabilities and current assets. When looking at current assets and liabilities, one advantage is that book values and market values are likely to be more comparable. They do not exist long enough to get seriously out of step, but a negative side effect is that current liabilities and assets change relatively rapidly which means the measure could show a very different picture in the near future (Jaffe et al., 2008).
2.4.1.1.1 Current ratio
The current ratio is a well known and widely used ratio. It is defined as the quotient of cur-rent assets and curcur-rent liabilities and is a measure of short-term liquidity. A short-term creditor of a company would prefer this ratio to show a high value, while for the company itself a high current ratio value might be a bad sign indicating that the company is using its short-term assets in an inefficient way. In general, a financially healthy company should have a current ratio of at least 1. A value less than 1 means that net working capital is nega-tive (current assets – current liabilities). Though, this might not be a bad sign if the com-pany has unused granted credit if needed (Jaffe et al., 2008).
Current ratio = Current assets Current liabilities
2.4.1.1.2 Quick ratio
The quick ratio is similar to the current ratio but it excludes inventory from the current as-sets. Inventories are normally the least liquid current asset and also a common source di-vergence of the market value of current assets from the book value of current assets, e.g. due to non-consideration of quality of the inventories. Also inventory might turn out to be damaged, lost or obsolete. If the company has over estimated demand and has a significant proportion of current assets tied up in inventory, this might be hard to sell and thus hard to turn in to cash quickly (Jaffe et al., 2008).
Quick ratio = Current assets – Inventory Current liabilities
2.4.1.2 Indebtedness
Indebtedness or solvency can be a threat to the company‟s survival, this due to the risk that a high level of indebtedness implies (Sandberg, 1993). Long-term solvency ratios intend to address the company‟s long-run ability to meet its obligations to creditors and claimhold-ers. These ratios are sometimes called financial leverage ratios or just leverage ratios (Jaffe et al., 2008). The level of indebtedness shown by a company is, amongst other factors, of-ten influenced by which part of the business cycle the company is in (Carlson, 2004).
2.4.1.2.1 Debt-equity ratio
The debt-equity ratio is defined as average debt in relation to average equity, and is a meas-ure of level of indebtedness. The relationship between solvency and the debt-equity ratio is that a debt-equity ratio of 4 corresponds to a solvency of 20% (Sandberg, 1993). This ratio takes into account all the debts and obligations that the company has to its creditors and claimholders (Jaffe et al., 2008). Showed by the relationships in the leverage formula, an in-crease in the level of a company‟s debt-equity ratio, i.e. its use of leverage, will cause ROE to increase. Also the average cost of debt will increase with an increase in such a case, which shows that an increase in leverage means an increase in risk to creditors. (Wramsby & Österlund, 2004).
Debt-equity ratio = Total debt Total equity
2.4.1.3 Profitability
The ratios measuring profitability are probably the best-known and most widely used of all financial ratios. In different forms they intend to measure operation management and use of assets efficiency (Jaffe et al., 2008).
2.4.1.3.1 Profit margin
Companies often give this measure of profitability a great deal of attention. A high profit margin is of course in general desirable. However, margins that are smaller are not neces-sarily bad. A lower profit margin on each unit sold can mean a higher sales volume and thus a higher total profit. Different industries are characterized by having very different profit margins (Jaffe et al., 2008).
Profit margin = Net income Sales
2.4.1.3.2 Return on equity (ROE)
ROE is a measure of equity holder‟s return during the year. It is a frequently cited number and therefore it is important to remember that it is showing an accounting rate of return. For this reason, ROE is at times referred to as return on net worth. ROE also reflects the company‟s use of leverage (Jaffe et al., 2008). As previously mentioned, an increase in the company‟s level of indebtedness will have a positive effect on ROE (Wramsby & Öster-lund, 2004).
ROE = Net income Total equity
2.4.2 Industry specific ratios
Three key ratios often recurring in financial reports of airlines and in airline industry re-ports are Revenue passenger kilometers, Available seat kilometers and Passenger load fac-tor. All of these ratios are closely connected to one another and therefore will likely show similar trends. However, they all contribute with interesting aspects of sales volume, capacity and capacity utilization.
Measure of…
Available seat kilometers (ASK) Passenger carrying capacity Revenue passenger kilometers (RPK) Sales volume of passenger traffic Passenger load factor (PLF) Capacity utilization
2.4.2.1 Available seat kilometers (ASK)
ASK expresses the number of seats available for sale multiplied by the distance flown and is a measure of the carrying capacity of the airline (British Airways: Report and Accounts for the year ending 31 March 2008, 2008; AEA: European Air line traffic in Au-gust/September, 2008).
seats available × distance flown
2.4.2.2 Revenue passenger kilometers (RPK)
RPK is a measure of the number of revenue passengers carried multiplied by the distance flown (British Airways: Annual Report and Accounts 2007/08, 2008). A revenue passenger is a passenger for whose transportation an air carrier receives commercial remuneration, thus excluding passengers travelling under fares available only to airline employees and ba-bies and children who do not have a seat of their own.
The RPK of an airline is the total number of kilometres travelled by all passengers. It is a measure of sales volume of passenger traffic and is often used to measure passenger growth of a single airline or the industry as a whole (IATA: Financial forecast, 2008).
revenue passengers × distance flown
2.4.2.3 Passenger Load Factor (PLF)
PLF of an airline, sometimes simply called the load factor, is a measure of capacity utiliza-tion, in other words it shows how much of an airline's passenger carrying capacity is used. It is expressed as passenger-kilometers flown as a percentage of seat-kilometres available. As airlines frequently have heavy fixed costs and is capital demanding, the efficiency with which assets are used is crucially important. This is an important efficiency measure, but it does not consider the pricing and the profitability at which the capacity is sold. It also im-plicitly assumes that the airline's fleet is fully utilized in terms of the number of kilometres flown (Lufthansa: Glossary, 2008).