An Investigation of CPU utilization
relationship between host and guests
in a Cloud infrastructure
Vida Ahmadi Mehri
Faculty of Computing
Blekinge Institute of Technology SE–371 79 Karlskrona, Sweden
This thesis is submitted to the Faculty of Computing at Blekinge Institute of Technology in partial fulfillment of the requirements for the degree of MSc in EE with focus on Telecommu-nication systems.The thesis is equivalent to 20 weeks of full time studies.
Contact Information: Author:
Vida Ahmadi Mehri
E-mail: seah10@student.bth.se
University advisor: Prof. Kurt Tutschku
Department of Telecommunication systems
Faculty of Computing Internet : www.bth.se Blekinge Institute of Technology Phone : +46 455 38 50 00 SE–371 79 Karlskrona, Sweden Fax : +46 455 38 50 57
Abstract
Cloud computing stands as a revolution in IT world in recent years. This technology facilitates resource sharing by reducing hardware costs for business users and promises energy efficiency and better resource utilization to the service providers. CPU utilization is a key metric considered in resource management across clouds.
The main goal of this thesis study is directed towards investigating CPU utilization behavior with regard to host and guest, which would help us in understanding the relationship between them. It is expected that perception of these relationships would be helpful in resource management.
Working towards our goal, the methodology we adopted is experi-mental research. This involves experiexperi-mental modeling, measurements and observations from the results. The experimental setup covers sev-eral complex scenarios including cloud and a standalone virtualization system. The results are further analyzed for a visual correlation. Results show that CPU utilization in cloud and virtualization sce-nario coincides. More experimental scesce-narios are designed based on the first observations. The obtaining results show the irregular behav-ior between PM and VM in variable workload.
CPU utilization retrieved from both cloud and a standalone system is similar. 100% workload situations showed that CPU utilization is constant with no correlation co-efficient obtained. Lower workloads showed (more/less) correlation in most of the cases in our correlation analysis. It is expected that more number of iterations can possibly vary the output. Further analysis of these relationships for proper resource management techniques will be considered.
Keywords: Cloud computing, CPU utilization, Measurement, Open-Stack
Acknowledgements
I would like to express my deepest and sincere gratitude to my supervisor Prof. Dr. Kurt Tutschku for his invaluable guidance, encouragement, patience and continuous support throughout my thesis. It would not have been possible to accomplish this without his supervision and help.
I would like to extend my sincere gratitude to Anders Carlsson for his contin-uous support, invaluable guidance and encouragement.
I am indebted to my program manager Dr. Patrik Arlos for his valuable guidance and suggestions during my journey. I sincerely thank Dr. Dragos Ilie for all his help, encouragement and suggestions.
I acknowledge City Network Hosting AB for letting us perform tests in their infrastructure.
I am thankful to my wonderful family for their never ending support and motiva-tion. Special thanks to Varaynya and all my friends for great help and support.
List of Figures
3.1 Hardware virtualization - Type1 Hypervisor[15] . . . 9
3.2 Hardware virtualization - Type 2 Hypervisor[15] . . . 9
3.3 OpenStack conceptual architecture model [26] . . . 12
3.4 Spiral model . . . 13
3.5 Possible correlation model between host and guest . . . 14
3.6 Three dimension of effective fuctors[34] . . . 15
3.7 Sample output of mpstat in CLI . . . 16
3.8 Sample output of top in CLI . . . 17
3.9 OpenStack node architecture model . . . 18
3.10 OpenStack compute node - conceptual model . . . 18
3.11 Experimental model . . . 19
3.12 Steps of load generating in experiment with stress tool . . . 21
3.13 Depiction of standalone device of experimental for Single guest . . 23
3.14 Stages of imposed stress on VCPU in single guest . . . 24
3.15 Method to generate load om 1 or more VCPUs with 10, 20, 30, 40, 50 and 100% load by stress-ng . . . 26
4.1 CPU utilization monitored in City Network’s compute node and standalone system for multiple number of VMs . . . 28
4.2 Scatter plots of relation between average CPU utilization on host and guest while 1 VCPU stressed . . . 30
4.3 Scatter plots of relation between average CPU utilization on host and guest while 2 VCPU stressed . . . 31
4.4 Scatter plots of relation between average CPU utilization on host and guest while 3 VCPU stressed . . . 32
4.5 Scatter plots of relation between average CPU utilization on host and guest while 7 VCPU stressed . . . 33
4.6 Scatter plots displaying the CPU utilization relation between host and guest in different load conditions for 1VCPU - mpstat tool . . 35
4.7 Scatter plots displaying the CPU utilization relation between host and guest in different load conditions for 2VCPU - mpstat tool . . 36
4.8 Scatter plots displaying the CPU utilization relation between host and guest in different load conditions for 5VCPU - mpstat tool . . 37
4.9 Scatter plots displaying the CPU utilization relation between host and guest in different load conditions for 1VCPU - top tool . . . . 38 4.10 Scatter plots displaying the CPU utilization relation between host
and guest in different load conditions for 2VCPU - top tool . . . . 39 4.11 Scatter plots displaying the CPU utilization relation between host
and guest in different load conditions for 5VCPU - top tool . . . . 40
List of Tables
3.1 Minimum hardware requirement for OpenStack nodes[26] . . . 12 3.2 Specifications of the OpenStack Compute Node used for experiments 20 3.3 Specifications of the standalone system for experiments . . . 22 4.1 Correlation coefficient between centOS host and guest- Load
gen-erator stress-ng, mpstat tool NA*- Not Applicable . . . 41 4.2 Correlation coefficient between centOS host and guest- Load
gen-erator stress-ng, top tool NA*- Not Applicable . . . 41 4.3 Correlation coefficient between Ubuntu host and guest- Load
gen-erator stress-ng, mpstat tool NA*- Not Applicable . . . 42 4.4 Correlation coefficient between Ubuntu host and guest- Load
gen-erator stress-ng, top tool NA*- Not Applicable . . . 42
List of Abbreviations
CBN . . . Cloud Based Networking CEN . . . Cloud Enabled Networking CLI . . . Command Line Interface CPU . . . Central Processing Unit
FI-PPP . . . Future Internet- Public Private Partnership IaaS . . . Infrastructure as a Service
KVM . . . Kernel Virtual Machine
NIST . . . National Institute of Standards and Technology OS . . . Operating System
PaaS . . . Platform as a Service
PCPU . . . Physical Central Processing Unit PM . . . Physical Machine
QEMU . . . Quick Emulator
RAM . . . Random Access Memory SaaS . . . Software as a Service SLA . . . Service Level Agreement VC . . . Visual Correlation
VCPU . . . Virtual Central Processing Unit VM . . . Virtual Machine
VMM . . . Virtual Machine Monitor
Contents
Abstract i
Acknowledgments iii
List of Abbreviations iii
List of Figures iii
List of Tables iv
1 Introduction 1
1.1 Background . . . 1
1.2 Aim and Objectives . . . 2
1.3 Research question . . . 3
1.4 Expected contribution . . . 4
1.5 Outline of a report . . . 4
2 Related Work 5 3 Methodology and underlying technology 7 3.1 Underlying technology . . . 7
3.1.1 Virtualization . . . 7
3.1.2 Hypervisor . . . 8
3.1.3 Cloud computing and OpenStack . . . 10
3.2 Methodology . . . 12
3.2.1 Measurement tools . . . 14
3.3 Modeling . . . 17
3.4 General experiment setup . . . 19
3.4.1 OpenStack test case . . . 20
3.4.2 Standalone test case . . . 22
3.4.3 Single guest with stress . . . 23
3.4.4 Single guest with stress-ng . . . 25
4 Results and analysis 27
4.1 Results from OpenStack and standalone test case . . . 27
4.2 Results of generating load with Stress . . . 29
4.3 Results of generating load with Stress-ng . . . 34
4.3.1 Mpstat tool . . . 34
4.3.2 Top tool . . . 37
4.4 Analysis . . . 40
5 Conclusions and Future Work 43 5.1 Conclusions . . . 43 5.1.1 Multi guests . . . 43 5.1.2 single guest . . . 43 5.2 Future work . . . 44 References 45 viii
Chapter 1
Introduction
This chapter consists of overview of the cloud computing and state the problem which brings up our research questions. The goal of the thesis work and expected contribution is presented in this chapter. Outline of a report is shown in section 1.5.
1.1
Background
Cloud computing is one of the fast growing parts of information technology areas that offer resource sharing with maximized effectiveness, scalability, and flexibil-ity. Cloud computing offers three service models namely, Software as a Service, SaaS, Platform as a Service, PaaS, and Infrastructure as a Service, IaaS. SaaS provides application and software for consumer as a host in the cloud. PaaS, enable consumers to develop their own applications in the cloud infrastructure. IaaS produces resource provision like network, storage, memory, and processor for consumers to deploy and operate their instances into the cloud [1,2,3]. These functionalities lead the monitoring resources, services and applications to new level with respect to cloud service provider point of view. Service providers’ in cloud environment used IaaS model to provide computer resources for their customers along with their traditional role for managing resources and billing base on usage. They need to monitor usage of computer resources and system performance to fulfilled their promises to the consumers. This is not a new topic in a traditional system but it is complex in cloud environment due to immaturity and lack of standards for new service model [4,5].
The cloud service provider cost mainly relies on CPU utilization of the active resources while the cloud customer cost depends on the resources leased time. Greater CPU utilization creates more heat in a datacenter and it will increase power electricity and cooling cost. Power electricity and cooling generate approx-imately 40% of the cost in datacenters [6,7]. As cloud promise the strategy to deliver ICT services by improving the utilization of datacenter resources [8] and CPU is one of the resource that has much effected on energy consumption, CPU utilization is selected as a performance metric in this study.
CPU utilization is the value between 0-100, which is refer to percentage of CPU 1
Chapter 1. Introduction 2 usage by process. When the value reached to 100 that means CPU is completely occupied and it is not available for new process. The new request is placed in a queue and it produces bottleneck in the system. To avoid the performance problem it is important to keep track of CPU utilization and manage resource usage [9].
In the cloud computing virtualization technology is used in order to share hard-ware resources between multiple virtual machines and physical machine. Service provider in cloud environment needs to monitor utilization for managing resources and ensure to have sufficient resources for their customers regarding to SLA [4]. There is a challenge for extract monitoring data of Virtual Machine, VM, and make it available for host, as service provider doesn’t have access to data inside VM. The service provider and its customer in cloud have a different view of sys-tem performance and it is depend on the method used for collecting data. In this study we investigate CPU utilization from customer and service provider point of view in cloud infrastructure to obtain relationship between host and guests in term of CPU utilization. This will help service provider to bill their customers based on time and workload. This relationship will be applied for resource man-agement to avoid headroom and hotspot in a system and reduce overall energy consumption.
The main purpose of this study is investigating effective model for data collec-tion and it proposed simple approach to measure CPU utilizacollec-tion by using Linux available tools, which are widely used by system administrator. We conduct experimental research on CPU utilization on guest and host across standalone system and OpenStack compute node.
This thesis is carried out in collaboration with the thesis “Monitoring and analysis of CPU load relationships between host and guests in an Cloud Networking In-frastructure”[Krishna’s Thesis ref.]. While this thesis focuses on CPU utilization as a performance metric to collect and analysis data for observing relationship between physical and virtual machine, her thesis’s focuses on CPU load as a per-formance metric. The differences mainly come from those metrics definitions. When CPU is utilized it could not respond to the new requests for a period of time and the new request will place in a queue. CPU load contains the number of processes served by CPU and the number of processes is waiting in a queue. CPU Load is used for load management in a system for decreasing respond time to process requests while CPU utilization lead to resource management and en-ergy efficiency. The experimental scenarios of both the theses coincide, yet we have our individual contribution in observation and analysis of results.
1.2
Aim and Objectives
The aim of this project is to investigate relationship between CPU utilization in host and guests to give a good overview for handling resource management. There
Chapter 1. Introduction 3 are multiple tools that are used today but some of them are not free and some have a complex configuration and need much administrative job. The purpose of this project is to use available tools in Linux distribution system for simplicity. We designed different scenarios to study the effect of guest’s CPU utilization on host and other guests. Also we figure out visual correlation from experimental results.
Service provider in cloud computing needs a method to investigate they have sufficient resources available to provide service level agreement and quality of services to their customers.
Main objectives of the thesis will accommodate:
• Study simple available tools for CPU performance evaluation that is widely used by system administrators
• Study the method to create workload on a virtual machine
• Design a model for performing experiment in cloud infrastructure based on OpenStack
• Design a model of standalone system based on OpenStack compute node which is host of virtual machines
• Define a method to collect CPU utilization of host and guests • Selected tools for data collection in host and guests
• Implement the model and perform experiment in standalone system and OpenStack compute node
• Mathematical modeling of correlation based on the results
• Analysis visual correlation between host and guest by using a scatter plot of results
1.3
Research question
As mentioned in section 1.2, our purpose is to create a model that can be used by an administrator in cloud infrastructure to predict the CPU utilization in virtual machine based on data collected from a physical machine in order to ensure resource availability. The goal is investigating the relationship between CPU utilization in host and guests. This lead to our research questions:
1. How do you design model for monitoring CPU utilization in physical and virtual machine?
Chapter 1. Introduction 4 2. How can investigate the relationship of CPU utilization between host and
guests?
3. In what way is investigation helpful for resource management?
1.4
Expected contribution
The following are the expected outcomes of the thesis:
• Design and modeling of cloud and virtualization scenarios for experiments. • Data collection and obtaining CPU utilization in different scenarios
• Obtaining linear correlation in the CPU utilization of physical and virtual systems for better understanding.
• Method for analyzing CPU utilization relationships in virtualized environ-ment.
• Analysis and mathematical modeling of the correlation
1.5
Outline of a report
Similar research to our work will explain in next chapter and will compare them with this study in order to pick the research gap up. In chapter 3, gives an overview about virtualization technology, tools and the method for collecting monitoring data. Experimental setup is presented under this chapter. The result of different scenario is shown in chapter 4 and is analyzed in chapter 5. This work will conclude in chapter 6.
Chapter 2
Related Work
This section presents the previous works done that stand as motivation for our thesis in several contexts. It presents the works where CPU utilization was used as a deciding factor for reaching their objectives of determining performance in clouds.
In [10], the authors performed experiments in multi tenant and single tenant cloud for making comparison between their performances. According to their hypothesis, single-tenant cloud environment should have smaller CPU utilization than multitenant environments. Even though this is quite obvious, their results proved otherwise. Their performance tests were based on two web services in dif-ferent cloud environments. Their results show that in most of the scenarios, single tenant clouds showed higher CPU utilization than multi-tenant clouds. Based on this, their future work included further tests on different cloud scenarios with different metrics. Our thesis is not only similar to their work in terms of metric – CPU utilization, but also includes performance tests in operational cloud and virtualization environments to observe the metric’s behavior with respect to guest and host.
Another research in this direction is [11], which provides analysis and charac-terization of server resource utilization in a large cloud production environment. The researchers in this paper discovered that the CPU utilization of about 4.54 to 14% is wasted, which leaves further scope for resource management techniques to come into picture. Making a fine-grain analysis of the correlation and workload types would be their potential future work. Similar to this, there is another re-search in performed in measuring server utilization in public clouds. The authors of [14] believe that it is important to understand current utilization level in cloud environment to improve it and developed a technique to identify current CPU utilization level from physical server.
As energy efficiency is a concerned topic for many, authors of [13] addressed this issue by consolidating VMs. For the same, they have done experiments on OpenStack cloud with optimization goals and guidelines set. The results proved
Chapter 2. Related Work 6 that VM consolidation is definitely an optimal solution for better management of resources and we implemented our test cases in the same direction by testing on a multi tenant cloud.
The paper [12] presents an empirical study on OpenStack cloud’s scheduling func-tionality aiming to evaluate OpenStack scheduler with respect to memory and CPU cores of PM and VMs and their interactions. Their analysis states that number of CPU cores assigned to virtual machines stands as an important aspect in resource allocation of OpenStack schedulers.
Inspired by these related researches that are summarized above, we understand the importance of CPU utilization in resource management for better efficiency in cloud infrastructures and our thesis is a measurement study performed to un-derstand the CPU utilization for better resource management applying.
Chapter 3
Methodology and underlying technology
The first step is defining method to obtain our goal. In section 1.1 we identified a research problem that is unknown relationship between host and guest in cloud computing. Section 2 presented similar work, which is done by other researchers to show the research gap. To perform method we need to get insight about infrastructure and their underlying technologies.
In the second step, we need to provide methodology for our research in order to reach initial information for answering our research questions. The next step is discovering required parameters and the algorithms, which will use to structure the model. After the model has been created it will be evaluated by conducting experiment on real environment in cloud infrastructure and standalone system. This chapter provides overview of virtualization and cloud computing technology to specify the infrastructure used in this study. Also, it contains methodology and the designed model to conduct experiment.
3.1
Underlying technology
This section provides the overview of fundamental concepts, which helps to un-derstand our thesis work area. Different virtualization techniques and hypervisor types explain briefly in section 3.1.1 and 3.1.2. Cloud computing principles and OpenStack architecture are presented in section 3.1.3.
3.1.1
Virtualization
Virtualization is the act of creating virtual version of devices, servers, and net-works including Operating Systems. These virtual machines are configured and run on physical machines and there can be multiple VMs sharing resources on a single host. There are many techniques of virtualization like OS virtualization and Hardware virtualization.
• OS virtualization
When OS is portioned into multiple instances that behave like individual 7
Chapter 3. Methodology and underlying technology 8 guest systems, it is called OS virtualization. These systems can be run or managed independently. These virtual servers or machines are provided to the customers for high performance and can also be used by operators as virtual servers. However, there is a disadvantage to this technique because it uses same kernel version as they are partitioned on same OS [15].
• Hardware Virtualization
In this technique, VMs are created with a complete OS resembling a physical machine. These VMs are independent compute machines with kernels of their own. Moreover, they can have different kernel versions. This technique provides all the hardware components that support installation of VMs. There are two types of hardware virtualization:
– Full virtualization binary translations: when instructions are given to the VM, the VM’s kernel forwards it to the host and those instructions are translated during run time by the host machine [15].
– Full virtualization hardware assisted: The hypervisor that hosts the VMs and that acts like a VMM is responsible to the operations on the VM.
• Para virtualization
Para virtualization: In this case, a virtual system will be provided with an interface for virtual OS to use the physical resources through hyper calls. It is visible in storage controllers and network cards [16].
3.1.2
Hypervisor
Hypervisor also called, as a virtual machine monitor is the software that is re-sponsible for creating and administrating the virtual machines. There are two types of hypervisors:
• Type 1 - This type of hypervisor will be running on the CPU but not as software on the OS. The administration and monitoring of the VMs is performed by the first VM installed, which is made to run on ring 0. This is responsible for creation and provision of the VMs. It is also called as bare-metal hypervisor and Xen is an example. As it shows in Figure 3.1, type 1 hypervisor has its own CPU scheduler for guests’ virtual machine [17].
• Type 2 -This type of hypervisor is installed like a software on host OS and it is responsible for monitoring and creating VMs on the host. KVM is an example. Figure 3.2 represented type 2 hypervisor, which is following kernel schedule [17].
tech-Chapter 3. Methodology and underlying technology 9
Figure 3.1: Hardware virtualization - Type1 Hypervisor[15]
Figure 3.2: Hardware virtualization - Type 2 Hypervisor[15]
nologies. This comes as a pair with another user process – QEMU, Quick Emulator. Both KVM and QEMU together create virtual instances using hardware virtualization mechanism. Two popular clouds that use KVM are Joyent and Google Compute Engine [4]. First guests are created and as-signed the VCPUs and then provided with scheduling by hypervisor. The number of VCPUs that can be allotted is limited to the physical CPUs available [18].
Hardware support on VM is only unto 8 virtual cores for each physical core. If this is exceeded, QEMU provides software virtualization to KVM. For better performance, 1 VM can be allocated with 1 virtual core [19].
Chapter 3. Methodology and underlying technology 10
3.1.3
Cloud computing and OpenStack
As stated before, cloud computing is a widespread phenomena where a phys-ical resource is shared by multiple servers. This technology offers three types of services - Infrastructure-as-a-Service (IaaS), Platform-as-a-Service (PaaS) and Software-as-a-Service (SaaS) [1,2].
IaaS is the service that provides infrastructure – compute and network resources to the consumers. The customers have the possibility to create and provision their systems as desired. PaaS is the service that provides a platform for the user to install and run their applications and SaaS is the service that provides required software to the customer for usage [1,2].
When such clouds are interconnected it is called as federated clouds and it is a popular trend in Future Internet. One project working towards cloud federation is FI-PPP, Future Internet Public Private Partnership framework. This project comprises of various other projects and XiFi is a project aiming at building and providing smart infrastructures for FI-PPP. These Infrastructures enable the de-ployment of several applications and instances in a unified market place. BTH is one among the current operational nodes across Europe [20].
These clouds communicate with each other via networking devices and they are highly scalable and secure. They are implemented at multiple places and user has the power to choose his desired location for installing his instances or appli-cations. The user can move his instances to other locations when hardware at one location malfunctions.
XiFi nodes utilize OpenStack for building their heterogeneous clouds and pro-vide various tools and generic enables to the user to facilitate deployment of applications. They follow the standards of cloud computing namely, on demand self-service, resource pooling, scalability and security [20].
Another example for such federated platform is the infrastructure at City Net-work hosting AB. City NetNet-work AB is a corporation that provides cloud domain services and hosting to its customers. The services are delivered to customers via OpenStack’s dashboard, where the customers can create and provision their VMs similar to XiFi. CityNetwork offers storage and other high quality services to its customers via dashboard. This web interface is called as City Cloud and is similar to FIWARE cloud lab of XiFi. The dissimilarity is that City Network upgrades regularly to latest OpenStack releases unlike XiFi. Currently, they pro-vide hosting on their datacenters in UK, Stockholm and Karlskrona.
City Network architectures have considerable number of customers utilizing their services. Identifying and comparing the host and guest CPU utilization will be of great value in these operational clouds for better customer service and load balancing [21].
The VMs in the clouds are provided with IP addresses, firewalls and other network functions to enable interconnection between various other VMs. This is called as cloud networking and is important, as the user should be able to access his VM
Chapter 3. Methodology and underlying technology 11 from anywhere else. Cloud networking also provides security for these services that are provided over the global infrastructure, meaning, federated cloud infras-tructure that comprises of various other cloud architectures. Cloud Networking is of two types- CEN and CBN.
CEN is Cloud Enabled Networking where management is moved to cloud but the other networking components like routing and switching are in the network hardware [22,23].
CBN is Cloud Based Networking where control and management including the network components and functions are moved to cloud. The network hardware is still used for connecting the physical devices [22,23].
OpenStack is open source software and tools used for providing IaaS. It is used to build and manage a cloud-computing environment. The basic architecture con-tains two or three nodes, which will run different services as it is needed. In two nodes architecture network services will move in compute node.
Controller or cloud controller is the device that controls or manages other Open-Stack components and services. This provides central managements system for the OpenStack infrastructure-as-a-service deployments. Controller of-fers many services, namely, authentication and authorization, databases, dashboard and image services. Mostly single node as a controller is used in cloud platform but for high availability two or more controller node is needed [24].
Compute in OpenStack is called by its project name – Nova. The compute node, by the name itself, is the device or node that hosts virtual instances, thus providing IaaS. Nova comes with OpenStack software components and APIs but does not have any virtualization software of its own, but instead is configured to use the existing virtualization mechanism through interfaces and drivers. Its main components include object storage component called as swift and block storage component called as cinder that provide storage services [25].
Networking aims at providing network services to the instances and enables communication between the compute nodes. It is not necessary to have a separate node for networking and one of the compute nodes can be utilized for the this purpose [26].
OpenStack’s core components on each node pictured in figure 3.3. Telemetry management is the only optional service is shown in the figure 3.3. That is used to monitor the OpenStack cloud for billing, statistical purposes and scalability. Telemetry agent in the compute node collects data based on its metric. It has different types of agent to collect data. It is not providing a full billing solution but able to show resource usage per user and tenant. The data that telemetry agent reported from compute node for CPU utilization is based on CPU time not
Chapter 3. Methodology and underlying technology 12
Figure 3.3: OpenStack conceptual architecture model [26] Processor RAM Hard disk Controller node 1 2GB 5GB
Compute node 1 2GB 10GB Network node 1 512MB 5GB
Table 3.1: Minimum hardware requirement for OpenStack nodes[26] workload [27,28,29].
Hardware required is dependent on number of instances and type of services. In table 3.1 minimum requirement for small cloud platform is listed. [9]
3.2
Methodology
We did some literature review to get insight about different methods and design our methodology. In this thesis we focus on CPU utilization as a metric for re-source management and its influences on relationship between host and guest. Experimental research is selected as a methodology to achieve our aim.
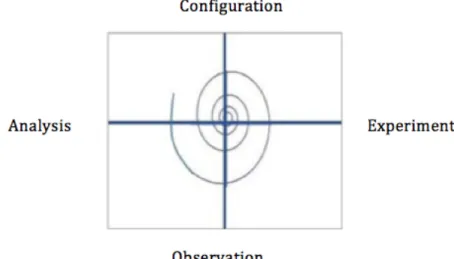
Figure 3.4 shows spiral model used in our experimental research. We start from basic configuration and run experiment. According to our observation and
anal-Chapter 3. Methodology and underlying technology 13 ysis the result, increase complexity of configuration and continue the process.
As the purpose of this thesis is to find relationship of CPU utilization between
Figure 3.4: Spiral model
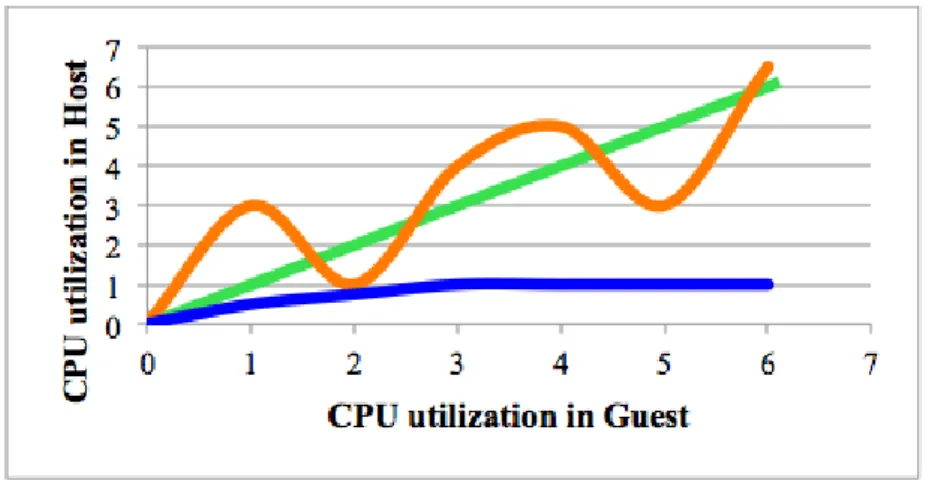
host and guest, we need to have an efficient method for analyzing the result. Vi-sual Correlation, VC, of objects is an important approach, which is used to make a decision of different processes. VC has two major concepts:
• VC as a result of visualization of objects or events correlation • VC as a process of correlating objects or events visually [31].
In this thesis we are using visual correlation as a process of correlating objects visually, which is presented by scatter plot. It is provide visual relationship be-tween two groups of variables both collected from host and from VM in a single VC to evaluate linear or non-linear and strength of relationship between CPU utilization in host and guest [31,32]. As shown in the figure 3.5, the relation-ship between host and guest can be linear, exponential or curvy. Our purpose is to identify type of relation from scatter plot and used mathematical method to analysis behavior numerically. We selected bivariate analysis for determining empirical relationship of dependent variable, guest, from independent variable, host [33]. Correlation coefficient (ρ) value is used in a case of linear relationship to identify the strength of association. Correlation coefficient (ρ) is calculated by following formula:
ρ(H,G) =
cov(H, G) σHσG
Chapter 3. Methodology and underlying technology 14
Figure 3.5: Possible correlation model between host and guest
where: cov(H, G) = P (H − H)(G − G) n (3.2) H: host G: guest cov: covariance
σH: Standard deviation of host
σG: Standard deviation of guest
3.2.1
Measurement tools
In a cloud infrastructure multiple factors can play vital role to generate workload on a system and use computational resources. Effective factors are shown in the figure 3.6 can be from different dimensions like virtualization, server and network side. Some of the important parameters in each side are shown in the figure 3.6[34]. In this study our consideration is on server and virtualization dimension to observe CPU utilization in physical and virtual server.
We are using experimental research for measuring CPU utilization in host and guest to identify how these values are related to each other. There are multiple standard tools, which are available for system performance. The selected tools for this research study are explained in this chapter.
CPU utilization is denoted by the amount of time a CPU is busy for handling work during a specific interval and it is reported as a percentage. It can be cal-culated as a time CPU is idle or the time CPU is running user-level application or system-level threads for each processor [35]. CPU utilization is calculated by
Chapter 3. Methodology and underlying technology 15
Figure 3.6: Three dimension of effective fuctors[34]
dividing CPU time cycle and time interval. Each tool applies its own sampling method in calculation and may not necessarily be a similar sample with others and investigating the sampling method is beyond the scope of this thesis.
Two groups of tools are used in this thesis that are divided based on their func-tionality. First group reports system performance that is called data collector and will explain briefly in section 3.2.1.1. Second group generate workload in a system that is called load generator and it will describe in the section 3.2.2.2. 3.2.1.1 Data collector tools
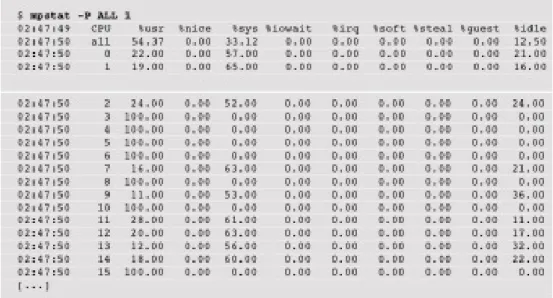
In this study we plan to use well-known tools, which are widely used in tradi-tional system to provide a simple approach for cloud computing service providers. • MPSTAT is a statistic tool that reports CPU utilization for each core and the average of all CPU utilization based on user and kernel time. The range for calculating average is set while running command as an option. The sample of its output shows in the picture 3.7. In our thesis we use “mpstat –P ALL 1 300” that is showing utilization for all CPU cores and it is collecting data every second till 300 seconds. [36]
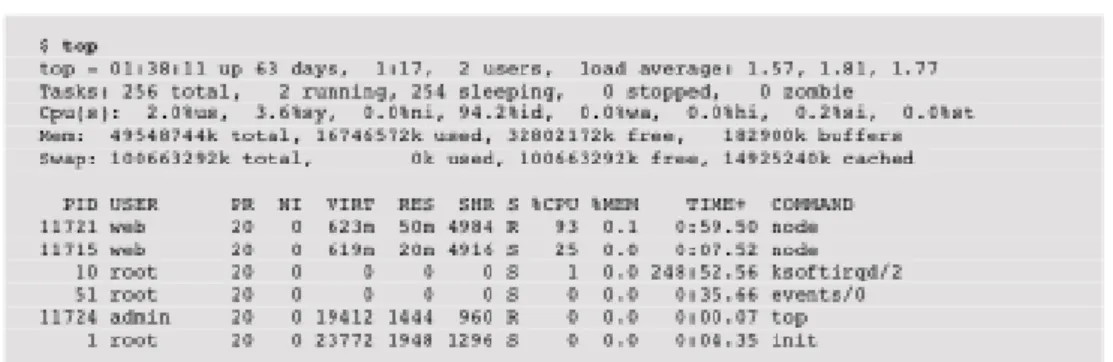
• TOP is another popular tool for monitoring processes that are currently running. This command identifies the system-side resource usage and presents it on the CLI. System-wide resource usage includes CPU Load average, CPU utilization, system, nice, idle waiting, hardware interrupt, software interrupt and stealing levels [37,38]. These metrics are similar to that of the columns
Chapter 3. Methodology and underlying technology 16
Figure 3.7: Sample output of mpstat in CLI
presented in mpstat. Top presents the mean of all the CPUs available. Top is widely used by performance beginners due to its features. Even though many accept it, it has a disadvantage to it that it puts considerable amount of load on the CPU. It is evident from figure 3.8 that, when top command is run, the terminal shows a process named top under the %usr column. This shows that top itself runs as a process and imposes extra load on the CPU and is not favored in performance experimentations. Moreover, top also eliminated short-lived processes and does not show the CPU uti-lization of these processes [39].
Top is the old command line tools that is installed by default in all Linux distribution system which is collected CPU usage of all available core and report the average every 3 seconds by default. It is possible to change this period by adding value in seconds after “-d” while running top command. In our thesis we collect the average CPU utilization every second [37,38]. These tools are selected for evaluating CPU utilization after deep study about their advantage and disadvantages. Top is old and well-known per-formance tool that is used by other perper-formance monitoring applications like Nagios[40] therefore it will be helpful to compare the effect of different sampling algorithm to see average CPU utilization in a system.
3.2.1.2 Load generator tools
To evaluate CPU utilization we need to create same workload multiple times during our experiments to simulate the load on the system in real life. In this section we describe popular [41]and standard tools that are available
Chapter 3. Methodology and underlying technology 17
Figure 3.8: Sample output of top in CLI in Linux repository.
• Stress is a widely used tool in performance tests and it stresses the CPU literally [41]. It has many options to provide customization in cores, mem-ory and time etc. In our experimentation, we have used stress for loading VCPUs for an interval of 5 minutes. Scripts for running top and mpstat commands are written to performing them in 5 minutes interval during the time loading VCPUs by stress command. Among the available options of stress, we used “-c” for increasing the number of CPUs you want stress or load. So, if you are using stress in VMs, the number of CPUs will be the number of VCPUs stressed and “-c” is for increasing the number of CPUs that you wish to be stressed [42,43].
• Stress-ng is new generation of stress tool, which is developed to provide new features. It is designed to stress computer system in various selectable ways to trip hardware issues as well as operating system bugs. In a term of CPU load it has a option “-l” which is given followed by percentage of load that you wish to impose on the CPUs while with stress, it is not possible to apply a fine-grain load [44].
3.3
Modeling
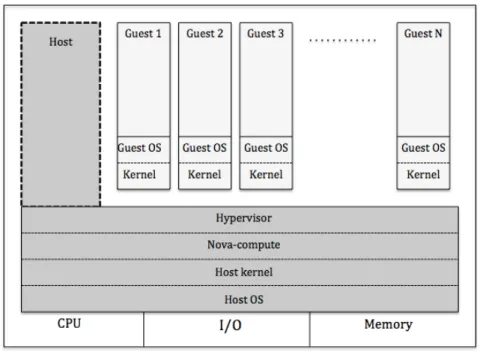
This chapter will describe our conceptual model that is used for measurement. We will model service provider in cloud based on OpenStack to investigate associa-tion of physical and virtual machine in term of CPU utilizaassocia-tion. As we menassocia-tioned about OpenStack node architecture in section 3.1.3, compute node provide the provision for virtual instances and the number of compute node is vary depend on service provider needs. Figure 3.9 shows the sample of OpenStack architecture and Networking part is omitted as it is beyond the scope in this thesis.
Chapter 3. Methodology and underlying technology 18
Figure 3.9: OpenStack node architecture model
node will be the host of multiple virtual machines need to have a virtual machine monitor, VMM, that is called hypervisor. In our scenario we used type 2 hyper-visor, which is followed host kernel scheduler for assign the task to computational resources. As it is shown in the figure 3.10 , compute node is similar to type 2 virtualization system while it has nova-compute agent which is not included any virtualization software. Nova-compute create a drivers for interacting with underlying virtualization techniques on host OS and provides communication via web API [25]. Our hypothesis is that a simple virtualization system will act
sim-Figure 3.10: OpenStack compute node - conceptual model
Chapter 3. Methodology and underlying technology 19 model to perform experiment and will create similar scenario in OpenStack com-pute node and standalone system as a basic configuration to compare the result. If the result support our hypothesis then will continue complex configuration in standalone system. The reason for creating similar model as OpenStack compute node is the complexity of collecting data from virtual machines in operational node and isolating of test environments from other services are running on oper-ational nodes.
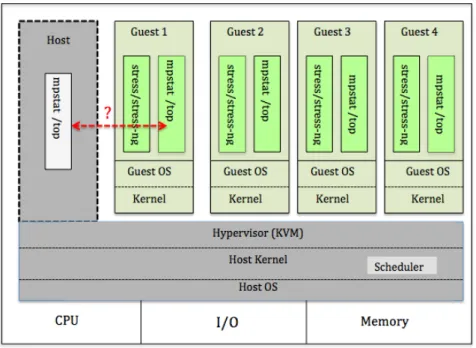
The aim of this study is to identify relationship between CPU utilization in host and guests. We are using measurement tools for generating load and collecting re-spective data from host and guest. Multiple scenarios and tools are used to define the association, which is illustrated in figure 3.11 to explain how customer’s view is related to service provider’s view. As KVM is type 2 hypervisor and it is
run-Figure 3.11: Experimental model
ning as a normal program inside a normal OS and each guest runs as a process in the host OS that can be manipulated like other processes. OS scheduling is done by kernel and our hypothesis lead to have a similar manner in different kernel version in Linux distribution system. Ubuntu and centOS are most used as a host operating system in cloud infrastructure is chosen to examine our hypothesis.
3.4
General experiment setup
The experimental setup for analyzing CPU utilization of the host and guest sys-tem is discussed in detail in this section. The setup focuses on two main
condi-Chapter 3. Methodology and underlying technology 20 tions. One experimental system has OpenStack installed on it while the other system does not consist of any orchestration like OpenStack. The test cases along with pictorial representation are provided below.
3.4.1
OpenStack test case
This experiment performed in one of OpenStack compute node in City Network Hosting AB infrastructure. Table 3.2 presented the specification of a node that is used as a host in our experiments.
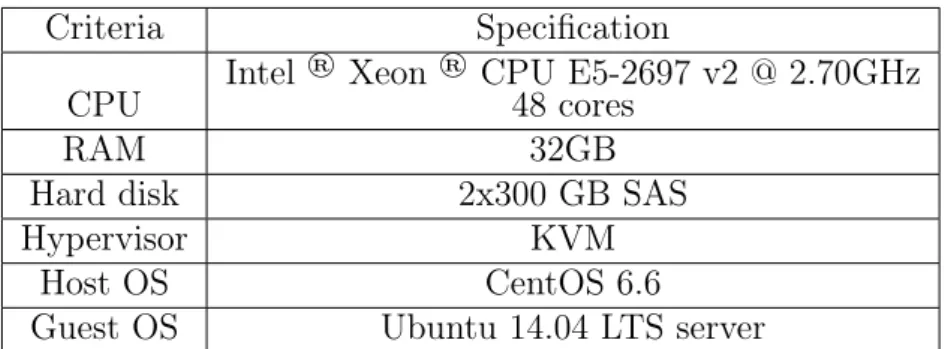
I First of all, four VMs are created on centOS node. All the four VMs are of Criteria Specification
CPU Intel
® Xeon ® CPU E5-2697 v2 @ 2.70GHz
48 cores
RAM 32GB
Hard disk 2x300 GB SAS
Hypervisor KVM
Host OS CentOS 6.6
Guest OS Ubuntu 14.04 LTS server
Table 3.2: Specifications of the OpenStack Compute Node used for experiments Ubuntu 14.04 server and each VM has 2 VCPUs allotted. Stress tool is used for the purpose of performance testing and the CPU utilization data is collected from host machine.
Now, we move on further to stress test the VMs and collect the CPU utilization data from host at the same time to understand the performance. It is ensured that no unwanted load is imposed on the VMs or host. Hence, there is no other application running or installed on the guests or host during experiment, which would impose a certain amount of load on them. This is important while running stress tests and that CPU is utilized for no other reason than stress.
The four guests present on the host are running during the time the experiments are carried out. As it is shown in figure 3.12, stress tool is run on 1 VM for 5 minutes. Since, each VM is allocated with 2 VCPUs, stressing 1 VM means that 2 VCPUs have load on them. During this process, other VMs are still running. The stress command is given the option to stress 2 VCPUs and mpstat command is run on the host machine to collect the overall average of CPU utilization on host.
Now, similar experiment is run for two guests. Hence, 2 VMs with 4 VCPUs in total are stressed. This means that these 2 VMs are 100% utilized and we collected the CPU utilization on CentOS host using mpstat command.
Chapter 3. Methodology and underlying technology 21
(a) step 1 - generate load on 1VM with stress
(b) step 2 - generate load on 2VM with stress
(c) step 3 - generate load on 3VM with stress
(d) step 4 - generate load on 4VM with stress
Figure 3.12: Steps of load generating in experiment with stress tool After the 2 VMs stress testing, we further stress test 3 VMs in similar manner, making 3 VMs stressed completely and letting 1 VM be idle. The last test in this scenario is stressing all the 4 VMs and observing the CPU utilization of host.
Chapter 3. Methodology and underlying technology 22
3.4.2
Standalone test case
The experiments in this scenario are on a different setup which does not have OpenStack installed on it. This test setup is on a standalone device with only hypervisor but no OpenStack packages. This is chosen to compare the CPU uti-lization of host devices when OpenStack is both present and absent to support our hypothesis in section 3.3. The hardware and software components used in this test are presented in table 3.3.
Criteria Specification CPU Intel
® Xeon ® CPU EC-1230 v2 @ 3.30GHz
8 cores
RAM 8GB
Hard disk 500 GB SAS
Hypervisor KVM
Host OS CentOS 6.6
Guest OS Ubuntu 14.04 LTS server
Table 3.3: Specifications of the standalone system for experiments
KVM hypervisor is chosen for this implementation due to its compatibility with cloud computing and OpenStack. This is the hypervisor used by City Net-work as well for their compute nodes to host multiple virtual instances. KVM provisions Virtual machines based on CPUs. In this experiment, we created 4 guests and allocated 2 VCPUs to each guest. As stated, the CPU has 8 cores and each VM is assigned 2 VCPUs each. This assigning is based on KVM provisioning model, which is based on the CPUs cores[45]. This setup is clearly explained in section 3.3.
Now, for obtaining the CPU performance and behavior, stress tool is used for the purpose of stressing the VCPUs. Firstly, stress command is passed to generate 100% load on 1 guest – VM 1. Stress command is given with the option “-c” where we can state the number of VCPUs to be stressed; in this case it is 2 and the command is set to run for 5 min. Over this 5 min time, mpstat and top commands are utilized to collect CPU utilization values from the PM.
Secondly, similar experiment is run for 2 VMs, which implies that 4 VCPUs on total. Hence, the command is run on each VM with “-c” option set to 2 VCPUs. Once again, mpstat and top are used to collect CPU utilization from host.
The third step involved is for loading 2 VCPUs of 3 VMs each. To simplify, the stress command option “-c” followed by 2 is issued on VM 1, VM 2 and VM 3 and mpstat is run on the host machine to capture the CPU utilization values.
Chapter 3. Methodology and underlying technology 23 Lastly, this command is issued on all the four VMs, which means that all the assigned and available 8 VCPUs are stressed from 4 VMs. CPU utilization is collected all through the 5 min time period using mpstat command.The collected data is analyzed and the results are produced in the section4.
3.4.3
Single guest with stress
These experiments are also performed on similar setup as described in 3.4.2. The virtualization environment is setup with the help of KVM hypervisor without OpenStack packages. Rest of the configurations is just the same as shown in table 3.3. The peculiar thing in this scenario is, however, only the number of guest machines installed. This is different in the number of VMs installed, which is only one in this case. So, instead of 4 VMs like before, we have provisioned only 1 VM on KVM with 2 VCPUs while the rest of the 6 cores of physical CPU are left unassigned. This VM undergoes stress testing in different combinations of VCPUs and tools, which we discuss further in this section. The scenario is described in the figure 3.13.
Firstly, stress command is given along with the option “-c” for stressing 1 VCPU
Figure 3.13: Depiction of standalone device of experimental for Single guest on the existing VM for 5 min. then the CPU utilization is collected simultane-ously from the host and guest using mpstat and top. This model is chosen in order to understand CPU utilization of both host and guest since we are customizing the load based on VCPUs on the VM. Hence, out of the 2 VCPUs of VM, only 1 VCPU is stressed.Figure 3.14 clearly show the test description.
Chapter 3. Methodology and underlying technology 24 The second step is to apply load on 2VCPUs on the VM by giving the option “-c 2” with the stress command. Mpstat and top are repeated for 5 min on host and guest to gather CPU utilization.
Similarly, stress is now configured with “-c 3” option in order to put load on 3
(a) step 1- stress imposed on 1VCPU with stress
(b) step 2- stress imposed on 2VCPU with stress
(c) step 3- stress imposed on 3VCPU with stress
(d) step 4- stress imposed on more VCPU
Figure 3.14: Stages of imposed stress on VCPU in single guest
VCPUs on the VM. Even though the VM is assigned only 2 VCPUs, stressing 3 VCPUs is possible from stress command. So the CPU utilization values are collected from the guest and the PM to understand the CPU performance in a better manner.
Chapter 3. Methodology and underlying technology 25 used for loading 3 VCPUs from the VM. After this, the test is repeated for 4 VCPUs, 5, 6, 7 and 8 VCPUs one after the other in the same order incrementally. All these tests are conducted for 5 min each and we collect the CPU utilization information simultaneously from host and guest. The same tests are performed on both Ubuntu and CentOS host OS.
3.4.4
Single guest with stress-ng
In this test case, instead of stress command tool, a slightly updated version of stress called stress-ng is used. Stress-ng has a few benefits of its own over stress tool. One such benefit is being able to manipulate the amount of load implied with the help of option “-l”.
So, in this experiment, where the setup is just the same as section 3.4.3, stress-ng tool is used for customizistress-ng the percentage of load and CPUs. The tests are conducted as following.
The first experiment is as usual stressing 1 VCPU of the VM using stress-ng command. Stress-ng at first is passed with “-l” option of 10% load on 1 VCPU for 5 min along with mpstat and top running on host and guest during the run time. Later, this –l option is supplied with increased amount of load of 20% on the same VCPU. After the collection of utilization values using mpstat and top is finished and results are stores, the load is increased to 30%, 40%, 50% and finally 100% on this VCPU. The second experiment follows the same procedure as mentioned above but this time on 2 VCPUs. Hence, the load ranges from 10% to 50% and 100% using “-l” option while “-c ” option is given with 2 VCPUs. All these test combinations are run for 5 min like always, and the respective CPU utilization values are collected from the host and guest.
Now, the third stage is to stress 3 VCPUs with “-c” and once again increase load from 10% to 50% and at last 100%. After this, the number of VCPUs given is 4 with the same incrementing load percentage options. This is further repeated until the 7 VCPUs are tested for 10, 20, 30, 40, 50 and 100% load. Test method is describe in the figure 3.15.During all these tests are being run, the tools mpstat and top are used at the same time of the runs for collecting CPU utilization data.
Chapter 3. Methodology and underlying technology 26
Figure 3.15: Method to generate load om 1 or more VCPUs with 10, 20, 30, 40, 50 and 100% load by stress-ng
Chapter 4
Results and analysis
The observation of executing multiple scenarios, which is presented in section 3.4, will view in this section. Our basic configuration relied on comparing CPU uti-lization in OpenStack compute node and standalone test case to see the effect of OpenStack orchestration layer on CPU usage. The rest of experiments executed in a test case virtualized environment. Multiple scenarios created with combining tools, VMs and VCPUs to observe the level of CPU utilization on PM and VMs. Each experiment performed for 5 minutes with the 5 minutes gap between each test. Collected data stored in file system for producing graphs and analysis the observation.
All experimental scenarios run for 5 minutes with 10 times iteration. The first and last minutes of each run did not consider in result and analysis due to transient state and the result in middle 3 minutes has steady state. Average CPU utilization for whole PCPUs and VCPUs are used for generating plot and will consider in this chapter.
The results from different scenarios are presented in this chapter based on the test cases like OpenStack and standalone environment and tools that generated the load in VMs.
4.1
Results from OpenStack and standalone test
case
In this experiment, 1-4 VMs are stress tested and the CPU utilization values are collected from the OpenStack’s compute node and test device with KVM hypervisor. Before stressing the VMs, in order to determine the CPU performance of the compute node, mpstat is issued for 5 minutes. Then, VM 1 is stressed after a 5 minutes interval post termination of the previous mpstat command. Then the experiments are continued for rest of the VMs with an interval of 5 minutes between each run. The experment results are presented in the figure 4.1.
The x-axis in graph x is the time in seconds and y-axis represents percentage 27
Chapter 4. Results and analysis 28
(a) CPU utilization data collected from City Network’s compute node
(b) CPU utilization data collected from standalone virtualizition system
Figure 4.1: CPU utilization monitored in City Network’s compute node and standalone system for multiple number of VMs
Chapter 4. Results and analysis 29 of CPU utilization. We have already discussed in previous sections that mpstat provides CPU utilization based on CPU cores and also it has overall values. We selected interval of 1 second to calculate the average utilization on whole PCPU cores. The values are retrieved from running mpstat command for 5 minutes. To obtain stable result the utilization values of first 60 seconds and last 60 seconds are considered as warm up and are removed. Figure 4.1(a) displays the output of CPU utilization average of mpstat command run on city network’s compute node and figure 4.1(b) shows the average CPU utilization in test device, when none of the VMs are stressed, when 1 VM is stressed, 2 VMs, 3 VMs and 4 VMs are stressed. As 2VCPU assign to each VM, generating load on 1 VM means we fully utilized 2 CPU cores.
The result from experiments show that the CPU utilization in host increases by increasing the number of VMs. The graph follows a particular trend in both cases when the number of VMs being stressed is increased. Even though figure 4.1 (a) and figure 4.1 (b) follow similar trends in CPU utilization, we can observe that there is a difference in the CPU utilization values due to different number of available core in each PM. The standalone device has 8 CPU cores and 4 VMs with 2 VCPU allocated to each in. Therefore, CPU utilization values reach its maximum value - 100% in figure 4.1(a) while the maximum in figure 4.1 (b) is just 16%, where the CPU cores equals to 48.Figure 4.1 (a) shows much variation in comparison with figure 4.1 (b) that can be the effect of management services are running in OpenStack node. The result proves our hypothesis, which is stated in section 3.2.
These experiments observation leads us to follow our methodology for gaining relationship between host and guest CPU utilization in simplified model. The following sections will show incremental complexity in test case device.
4.2
Results of generating load with Stress
In this case, there is only 1 VM on the KVM and we stress the VCPUs using “-c” option of stress command on the VM. We stress 1 VCPU at first, 2 VCPUs next, and increase the number until 7 VCPUs. It should be noted that the VM was allocated with only 2 VCPUs and loading it to more than its capacity will lead to CPU saturation in VM. When we generated load more than 2VCPU correlation between guest and host reported similar values and hence we skipped the tests for 8 VCPUs.
The CPU utilization values are collected from both host and guest during each run. Figure 4.2 shows the correlation between host and guest utilization values for stressing 1VCPU in Ubuntu and centOS host. Figure 4.3 presented relation between host and guest CPU utilization while stressing 2VCPU for both host. X- axis shows the %CPU utilization in guest and y- axis shows %CPU utilization in host. As VM provisioned by 2VCPU, guest is reported 100% CPU utilization
Chapter 4. Results and analysis 30 for stressing 2VCPU. We increased the number of stressed VCPU to observe host behavior while guest CPU is in saturation state. Figure 4.4 and 4.5 presented the result for 3 and 7 VCPU respectively. We selected 3VCPU and 7VCPU plots as examples of CPU saturation in VM and the result of other saturation state are ignored due to similarity.
(a) Correlation between CPU utilization on Ubuntu host and guest
(b) Correlation between CPU utilization on centOS host and guest
Figure 4.2: Scatter plots of relation between average CPU utilization on host and guest while 1 VCPU stressed
Chapter 4. Results and analysis 31
(a) Correlation between CPU utilization on Ubuntu host and guest
(b) Correlation between CPU utilization on centOS host and guest
Figure 4.3: Scatter plots of relation between average CPU utilization on host and guest while 2 VCPU stressed
Chapter 4. Results and analysis 32
(a) Correlation between CPU utilization on Ubuntu host and guest
(b) Correlation between CPU utilization on centOS host and guest
Figure 4.4: Scatter plots of relation between average CPU utilization on host and guest while 3 VCPU stressed
Chapter 4. Results and analysis 33
(a) Correlation between CPU utilization on Ubuntu host and guest
(b) Correlation between CPU utilization on centOS host and guest
Figure 4.5: Scatter plots of relation between average CPU utilization on host and guest while 7 VCPU stressed
The graphs show shotgun scatters that are alignment of points in vertical po-sition, which is indicated as a very low correlation, while we applied full load on each virtual CPU. The average CPU utilization in guest is almost constant while host shows the narrow range in all plots while centOS host provide wider range.
Chapter 4. Results and analysis 34
4.3
Results of generating load with Stress-ng
This experiment was performed with stress-ng tool, which comes with the option of customizing workload. Stress-ng at first is used for stressing 1 VCPU of the VM with 10% load. Then the load is increased to 20%, 30%, 40%, 50% and finally to 100% in each experimental run. Then similar tests are performed with increasing the number of VCPUs in option “-c” and increasing load in option “-l” of stress-ng. Top and mpstat are used for collecting data from PM and VM in Ubuntu and centOS host.
4.3.1
Mpstat tool
The x- axis on the graphs represents average percentage of CPU utilization in guest while the y – axis represents the average percentage of CPU utilization in host. Plots show the relation between host and guest while applying fine-grain workload. The observation of 1,2, and 5 VCPU are presented in graphs and the rest plots are ignored due to similarity but the correlation coefficient for all experiments presented in table 4.1 and 4.2.
In figure 4.6 (a) the correlation for 10% and 20% load show shotgun scatter and lie on x-axis and y-axis which is random value and we could not find reason for such a behavior. In figure 4.6 (b) the correlation of 10% and 20% load are scattered and in most points lie on y-axis. Almost linear correlation observed for 30%, 40% and 50% load in figure 4.6 while shotgun scatter monitored for 100% load. As shown in figure 4.7 random value observed in a case of 10% and 20% load and 30%, 40% and 50% load tend to straight line with variation interval while CPU utilization for 100% load behave similar in all scenarios. Figure 4.8 shows almost positive correlation between host and guest for 10%-50% load.
Chapter 4. Results and analysis 35
(a) Correlation between CPU utilization on Ubuntu host and guest -stress-ng
(b) Correlation between CPU utilization on centOS host and guest -stress-ng
Figure 4.6: Scatter plots displaying the CPU utilization relation between host and guest in different load conditions for 1VCPU - mpstat tool
Chapter 4. Results and analysis 36
(a) Correlation between CPU utilization on Ubuntu host and guest -stress-ng
(b) Correlation between CPU utilization on centOS host and guest -stress-ng
Figure 4.7: Scatter plots displaying the CPU utilization relation between host and guest in different load conditions for 2VCPU - mpstat tool
Chapter 4. Results and analysis 37
(a) Correlation between CPU utilization on Ubuntu host and guest -stress-ng
(b) Correlation between CPU utilization on centOS host and guest -stress-ng
Figure 4.8: Scatter plots displaying the CPU utilization relation between host and guest in different load conditions for 5VCPU - mpstat tool
4.3.2
Top tool
Figure 4.9 presented relation between host and guest in different workload on 1 VCPU. We observed an alignment of points that lie on x-axis and y-axis for 10% and 20% load. Linear correlation is visible for 30%, 40%, 50% workload while it shows shotgun scatter for 100% load.
Chapter 4. Results and analysis 38
(a) Correlation between CPU utilization on Ubuntu host and guest -stress-ng
(b) Correlation between CPU utilization on centOS host and guest -stress-ng
Figure 4.9: Scatter plots displaying the CPU utilization relation between host and guest in different load conditions for 1VCPU - top tool
As shown in figure 4.10, multiple workloads produced on 2 VCPU. The middle grain 30%, 40%, and 50% displayed almost linear correlation. Random behavior is seen for 10% and 20% load and we do not have a good explanation for such a manner. 100% workload represented almost constant value, which is not let us to calculate correlation coefficient.
Chapter 4. Results and analysis 39
(a) Correlation between CPU utilization on Ubuntu host and guest -stress-ng
(b) Correlation between CPU utilization on centOS host and guest -stress-ng
Figure 4.10: Scatter plots displaying the CPU utilization relation between host and guest in different load conditions for 2VCPU - top tool
Figure 4.11 presented correlation between host and guest for 5 VCPU and shows increasing number of VCPU provides much variation on correlation. The CPU utilization is scattered and there is not possible to divide the zone between data from different workload.
Chapter 4. Results and analysis 40
(a) Correlation between CPU utilization on Ubuntu host and guest -stress-ng
(b) Correlation between CPU utilization on centOS host and guest -stress-ng
Figure 4.11: Scatter plots displaying the CPU utilization relation between host and guest in different load conditions for 5VCPU - top tool
4.4
Analysis
The visual correlation from scatter plots shows that there is some linearity when VM is loaded by variable workloads . We used the equation 3.1 to find correlation coefficient in order to have mathematical analysis and examine the strength in a case of linear correlation. The correlation coefficient is the value between -1 and
Chapter 4. Results and analysis 41 1. The values are close to the interval border shows highest association while the value close to zero has less correlation
The correlation coefficient value of centOS host is presented in table 4.1 and 4.2 by using mpstat and top as a data collector respectively. Table 4.3 and 4.4 show the correlation coefficient of CPU utilization in Ubuntu host obtained from mpstat and top tools. The correlation coefficient formula is not applicable while related data is constant and it is observed when VCPUs are utilized and over utilized.
1 VCPU 2 VCPUs 3 VCPUs 4 VCPUs 5 VCPUs 6 VCPUs 7 VCPUs 10% -0,2721 -0,5436 -0,4021 -0,0094 -0,3826 -0,3856 -0,4715 20% 0,2581 0,4172 0,4951 0,1968 0,2270 0,0355 -0,3149 30% -0,0582 -0,0564 -0,2133 0,0336 0,4727 0,3102 0,0670 40% -0,0943 0,2113 0,0909 0,2964 0,4536 0,2914 -0,0053 50% -0,2031 -0,0903 -0,0354 0,0570 -0,1400 0,5437 0,4675
100% -0,1944 NA* NA* NA* NA* NA* NA*
Table 4.1: Correlation coefficient between centOS host and guest- Load generator stress-ng, mpstat tool
NA*- Not Applicable
1 VCPU 2 VCPUs 3 VCPUs 4 VCPUs 5 VCPUs 6 VCPUs 7 VCPUs 10% 0,2885 0,5558 0,0568 0,4271 -0,0048 0,1259 0,2393 20% 0,0476 -0,4721 -0,1915 0,4622 0,0499 0,1010 0,1954 30% -0,0466 0,0234 -0,1113 0,0575 -0,0658 -0,0494 0,3153 40% 0,0421 -0,0070 0,2026 0,3882 0,1713 -0,0701 0,0239 50% 0,0951 0,1857 0,2899 -0,0403 0,1098 0,0563 -0,3484
100% 0,3526 NA* NA* NA* NA* NA* NA*
Table 4.2: Correlation coefficient between centOS host and guest- Load generator stress-ng, top tool
NA*- Not Applicable
In all combinations we observed when VCPUs is fully loaded, 100%, VM re-ported constant value while PM showed little changes accordingly and could not show any association value. Both data collector tools, mpstat and top have a similar result in term of correlation coefficient. In overall the strength of asso-ciation is low in most cases and medium in some combinations. The correlation coefficient values are not showing any trend related to increase or decrease the workload and number of VCPUs. The highest value in most cases is visible while
Chapter 4. Results and analysis 42 10% load generated in the VM due to distorted points.
1 VCPU 2 VCPUs 3 VCPUs 4 VCPUs 5 VCPUs 6 VCPUs 7 VCPUs 10% -0,4663 -0,4807 -0,4629 0,0906 -0,5337 -0,0800 -0,4977 20% 0,1655 -0,0049 0,2893 -0,0827 0,1650 -0,3145 0,2066 30% 0,2392 -0,0727 -0,0087 0,1175 0,4692 0,2298 -0,0474 40% -0,1684 -0,2900 0,3238 -0,0320 0,4812 0,2597 0,4561 50% 0,0735 -0,2154 0,1395 0,0864 0,2525 -0,1736 0,4919
100% -0,0710 NA* NA* NA* NA* NA* NA*
Table 4.3: Correlation coefficient between Ubuntu host and guest- Load generator stress-ng, mpstat tool
NA*- Not Applicable
1 VCPU 2 VCPUs 3 VCPUs 4 VCPUs 5 VCPUs 6 VCPUs 7 VCPUs 10% -0,4970 -0,2002 -0,5542 -0,2806 -0,4720 -0,2972 -0,3812 20% 0,2797 0,1438 -0,1422 0,2111 0,0737 -0,0738 -0,0070 30% 0,0780 -0,1824 -0,2074 0,0048 0,2387 0,1177 -0,4314 40% -0,0076 0,1653 -0,1919 -0,0532 -0,1191 -0,1619 -0,3275 50% 0,3795 0,2213 0,0935 0,0900 -0,1166 -0,0610 -0,4951
100% 0,1626 NA* NA* NA* NA* NA* NA*
Table 4.4: Correlation coefficient between Ubuntu host and guest- Load generator stress-ng, top tool
NA*- Not Applicable
These irregularities in the graphs can either be due to an unknown inter-nal characteristic of the tools that needs further investigation or incorrectness in measurements that can be solved with reiterations. However, this thesis has its focus on methods to understand CPU utilization relationships only, which we have achieved successfully.
Validity threats prevalent in a research design are internal and external threats that need to be handled. Internal validity covers the cause-effect aspects, meaning that a result is caused due to change in a particular variable. External validity focuses on applicability of the results to other environments [46]. In our thesis both these threats are addressed by understanding experimental design and10 iterations per experiment in various scenarios like VMs, VCPUs, OS respectively.
Chapter 5
Conclusions and Future Work
5.1
Conclusions
We have provided a visual correlation analysis between host and guest CPU uti-lization after performing experiments is multiple scenarios. We conclude our thesis work in this chapter.
5.1.1
Multi guests
CPU utilization behavior is observed in the case where multiple guests share the hardware resources. We deduce from the results that CPU utilization behaves the way it should when the guests are stressed to 100%. The difference in utilization values however is due to the difference in physical CPU cores of compute node and normal virtualization system. We understand that similar methodology can be implemented in both cloud infrastructures and virtualization devices. In this model, we assigned equal amount of CPU resources to the VMs and when the load on the VMs reaches the maximum, the CPU becomes saturated.
5.1.2
single guest
In this scenario we have only 1 guest and stress it with different percentage of loads and also VCPUs. We cannot actually find a proper correlation between the host and guest CPU utilization and we can notice that there is a visible gap. Performance in cloud computing is very important and plays major role in assigning efficient resources to the cloud customers and billing them accordingly. When a guest tries to utilize more resources than what he is paying for, it is important to know the effect on host machine.
We expect that Utilization in host keep its threshold and don’t let guest to use more resources but it is observable when guest’s CPU is saturated we see more utilization in host and it is different in Ubuntu and centos. Ubuntu host shows much restriction on resource usage and the correlation shows narrow limitation when load is generated for 2-7 VCPU while centOS reported wider range.
Chapter 5. Conclusions and Future Work 44 On the whole, there is slight correlation between host and guest CPU utilization when they are completely utilized. The plots are more scattered when the load is less than 100% and we cannot see a proper trend in them. Investigating the mechanisms for obtaining CPU utilization is out of scope for this thesis. We cannot actually extrapolate and interpolate from host to guest values or vice-versa. We suggest that network administrator should be more careful about the performance.
5.2
Future work
In virtualization systems, both hypervisor and guest OS offer scheduling resulting and this double scheduling deteriorate the performance problem in the system. Instead, dynamic assignment of VCPUs to the VM based on its need as well as available PCPUs is beneficial [47]. Our research concentrated on identifying CPU behavior when more than allocated resources are stressed and directing this study to dynamic assignment of computational resources is indeed compelling and can be considered as future work.
![Figure 3.1: Hardware virtualization - Type1 Hypervisor[15]](https://thumb-eu.123doks.com/thumbv2/5dokorg/5430854.140098/19.892.262.632.169.454/figure-hardware-virtualization-type-hypervisor.webp)
![Figure 3.3: OpenStack conceptual architecture model [26]](https://thumb-eu.123doks.com/thumbv2/5dokorg/5430854.140098/22.892.179.719.191.563/figure-openstack-conceptual-architecture-model.webp)
![Figure 3.6: Three dimension of effective fuctors[34]](https://thumb-eu.123doks.com/thumbv2/5dokorg/5430854.140098/25.892.203.684.203.469/figure-three-dimension-of-effective-fuctors.webp)