K2 WORKING PAPER 2019:6
Penalties as incentives for punctuality
and regularity in tendered Swedish
public transport
Roger PyddokeDate: June 2019
Table of contents
Preface ... 3
Abstract ... 4
1. Introduction ... 4
1.1. Literature ... 5
2. Theory and hypotheses ... 8
3. Data ... 10 4. Observations ... 11 4.1. Design of incentives ... 11 4.2. Monitoring of outcomes ... 13 4.2.1. Analysis ... 14 4.3. Charging ... 14 4.4. Outcomes ... 15 4.5. Customer satisfaction ... 18 5. Discussion ... 20 6. Conclusions ... 22 Declaration of interest ... 23 Acknowledgements ... 23 References ... 24
Preface
This study is the third part of the larger project Incentives and Evaluation for Improved
Public Transport. The study has been conduted by VTI with funding from and in
collaboration with K2 - The Swedish Knowledge Centre for Public Transport. The author is grateful to Skånetrafiken and Trafikförvaltningen in Region Stockholm, for their cooperation and for providing data. The paper also benefited from discussions with and comments from Isak Jarlebring Rubensson, the procurement groups of the bus operators, participants at a presentation at VTI, and Transportforum 2019 in Linköping
Stockholm, June 2019
Roger Pyddoke
Abstract
Swedish public transport authorities emphasize that quality of service and customer satisfaction are important goals. For this purpose, tendered public transport contracts are frequently given quality incentives in the form penalties for failure to deliver desired quality. This paper studies penalty design for cancellations and delays, stated design motivations, performance monitoring and consistency in charging of penalties. The study also presents some evidence on how outcomes have evolved. Two main design forms are found, either charges for individual deviations or for deviations from an aggregate target level. Little motivation is found in the form of narrated or documented experience of penalty design and the outcomes the design of particular incentives. Deviations are monitored regularly by contract managers, based on computerized data capture. There appears to be no records of charging in the form of data series making it possible to trace the chain from outcomes to reductions in invoices. There are indications of non-negligible exemptions from charges attributed to factors beyond the control of operators. The current level of delivered departures is high and for both RPTAs but shows no trend. The aggregate level punctuality appears to be decreasing at both the RPTAs, but only statistically significant for one. The picture is complicated by the fact that punctuality develops differently in different parts of the region. This suggests that recent adjustments in the design of penalties may have had little impact on these quality dimensions.
Keywords: incentive, penalty, quality, customer satisfaction, design, monitoring, outcomes,
1. Introduction
In Sweden continuously improving the quality of local public transport as perceived by the travelers is a central goal (Pyddoke and Swärdh 2017). This goal is frequently operationalized by measures of customer satisfaction. As most local public transport is tendered, this has led to varying provisions taken by regional public transport authorities (RPTA) to ensure objective and perceived quality in the contracts with operators. A frequent form of such provisions are penalties and bonuses for customer satisfaction. Some RPTAs also direct penalties and bonuses at cancelled or delayed departures. Such penalties and bonuses have been a long-standing part of public transport contracting (Hensher and Wallis 2005) and, at least in Sweden, are considered as indispensable to ensure quality outcomes.
But do the current forms of quality incentives as penalties perform well? Theoretically precise penalties and bonuses adjusted to take account of the value of the potential improvement would give operators incentives to take desired actions. But in practice there are a multitude of possible deviations from the theoretical ideals. For psychological reasons there are reasons to believe that agents do not respond symmetrically to penalties and bonuses (Tversky and Kahneman 1991). This theory has also been applied to contract analysis (eg. Bigoni et al. 2014). If the ability to monitor and classify the causes of quality flaws varies between instances, then the incentives may be skewed. As there are concerns that operators should not be burdened with risks which they cannot efficiently influence, there are practices involving contract managers (the employees at the RPTAs directly responsible for monitoring the performance of the operator and for supervising the payments) excluding instances from charging. For these and other reasons, the actual quality outcomes may be smaller than ideally and therefore there is reason to examine how the management of penalties affects outcomes.
The aim of this paper is to analyze how penalties for cancelled and delayed departures
are designed in Swedish local public transport contracts and what these designs are expected to achieve, how the outcomes are monitored, to which extent observed flaws, as
defined in contracts, are actually charged and what the outcomes in the quality
dimensions associated with penalties have been. A further aim is to explore the possibilities for a larger, more systematic study of effects of quality incentives. This study
is limited to penalties for cancellations and delays in contracts for bus services in Stockholm and Skåne region’s tendered by their RPTAs. Tthis project does not aim at performing anything like an audit of neither individual employees nor the individual RPTA. Therefore, employees and RPTAs are anonymized.
This study is based on interviews with 10 employees at two RPTAs, Skånetrafiken and Trafikförvalt-ningen Region Stockholm, and was discussed at a meeting with The Swedish Bus and Coach Federation (Sveriges bussföretag). These interviews represent different levels in the respective organization from contract managers (employees directly responsible for monitoring and approving reported production and quality failures), over their superiors to top management in charge of purchasing in one of the RPTAs and
contract managers and employees in charge of development purchasing strategies in the second organization. This selection does not necessarily represent all relevant knowledge roles in the respective organizations. Employees at the RPTAs also provided documents: parts of contracts and monitoring documentation. In addition, further statistical information has been collected from open sources. Although Sweden has an open access constitution, many documents were not made available, and it remains an open question if, and to what degree, such documents should be made public.
1.1. Literature
There are three strands of theory relevant to the issue of quality penalties in contracts. First there is general economic contract theory. An early discussion of contract compensation for deficient delivery of quality can be found in Shavell (1980). Surveys of contract theory can be found in (e.g. Hart and Holmström 1987, Nobel prize 2016) The contracting literature suggests several hypotheses. Firstly, the contract should be informed by a clear picture of both the buyer’s and the agent’s goals and preferences. Secondly, the contract should reward outcomes that can be affected by the agent. These rewards should also ideally balance the interest of giving the agent incentives with the interest of insuring the agent against unfavourable outcomes of external factors influencing the results. Thirdly, the contract should not give strong incentives for easily observable outcomes at the cost of weak or no incentives for outcomes that are harder to observe but equally important.
The first principle involves being clear about to what extent the public transport wanted by political decision makers can be expected to cover its costs by fare revenues, and to what extents there will have to be subsidies.
The second principle above implies that risks should be carried by the party that has the best ability to influence or bear the risk (Stanley and van de Velde 2008). A first implication of this principle is that the operator can and should be made responsible for the deficiencies in its services that it can influence, e.g. due to lack of training of personnel or maintenance of buses. A second implication is that risks to the operator due to decisions taken by the public sector, e.g. changes in public parking policies, road pricing, road works, all affecting the speed in roads and therefore the choice to use public transport, should not influence the payment to bus operators.
A related issue concerns the choice between carrots and sticks as exemplified by studies by Fehr and Schmidt (2004 and 2007). The carrot and sticks literature suggest that in contracts with uncontactable performance between private parties, voluntary bonus payments by principals outperform penalties. Unfortunately, this is hard to reconcile with public procurement legislation, as this leaves little discretion for public employees to make such further payments. A second issue concerns how quality can be assured in the procurement process by weighing in quality dimensions in evaluation of bids (e.g. von Ungern-Sternberg, 1994 and Bergman, M. and Lundberg, S., 2013).A third theoretical idea is to gather information on current performance and using it in upcoming procurements – past performance rating presented by Dellarocas et al. (2006). Spagnolo (2012) points to how difficulties in proving to courts that the seller did not deliver in accordance with contract or similarly high costs to negotiate compensation from the seller is likely to lead to an absence of attempts to enforce contracts, in public contracting. Spagnolo (2012) cites a government audition indicating that Italian procurers only charged about 3 percent of major non-conformities to contracts. A further mechanism, Spagnolo therefore argues, is that “complementing explicit contracts with reputational mechanisms based on ex-post evaluations of contractor performance may improve the governance of procurement transactions”.
Bigoni et al. (2014) present the outcomes from of a series of contract experiments testing the effects of incentives framed either as bonuses or fines in the presence of both contractible and non-contractible performance and repeated interactions between agents. The results are that explicit incentives strongly increase overall effort and surplus. Absence of incentives led to lower levels of effort in both contractible and non-contractible dimensions. The net effect of explicit incentives on non-non-contractible effort was slight reduction compared to no incentives. Furthermore, the paper presents indications that results are better for buyers with penalties than with bonuses.
In the management of such contracts, the use of performance incentives must rely on buyers collecting and managing performance information. The previous literature on contracting in public transport focussed mainly on how to establish good working relationships and improving the clarity of contracts (e.g. Hensher and Stanley 2010). Several studies have noted the presence of quality incentives (eg. Hensher and Wallis 2005 and Rye and Wretstrand 2014) but little in terms of analysis of the use of data for management has been published. Examples of studies examining the effects of contract form on quality are (Amaral et al. 2009) and Ida et al. (2018) finding that gross cost contracts amended with quality incentives delivered higher quality than net cost contracts. There are few previous empirical studies analyzing the effects of penalties and bonuses on quality outcomes in public transport contracts. Jansson and Pyddoke (2010) present a case study with data from a small number of cases of introduction of quality incentives. The results do not allow for generalization, but the contradictory findings suggest small or inconsistent effects from the observed cases. The authors conjecture that these findings may be due to incentives being too small to induce the desired actions. The notion that incentives in public transport may be too small to have effects has later been confirmed for ridership incentives by Pyddoke and Swärdh (2017), Wika Haraldsen and Norheim (2018) and Vigren and Pyddoke (2019).
Later studies also find inconsistent outcomes of fines and bonuses to outcomes. Gomez-Lobo and Briones (2014) point to the lack of low-cost technologies in public transport being a barrier to monitoring and therefore of contract enforcement. On the other hand, with low cost monitoring, quality may improve.
In Sweden RPTAs appear to be increasingly interested in investing in new technologies for monitoring travel and occupancy in public transport vehicles and for getting more reliable information of the precise movements along routes. With costs decreasing for such reliable data, it may be expected for RPTAs to increasingly engage in the active use of such data.
Pyddoke and Lindgren (2018) compared outcomes in four cases with two types of public transport contracts, gross cost contracts including quality penalties to a “strong incentive” contract with payments almost completely tied to the number of boarding passengers also including quality penalties. The authors conclude that quality increased over time but that the average differences were only a bit better in the strong incentive contracts than in the gross cost contracts.
One of few examples of empirical analysis of the effect of using quality outcomes in procurement is a recent paper by Decarolis et al. (2016), which examines the use of past performance data to form a performance index and using this in the awarding system in procurement. The authors show that such a system in the case of one buyer procuring large numbers of contracts had significant effects on compliance. The evidence, however, suggests that this has come at somewhat higher costs to the buyer.
Trafikanalys (2018) report on the application of incentives in tendered bus services in Sweden and the magnitude of incentive payments. In 2015 there were incentives for customer satisfaction in 9 percent and punctuality incentives in 4 percent of bus contracts. The study does not account for incentives for cancellations. Neither does it report separately on the amounts payed in bonuses and penalties per quality dimension.
To summarize, this literature suggests the following hypotheses. First, if the quality outcome is strongly influenced by factors beyond the operators control it is not likely that penalizing the loss of quality will have a strong effect. Second, if the observation of quality loss or factors beyond the operator’s control is costly, buyers are likely to skip on trying to prove that the operator was responsible and there is likely to be a gap between quality loss and penalty charging. Third, before experience has been gained about the valuation of quality loss and costs for avoidance, buyers are likely to both over- and underestimate the value of quality being delivered and the cost to do so. Therefore, early penalties tried are likely to be both too low and too high.
2. Theory and hypotheses
Economic welfare theory suggests two fundamental principles for guiding decisions on optimal quality. The first is that marginal expenditures at improving quality should be equal to marginal valuation of quality. The second, is that to the extent that failures to deliver departures and punctuality are random and that customers valuation of these failures are substantial valuation, of these failures should take account of the risk preferences of consumers and operators.
From a theoretical perspective it could be expected that management would seek to ground the design in the economic principles. If so, this would entail collecting data on the occurrence of cancelled and delayed departures. Possibly also the passengers’ perceptions of the frequency, inconvenience and valuation of the delays. It could also entail collecting information on the causes of individual quality deviations and the potential costs of using different strategies to reduce the causes of failures.
Placing penalties on cancellation and delays in contracts implies a belief that the operator can use measures that can prevent such failures with lower costs than the penalty cost. If this is so, the buyer (the RPTA) does not necessarily need to know the exact cost of the measures or their precise workings. The penalty may still deliver reduced delays. If on the other hand, important causes of delays are such that the operator has only little influence over the cause, the penalty is not likely to affect these causes. This study pursues the following hypotheses and expectations based on earlier studies.
First, as there is an ongoing evolution of the forms and sizes of penalties and bonuses, the expectation was that employees at the RPTAs could give an account for of the development of penalties. What were the expected effects of changing the design of penalties? The expectation was therefore to find oral narratives or written documentation explaining the reasons for the evolution of penalties. Second, we expected to find some documented analysis of long term and cross contractual analysis of the quality outcomes and their causes. Third, it was expected to find a chain of documentation from the observation of single quality deviations chargeable with penalties, over monthly compilations to a sum of deviations leading to a sum deductible from the operator’s invoice. Fourth, in accordance with earlier studies (e.g. Spagnolo 2012) and hearsay, we expected the charging of fines not to be complete. The main reason being that there are causes for cancelled departures and delays beyond the operator’s influence. Fifth, in accordance with earlier observations we expected total fine reductions to be small compared to total contract payments.
There is a further possible motive for publishing and making data on outcomes available. This is the potentially beneficial incentivizing effect from making good and bad outcomes known to the public. If RPTAs therefore want to be transparent about what performance is being delivered they can make more of outcome and payment flows easily available. Such data can also facilitate internal analyses and in future be used as a base for past performance rating. This data can also be tied to either penalties or bonuses, whatever
experience will show is the most appropriate. This paper aims at pointing to the kinds of data that is already being collected and some pieces of further information needed for improved evaluation of the workings of bonuses and penalties.
These principles also suggest what kinds of data would be needed.
Valuation of delays due to cancellations and late arrivals and other inconveniences. The marginal effects on the occurrences of delays from different causes.
The costs for reducing delays with different measures (e.g. better maintenance of vehicles, bus lanes, signal priority in road crossings).
3. Data
The data used in this paper comes from several sources. Today the two studied RPTAs, Skånetrafiken and Trafikförvaltningen i Region Stockholm, both use computers in buses to collect data on boarding passengers, ticket verifications, arrival and departure from stops, etc. Customer satisfaction, collected on a regular basis e.g. quarterly by separate surveys, have also been used.
In procured public transport both RPTAs manage contracts by summarizing outcomes on a monthly basis producing records of performance. These records are increasingly being saved but are generally not publicly available. We have received parts of recent documentation from all bus contracts in Skånetrafiken and documentation from one contract in 2012 from Trafikförvaltningen.
We have asked the audit organizations of each region if they have performed audits on the variables studied in this paper. Access to conducted audits was given and the reply was that audits had not been conducted at such a detailed level. This is confirmed by our reading of some of the relevant audits.
Contract texts are available in the form of published tendering documents where the contracts are presented. The finalized documents with prices per performance units are given are not always publicly accessible. Penalty payments per month have not been presented for individual penalties for individual contracts. The reason for this appears to be that these payments are not accounted for separately for each penalty and bonus type. It is important to remember that the definitions of cancelled and delayed departures may be different in different contracts. Interviews with officers at the RPTAs point to several consistency problems with data reducing the validity of comparisons over time in contract areas and between contract areas and RPTAs. The first is that the definitions of cancelled departures and delays change over time and can even differ between contracts. The design of one of the customer satisfaction surveys has also changed recently. Furthermore, the response rates to surveys has been declining, raising doubts about the comparability of measures over time. This paper therefore refrains from comparing outcomes between RPTAs and contracts. It does however compare outcomes over contracts within RPTAs, while explicitly stating qualification these comparisons assume unchanged definitions delivered and punctual departures.
4. Observations
4.1. Design of incentives
When seeking early references to aims and justifications for the design of quality incentives in general and penalties in particular, very little has been found. That such consultancy studies exist is known for a fact as they are referenced in Jansson and Pyddoke (2010) (e.g. Jansson 2004 and Jansson and Pyddoke 2007). These studies however appear to lie too far back in time to be known. It appears likely that there have also been later analyses of the effects of quality incentives that have been carried out. When asking for such examples, employees claim that they exist, but no examples have been produced.
The perspective of individual senior employees stretches at most about ten years back in time. The story told at both RPTAs involves a past where the design and charging of penalties was less strict than current practice. One official goes as far as saying that “we wanted a friendly relationship with the operators”, meaning that penalties were often arbitrarily reduced. After this, the officials state that the RPTA has sharpened its ambition of achieving goals and application of contracts. This is said to involve a stricter charging of penalties.
The stricter charging of penalties is said by one of the RPTAs to have been met with some
dissatisfaction from operators and consequently more questioning of the data sources used by the RPTA. One of the lessons learned from this experience is therefore that good quality data from the monitoring of the operators is fundamental for a stricter contract enforcement.
Parallel to this development, there has been an introduction and increase of the use of passenger incentives. This, it is believed by RPTA employees, will lead to less need for quality penalties, as these are made partly redundant when operators start caring more about attracting travelers. Therefore, one of the RPTAs states that it has reduced the formerly large number of quality incentives and corresponding monitoring activities. At the other RPTA the number of penalties has increased from a low level. This assessment is compatible with theory, but the relative strength of these incentives is not well known.
level of penalties. The reason being that the significant remaining causes of punctuality are beyond the influence of operators, e.g. increasing congestion and road works.
A further development manifested in policy documents is the increasing emphasis on the consistency between goal documents established by the political level and the contract level with its performance indicators. Although the processes of streamlining at the two RPTAs takes different forms, there are also important similarities. A prominent theme at both RPTAs has been the importance of passenger incentives for pursuing increases in ridership and the potential this gives to reduce the number and intensity of quality penalties.
Two main types of penalties have been found. The first type involves counting single deviations from a specification of an acceptable norm of performance where each deviation is charged. Examples are a cancelled departure or a departure or an arrival that is more than X minutes delayed. The second type involves setting a target for the ratio of acceptable performance (delivered and timely departures and arrivals) on a periodical basis (monthly or yearly). In this case the criteria for cancellation or delay are similar to the first type of penalty changes but the payment is tied not to single events but to aggregates over a time period. Then if the acceptable performance ratio, say X percent, is not reached a penalty is charged for each percentage unit underperformance
Most contract managers and their superiors can give an account of the principles governing their management of the daily determination of the penalty amounts. For one of the RPTAs we have received only penalty payments for one year and one contract. For the other RPTA we received documentation of the net total of monthly bonus and penalty payments aggregated to the total for two years.
We asked contract managers about the principles for monitoring, the sources of data and the guidelines for charging. In both RPTAs the organization of the monitoring is similar. There is substantial delegation to the operators to report the data on performance on which the payments are based. Both RPTAs state that they perform sampled controls of the data reported by the operator. When few deviations are observed between reports from operators and data held by the RPTA the RPTA assumes that operators report truthfully. We also asked contract manager about the guiding concepts when penalty systems were reformed. Surprisingly, there has been very little thoughts that have been presented on the grounds for changing the incentives in contracts. An internal document from Skånetrafiken reporting on internal discussions about potential changes in the incentive structure indicates that the views of operators has substantial weight in the process as does views expressed by staff at the RPTA. Similar views were expressed by Trafikförvaltningen.
Initially little or no reference was made to any oral or written experience or doctrine on incentive design. After a presentation of preliminary results from the present study, Trafikförvaltningen referred to internal analysis documents. Although, there have been research or consultancy reports and internal analyses of outcomes from different designs, no such documents have been referred to or presented.
There remains the possibility that experiences have been documented and that there may have been or are experts within these organizations that carry the experiences of the organizations and that these individuals play a key role in adjustments of contracts but
that these individuals have either not been acknowledged or that their peers do not know their roles in their organizations.
4.2. Monitoring of outcomes
In both the studied RPTAs contract managers were interviewed. There are important parallels between both individual contracts and RPTAs. Both RPTAs’ routines involve collection of data on outcomes of cancellations and delays from each departure. These outcomes are compiled monthly, and the compilations are the subject of a monthly follow ups and the basis for monthly invoices. It is important to remember that there are substantial differences between contracts in how penalties are calculated and therefore in the routines for compiling the monitored data.
One of the goals of this study was to examine how the chain (Figure 1) from the data on individual deviations collected in buses to the deductions in the invoices hung together. It is my assessment that a complete data set of deviations and payments for one RPTA over a longer period is not yet feasible to assemble. It should be possible to compile complete records of cancellations and delays at least for recent years.
There are some apparent flaws in the documentation. First, the documentation of the guidelines ant the decisions to exempt single instances of deviations from charging appear to be incomplete. Second, the accounting system does not distinguish between the payments for different penalties and bonuses and hence these are reported as nets. Therefore, it is not possible to directly compare the reported number of deviations and the number of charged deviations.
Buss computer Operator’s
report
RPTA control
Adjusted
with the principle that risks should be borne by the party that has the best possibility to influence the risk alternatively the best ability to bear the risk. For the other RPTA no original documentation of the deviations were presented. This RPTA presented the difference between maximum charges and actual charges for 2012 indicating that exemptions had been applied for one month. Both contract managers state that they charge strictly according to contract.
There is a substantial gap between the total number of cancellations and the number of reported cancellations from the operator in the accounts from the first RPTA above. In the final stage of this project this RPTA announced that it had been pursuing an oversight of their contract management and that they had identified inadequacies in the handling of i.a. penaltieson punctuality.
Summarizing the most important observations. The two studied RPTAs have good data on deviations from quality requirements. Most of the contracts of the studied RPTAs have penalties for cancellations and delays but the national prevalence of such penalties is low as indicated above. There are good data on cancellations and delays but not on the degree of penalty payments.
4.2.1. Analysis
Are penalties likely to have an impact on delivered and punctual departures? The most important observations from this section are that data allow for aggregation and therefore an assessment if quality in the above senses improves or not. Currently, we are however unable to assess the impact of individual penalties and bonuses as these are not accounted for, for each penalty type.
The fact that data has only been received for two contracts does not allow for generalization. An econometric analysis of the effects of penalty payments on cancellations and delays therefore does not appear to be feasible in the near future.
4.3. Charging
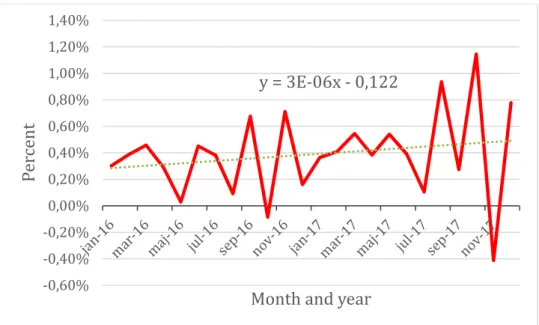
The contracts and accounting systems change over time. In data for the examined periods it has not been possible to distinguish between the payments for different penalties and bonuses and hence these are reported as aggregates. Therefore, it is not possible to directly compare the reported number of deviations and the number of charged deviations. We have asked for total penalty payments over all contracts from both RPTAs. One of them gave us aggregate monthly penalty payments for two years, 2016 and 2017 (Figure 2).
Figure 2 The share of total payments constituting penalties for one of the RPTAs Figure 2 shows the share of total payments constituting penalties for one of the RPTAs. The increasing time trend is significantly positive at the 10 percent level. This could lend some support to the notion that charging becomes stricter. This time series (and the relatively few observations) is however too short to provide solid support for the claim that the charging has become stricter. Note that the share the net of penalty payments is small compared to total payments. A participant at the meeting with the Swedish Bus and Coach Federation commented on this that given the low profit margins in Sweden, these payments are not small in relation to profit margins. From the other RPTA we received aggregate monthly penalty and bonus payments for one contract and yearly values of shares of aggregate penalty and bonus payments from some contracts lying in the interval 1 to 1,5 percent of total contract payments.
In section 4.1 it is mentioned that low quality monitoring data may lead to uncertainty and sometimes to conflict over what failures in delivery has taken place. A major reason given for not charging for failures is when these are caused by factors beyond the operators control. Therefore, both the documentation of these factors and the failures are important to achieve a high degree of charging.
Summarizing the data on charging, it is less resolved, thus not allowing a systematic comparison between deviations and charging in different contracts. The governance of contracts appears to allow for non-negligible exemptions from charging, possibly due to
y = 3E-06x - 0,122 -0,60% -0,40% -0,20% 0,00% 0,20% 0,40% 0,60% 0,80% 1,00% 1,20% 1,40% Pe rc en t
This section does not aspire to present a causal analysis of the incentives. As we do have such aggregate numbers, we present them below in Figures 3and 4.
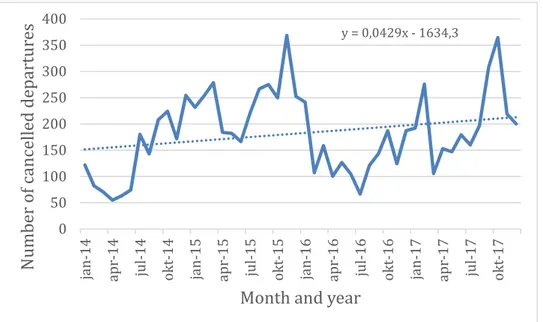
Figure 3 The number of cancelled departures in bus contracts for one of the RPTAs Figure 3 demonstrates an increasing trend in the number of cancelled departures. Unfortunately, we do not have numbers for the total number of departures for the same period but we know that for 2015 to 2017 the average number of cancelled departures was 0,032 %. A very low number. The trend coefficient is, just barely not statistically different from naught at the 10 percent level (p value = 0,10006). We therefore conclude that there is no significant trend in cancellations.
y = 0,0429x - 1634,3 0 50 100 150 200 250 300 350 400 ja n-14 apr-1 4 jul -14 ok t-14 ja n-15 apr-1 5 jul -15 ok t-15 ja n-16 apr-1 6 jul -16 ok t-16 ja n-17 apr-1 7 jul -17 ok t-17 Number of cancelled departur es
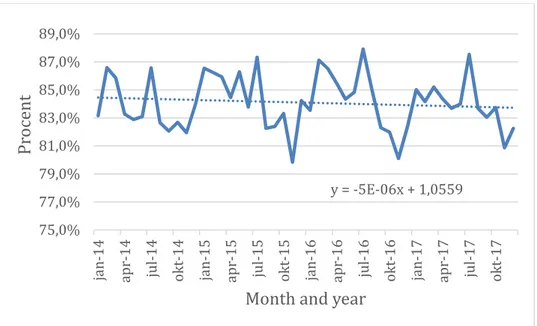
Figure 4 The share of punctual departures in bus contracts for one of the RPTAs Fig 4 demonstrates a decreasing trend in the relative number of delayed departures. The trend coefficient is however not statistically different from naught at the 10 percent level (p value = 0,45). Note that this graph implicitly assumes that the definition of a punctual departure remains constant over time and over contracts, which may not be true. We therefore conclude that there is no significant trend in punctuality observed in this way.
y = -5E-06x + 1,0559 75,0% 77,0% 79,0% 81,0% 83,0% 85,0% 87,0% 89,0% ja n-14 apr-1 4 jul -14 ok t-14 ja n-15 apr-1 5 jul -15 ok t-15 ja n-16 apr-1 6 jul -16 ok t-16 ja n-17 apr-1 7 jul -17 ok t-17 Pr ocent
Month and year
y = 5E-05x + 0,9917 y = -0,0003x + 0,9116 70,00% 75,00% 80,00% 85,00% 90,00% 95,00% 100,00% 105,00% 200701 200707 200801 200807 200901 200907 201001 201007 201101 201107 201201 201207 201301 201307 201401 201407 201501 201507 201601 201607 201701 201707 Pr ocent
In the appendix it is also indicated that most of this deterioration is likely to be due to the deterioration on only some of the contracts. For several suburban contracts’ punctuality has been stable. Note that all these comparisons implicitly assume that the definition of a punctual departure remains constant over time and over contracts, which may not be true. Data was also received for a contract without punctuality incentives. The trend in this contract (Figure 12 in the Appendix) is a statistically significant towards less punctuality. This single observation is not sufficient to infer anything about the strength of punctuality incentives.
Two further observations. Cancellations do not appear to be an important problem. Delayed departures are a larger problem for the first than for the second RPTA. The potential to reduce delays is not known. No management practice during the observed period appears to be working. Ideally data for each contract area should be analyzed for a longer period.
These simple regressions do not address possible causes for the increasing trend in delays as e.g. increasing traffic and consequently increasing congestion problems or increasing road works2.
According to both Trafikförvaltningen and a Stockholm based operator a possible cause of increased delays is an increasing amount of road works due to among other causes increased need to maintain and to expand infrastructure for water, sewage and broadband.
4.5. Customer satisfaction
If one of the goals of introducing penalties for cancelled and delayed departures is to improve quality and therefore customer satisfaction the development of these quality dimensions is Important. When interpreting the following results, it should therefore be remembered that almost all surveys have increasingly been plagued by non-response3. One observation from the analysis of response rates for different respondents is that it is mainly in the age-groups between 20 and 40 where responses have declined. This skewed response introduces doubts about the comparability over time of the observed development.
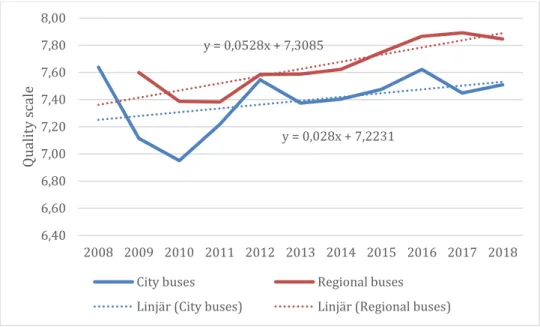
The Figure 5 below shows that for Skånetrafiken, both city and regional buses show positive trends for customer satisfaction, but only the coefficient the trendline for regional buses is statistically significantly different from naught (p=0,001).
2 A participant at the meeting with the Swedish Bus and Coach Federation claimed that the number of
granted permissions to do road works has increased fast in recent years in Sweden.
3 In the Swedish national travel survey RES 2005–2006 non-response was 32 percent. In 2016 this had
increased to over 68 percent (Eriksson et al. 2017). Similar patterns are said to pertain to customer satisfaction measurements in Swedish public transport.
Figure 5 Development of customer satisfaction for city and regional bus lines from 2008 to 2018 Source: Skånetrafiken Qlikview
The trends for bus transport in the Stockholm region is similarly positive, but the trend coefficient is just barely statistically different from naught at the 1 percent level.
y = 0,028x + 7,2231 y = 0,0528x + 7,3085 6,40 6,60 6,80 7,00 7,20 7,40 7,60 7,80 8,00 2008 2009 2010 2011 2012 2013 2014 2015 2016 2017 2018 Quali ty scale
City buses Regional buses Linjär (City buses) Linjär (Regional buses)
y = 0,703x + 69,933 66 68 70 72 74 76 78 80 2007 2008 2009 2010 2011 2012 2013 2014 2015 2016 Pe rc ent satisfied Yearly average
5. Discussion
This section will raise five issues noted in the previous sections. These issues are: First, the evidence of internal analysis in oral or documented form of design analysis. Second, the evidence and effects of stricter charging. Third, the sources of increased customer satisfaction. Fourth, how to gather evidence on if and how quality should be improved. Fifth, an assessment of present state of data availability.
First, given that penalty redesign has been a recurring event the expectation could be that some trace of design discussion would be found. It appears likely that such analyses of the effects of quality incentives have been carried out. Employees at one of the RPTAs state that such analyses exist. No examples beyond simple statements like, that “penalties have been studied” or that “new penalties are better”, have however been produced. Second, the two RPTAs state that the charging of penalties has become stricter. For the RPTA with aggregate bonus and penalty payment data, there is an increasing time trend in penalty payments at the statistically significantly at the 10 percent level. This could lend some support to the notion that charging is stricter. This time series, however (and the relatively few observations), is too short to provide solid support for the claim that the charging has become stricter. Ideally data for each contract area should be analyzed for a longer period. Such data should preferably be supplemented with data on other factors influencing the performance. At the same time high, but unchanged (or decreased) levels of performed departures and punctuality are observed. If it is assumed that penalty charging has become stricter and has had a positive quality improving effect, this must have been counteracted by other factors (like increased congestion or road works). Third, increased aggregate customer satisfaction is also observed. Börjesson and Rubensson (2019) show that higher levels of cancellations and delays are correlated with less customer satisfaction, whereas higher levels of crowding (in public transport) is not. Possible reasons may be that the overall satisfaction with quality in bus transport is high. Compared to railway the problems of cancellations and delays may be perceived to be small. A second possible explanation is that no deeper investigations of the issue have taken place recently within the two studied organizations.
Fourth, should quality be improved? Presently there is little evidence that quality can be improved in Swedish public transport in a way that increases social welfare, i.e. which increases benefits more than costs. To produce such indications/evidence managers would have to know more about the willingness to pay for less delays and the effects of, and costs for, different measures to reduce delays. Willingness to pay for reduced delays can be assessed by having good occupancy data and knowing when and where delays occur as the valuations are available. Effects and costs for different measures are less readily available. First the important sources of cancellations and delays must be assessed. To the extent that there are remaining sources of delays at the operators, RPTAs could experiment with stricter charging and higher penalties and observe the effects. To the extent that sources are external to the contracts, e.g. congestion and road works contracts
will have little impact. Finally, our evidence does not suggest that changes in quality incentives has had an obvious effect in the studied period.
Fifth, a second aim of this paper is to explore the possibility for a larger, more systematic study of effects of quality incentives. An important observation from the interviews with employees is the remark that “without good data on deviations we have a weak bargaining position towards operators”. This employee felt that there had been a considerable improvement of data capture and data quality. A result of this study is that there is now – in principle – good availability of outcome data on cancelled departures, delays and customer satisfaction. A disadvantage for a larger scale study is, however, the heterogeneity of contracts and data both within and between RPTAs which reduces the validity of comparisons. In contrast to the outcome variables the records of penalty payments are not collected in easily available databases. And in some cases, different penalties and bonuses are aggregated in final accounts. This study also finds wide spread in the forms of contractual obligations to pay penalties. These two circumstances render analysis of the effects of actual penalty charging on quality outcomes difficult.
6. Conclusions
This paper studies contract penalties for quality failures in public transport in two Swedish regions, with the objective to analyze the how penalties for cancelled and delayed departures are designed in Swedish local public transport contracts and what these designs are expected to achieve, how the outcomes are monitored, to which extent observed flaws, as defined in contracts, are actually charged and what the outcomes in the quality dimensions associated with penalties have been.
The central findings are that penalties are designed to be charged either based on each occurrence of a deviation or based on periodical aggregates. Very little in terms of oral or written explanations of the intended and expected effects of the designs have been found. Two important observations are that the RPTAs believe that the introduction of incentives for boarding passengers reduces the need for penalties for quality, but that the remaining penalties are necessary to secure a sufficient quality.
The two studied RPTAs both use penalties for cancellations and delays. The national prevalence of such penalties, however, appears to be low. Both studied RPTA’s have extensive monitoring systems in buses collecting positioning, timeliness, boarding passenger etc. Delivered departures and the timeliness are then reported and documented in databases. Both studied RPTAs claim that they have become stricter with charging over time. No evidence to this claim has been produced. Both RPTAs have accounts of invoice payments but systematic resolved data on penalty payments does not appear to exist. The charging of penalties is not saved as easily accessed data. Therefore, it has not been possible to trace the chain from outcomes to reductions in invoices. This has effectively obstructed a systematic study of the effects of charging in this study. The few observations we have, suggest the practices exist where charging is not pursued due to the assessment that deviations occurred due to causes that could not be influenced by operators. None of the RPTAs have presented a coherent picture of deviations and charging and consistent with the stricter management.
There is a potential for improvement in three dimensions. First, standardized definitions of cancellations and delays would facilitate comparisons between contracts and RPTAs. Second, resolved accounting of penalty payments for each penalty and bonus type. Third, this would enable integrated follow ups of the developments of quality outcomes and penalty payments. Such follow ups could provide a better base for assessing the impact of these incentives and provide a possibility to learn more about the effects of these incentives.
The quality outcomes have been stable in terms of cancellations and deteriorating in terms of punctuality. Punctuality, however, develops differently in different parts of the region. The deterioration in the inner city has been hypothesized do be due to more congestion or increasingly frequent road works. Therefore, it is not obvious that the changes in penalty clauses or contract management in the studied period has had an obvious improving effect on outcome quality. An overall conjecture arising from the study is that
the current quality incentives might not improve the outcomes but abolishing them could result in poorer performance.
Declaration of interest
This project was funded by K2 which in turn is partly funded and governed by the two studied RPTAs.
Acknowledgements
This study was funded by K2 - the Swedish Knowledge Center for Public Transport. Therefore, the study was approved by the two participating authorities. I am grateful to all employees at the RPTAs and the Swedish Bus and Coach Federation that contributed to this study. A draft of this paper was commented on at a seminar at VTI the 29th of May 2019 by Isak Jarlebring Rubensson. Andreas Vigren provided useful suggestions in the process of collection if data and interpretation of interviews.
References
Alexander, C., Goodhue, R., & Rausser, G. (2007). Do Incentives for Quality Matter?
Journal of Agricultural and Applied Economics, 39 (1), 1-15.
doi:10.1017/S1074070800022719
Bergman, M. and Lundberg, S., (2013). Tender evaluation and supplier selection methods in public procurement, Journal of Purchasing and Supply Management, Volume 19, Issue 2, June 2013, Pages 73-83.
Bigoni M. Spagnolo, G., Valbonesi, P., (2014). Sticks and Carrots in Procurement: An experimental exploration, The B.E. Journal of Economic Analysis & Policy, vol 14, 3, Börjesson, M. and Rubensson, I. (2019). Satisfaction with crowding and other attributes in public transport, Transport Policy, Vo. 79, 213-222.
Decarolis, F., Spagnolo, G. and Pacini, R. (2016). Past performance and procurement outcomes, National bureau of economic research, Working paper 22814.
Dellarocas, C., Federico, D., Spagnolo, G. (2006). Designing reputation mechanisms. In: Nicola Dimitri, Gustavo Piga, Giancarlo Spagnolo (Eds), Handbook of Procurement, Cambridge University Press.
Eriksson J. et al. (2017). Intressent- och behovsanalys för resvaneundersökningar, VTI rapport 939.
Gómez-Lobo, A. Briones, J. (2014). Incentives in Bus Concession Contracts: A Review of Several Experiences in Latin America, Transport Reviews, 34:2, 246-265, DOI: 10.1080/01441647.2014.895451
Hart, O., and Holmström, B. (1987). The theory of contracts. In Advances in economic
theory fifth world congress, ed. Truman F. Bewley. Cambridge: Cambridge University
Press, 71-156.
Hensher, D. A. and I. Wallis (2005). Competitive tendering as a contracting mechanism for subsidizing transportation: The Bus Experience, Journal of Transport Economics and
Policy, 39 (3), 295–321.
Hensher, D.A. and Stanley, J. (2010). Contracting regimes for bus services: What have we learnt after 20 years?, Research in Transportation Economics, 29, 140-144
Holmström, B. and Milgrom, P. (1991). Multi-task principal-agent analyses: incentive contracts, asset ownership, and job design. Journal of Law, Economics, and Organization, 7: 24-52.
Fehr, Ernst, and Klaus M. Schmidt (2007). Adding a Stick to the Carrot? The Interaction of Bonuses and Fines, American Economic Review, 97 (2): 177-181.
Fehr, E. and Schmidt, K.M. (2004). Fairness and Incentives in a Multi-Task Principal-Agent Model, Scandinavian Journal of Economics, 106 (3): 453–74.
Ida, Y., Berechman, J. and Levy, S. (2018). Cost, quality and scope of service, Research in Transportation Business & Management, Volume 28, September 2018, Pages 40-44
Jansson, K. (2004). Incitament beträffande intäktssäkring, punktlighet, inställd trafik och städning (Incentives with respect to revenue collection, punctuality, cancelled departures and cleanliness). Working paper. ÅF-Infraplan.
Jansson, K., & Pyddoke, R. (2007). SL: s kvalitetsincitament - En inledande studie (SL: s quality incentives - A prospective study), Commissioned by Stockholm County Public Transport Authority.
Jansson, Kjell and Pyddoke, Roger, (2010). Quality incentives and quality outcomes in
procured public transport – Case study Stockholm, Research in Transport Economics,
29, pp. 11-18.
Lafontaine F. and Shaw, K.L. (1999). The Dynamics of Franchise Contracting: Evidence
from Panel Data, Journal of Political Economy, Vol 107, no. 5, 1041-1080.
https://doi.org/10.1086/250090
Nobelprize (2016). The Prize in Economic Sciences 2016 - Advanced Information: Oliver Hart and Bengt Holmström: Contract Theory, Nobelprize.org. Nobel Media AB 2014. Web. 26 Sep 2017.
Pyddoke, R. and Swärdh, J.-E., (2017). The influence of demand incentives in public transport contracts on patronage and cost in medium sized Swedish cities, K2 Working papers 2017:10
Rye, T., & Wretstrand, A. (2014). Converging structures? Recent regulatory change in bus-based local public transport in Sweden and England, Research in Transportation
Economics, 48, 24–32.
Saenger, C., Qaim, M., Torero, M. and Angelino Viceisza, A. (2013). Contract farming and smallholder incentives to produce high quality: experimental evidence from the Vietnamese dairy sector, Agricultural Economics, Vol. 44, 297–308
Shavell, S., (1980). Damage measures for breach of contract, The Bell Journal of
Economics, Vol. 11, No. 2, 466-490.
Spagnolo, G., (2012). Reputation, competition and entry in procurement, International Journal of Industrial Organization, 30, 291–296.
Stanley, J. and van de Velde, D. (2008). Risk and reward in public transport contracting, Research in Transportation Economics, 22, p.p. 20–25
Appendix: Some time series of punctuality in the Stockholm region
contract areas
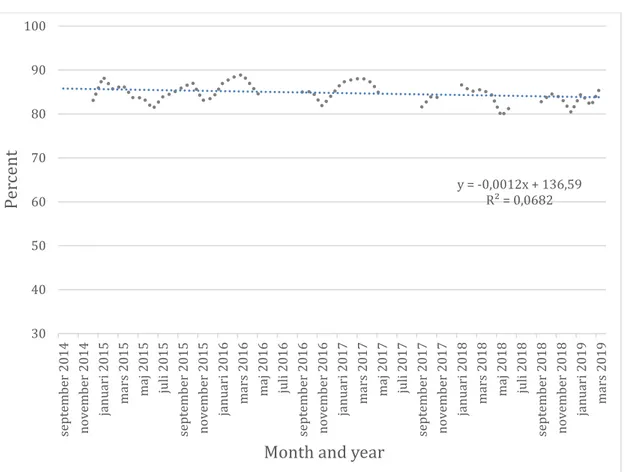
Figure 7 Punctual arrivals in E23 Stockholm inner city from September 2014 to March 2019 where the contract change occurred in August 2014.
A marked deterioration of punctuality over the whole period. The negative time trend is statistically significant at the 5 percent level.
y = -0,0012x + 136,59 R² = 0,0682 30 40 50 60 70 80 90 100 se ptember 2014 november 2014 januari 2015 mars 2015 maj 2015 juli 2015 se ptember 2015 november 2015 januari 2016 mars 2016 maj 2016 juli 2016 se ptember 2016 november 2016 januari 2017 mars 2017 maj 2017 juli 2017 se ptember 2017 november 2017 januari 2018 mars 2018 maj 2018 juli 2018 se ptember 2018 november 2018 januari 2019 mars 2019 Pe rc en t
Figure 8 Punctual arrivals in E20 Norrort where the contract change occurred in January 2013.
In this case the negative time trend is significant at the 5 percent level but not the dummy for the post contract shift is not.
y = -0,0017x + 140,71 R² = 0,0412 30 40 50 60 70 80 90 100 jan-09 apr-09 jul-09 ok t-09 jan-10 apr-10 jul-10 ok t-10 jan-11 apr-11 jul-11 ok t-11 jan-12 apr-12 jul-12 ok t-12 jan-13 apr-13 jul-13 ok t-13 jan-14 apr-14 jul-14 ok t-14 jan-15 apr-15 jul-15 ok t-15 Pe rc en t
Month and year
y = -0,0016x + 128,11 R² = 0,0466 50 60 70 80 90 100 Pe rc en t
No marked improvement in punctuality. The time trend is not significant but the dummy for the post contract shift is significant at the 5 percent level.
Figure 10 Punctual arrivals in E20 Bromma where the contract change occurred in August 2012.
In this case a dummy variable for the post contract shift period is significantly positive for arrival punctuality.
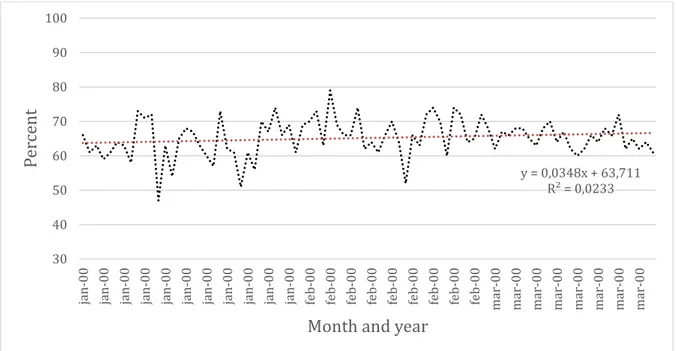
Figure 11 Punctual arrivals in E20 Sollentuna where the contract change occurred in August 2012. y = 0,0017x + 5,0587 R² = 0,0446 30 40 50 60 70 80 90 100 jan-09 apr-09 jul-09 ok t-09 jan-10 apr-10 jul-10 ok t-10 jan-11 apr-11 jul-11 ok t-11 jan-12 apr-12 jul-12 ok t-12 jan-13 apr-13 jul-13 ok t-13 jan-14 apr-14 jul-14 ok t-14 jan-15 apr-15 jul-15 ok t-15 Pe rc en t
Month and year
y = 0,0348x + 63,711 R² = 0,0233 30 40 50 60 70 80 90 100
jan-00 jan-00 jan-00 jan-00 jan-00 jan-00 jan-00 jan-00 jan-00 jan-00 jan-00 feb-00 feb-00 feb-00 b-00fe feb-00 feb-00 feb-00 feb-00 feb-00 mar-00 mar-00 mar-00 mar-00 mar-00 mar-00 mar-00 mar-00
Pe
rc
en
t
In this case a neither the trend for the whole period nor the dummy variable for the post contract shift period are significant for arrival punctuality.
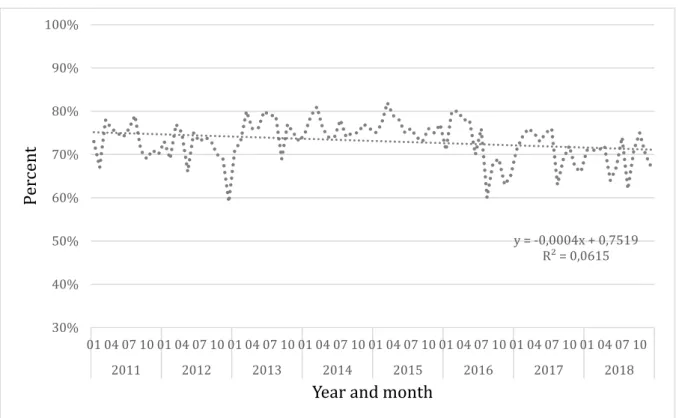
Figure 12 Punctual arrivals in E23 Nacka Värmdö where the contract change occurred in August 2011.
In this contract there are is a bonus for improved punctuality but no penalty. Here there is a statistically significant negative trend towards deterioration of punctuality at the five percent level (p=0,015). y = -0,0004x + 0,7519 R² = 0,0615 30% 40% 50% 60% 70% 80% 90% 100% 01 04 07 10 01 04 07 10 01 04 07 10 01 04 07 10 01 04 07 10 01 04 07 10 01 04 07 10 01 04 07 10 2011 2012 2013 2014 2015 2016 2017 2018 Pe rc en t
K2 is Sweden’s national centre for research and education on public transport. This is where academia, the public sector and industry meet to discuss and develop the role of public transport.
We investigate how public transport can contribute to attractive and sustainable metropolitan areas of the future. We educate members of the public transport sector and inform decision-makers to facilitate an educated debate on public
transport.
K2 is operated and funded by Lund University, Malmö University and VTI in cooperation with Region Stockholm, Region Västra Götaland and Region Skåne. We receive financial support from Vinnova, Formas and the Swedish Transport
Administration.