Mälardalen University
School of Sustainable Development of Society and Technology
Intellectual capital disclosure in Swedish "knowledge companies"
A study on how intellectual capital is accounted for in three Swedish knowledge companiesBachelor Thesis in Business Studies (EFO 703) Dennis Thorén
Glenn Rickardsson
Examiner: Eva Maaninen Olsson Turor: Johan Grinbergs
Abstract
Date: 2012-10-24
Authors: Glenn Rickardsson& Dennis Thorén, group 2920 Tutor: Johan Grinbergs
School: Mälardalen University
Level: Bachelor Thesis in Business Administration, 15 ECTS
Title: Intellectual capital disclosure in Swedish "knowledge companies"
- a study on how intellectual capital is accounting for in three Swedish knowledge companies
Problem: An organization has two kinds of assets; material assets and immaterial assets, also known as intellectual capital. There are straight forward ways of establishing the value of the material assets and stakeholders can easily find this information in either the income statement or the balance sheet. However modern businesses are increasingly reliant on their immaterial assets in order to generate value, since there is no equivalent to the balance sheet for immaterial assets - where do stakeholders find information on the subject, and how do the businesses themselves value intellectual capital?
Purpose: In order to understand where and how companies disclose and value their intellectual capital, this thesis has analyzed the annual reports of three leading Swedish knowledge-companies from a two year period, and interviews have been conducted with key individuals at said companies.
Methodology: Both qualitative and quantitative methods were used in this study. The qualitative part consists of primary data which was gathered through a questionnaire that was collected by e-mail, and secondary data was gathered from websites and financial reports of the selected companies. Qualitative data was gathered through the questionnaires alone, and processed through Spearman’s coefficient of rank correlation.
Conclusion: The chosen companies have chosen not to disclose much of their intellectual capital in their annual reports, one company even removing the subsection
intellectual capital from their annual report. It was found that human capital is the most valued component on intellectual capital. We have found that the selected companies do not use any specific method to valuate their intellectual capital. Keywords: intellectual capital, knowledge-company, annual report, disclosure, Sweden
Contents
Chapter 1, Introduction ... 1
1.1 Problem discussion ... 1
1.2 Purpose ... 2
1.3 The scope of the study ... 2
Chapter 2, Theoretical Framework... 4
2.1 History ... 4
2.2 Components of intellectual capital ... 4
2.2.1 Human capital ... 4
2.2.2 Organizational/structural capital ... 5
2.2.3 Relational capital/external capital ... 5
2.3 Valuation methods ... 5
2.3.1 Skandia navigator ... 5
2.3.2 Other methods ... 7
Chapter 3, Methodology ... 10
3.1 Qualitative and quantitative methods ... 10
3.2 Concepts ... 11
3.2.1 Relevance ... 11
3.2.2 Validity ... 11
3.2.3 Reliability ... 12
3.3 Methods ... 13
3.3.1 Primary and secondary data ... 13
3.3.2 Selection of companies ... 14
3.3.3 Questionnaires ... 14
3.3.4 Reviewing of financial reports ... 15
3.3.5 Spearman’s coefficient of rank correlation ... 16
Chapter 4, Empirical findings ... 19
4.1 Company A ... 20
4.1.1 Study of the 2009 and 2010 annual reports. ... 20
4.1.2 Questionnaire ... 21
4.2 Company B ... 22
4.2.1 Study of the 2009 and 2010 annual reports ... 22
4.2.2 Questionnaire ... 24
4.3.1 Study of the 2009 and 2010 annual reports ... 25
4.3.2 Questionnaire ... 26
4.4 Spearman’s coefficient of rank correlation... 27
Chapter 5, Analysis ... 28
5.1 Financial reports ... 28
5.2 Spearman’s coefficient of rank correlation... 29
Chapter 6, Conclusion ... 31
References ... 33
Literature list ... 33
Appendix ... 36
Spearman’s coefficient of rank correlation ... 36
Questionnaire - interview questions ... 38
Company B and Company A ... 38
Company C ... 38
Questionnaire – the ranking part ... 39
1
Chapter 1, Introduction
The value of an organization does not solely lie in its physical assets, but also in the assets that are non-physical in nature; such as an organizations intellectual capital. There are relatively straight forward methods, norms, and rules to establish the value of an organizations physical assets, which are also known as tangible assets. External parties such as individuals, other private- and governmental organizations and institutions to see the value of another organizations assets - that is through the financial statements, i.e. the balance sheet and income statement.
But how and where can someone find information on the other kind of assets, the assets which does not appear in the financial statements? These non-physical assets - or intellectual capital; they are assets which creates value for an organization, and in some cases might be as important as the physical assets or even more important. For knowledge intensive companies, such as consultancy or IT-companies, their whole businesses are built on this intellectual capital. The problem is then, where does someone search to find the information about the crucial intellectual capital of an organization? In order to get an accurate view of how the organization is fairing and where it is headed, this information is paramount.
1.1 Problem discussion
This thesis will focus on just that - where can someone look in order to learn about an organizations intellectual capital, is it somewhere in the annual report, or has it even been transformed to a figure on the financial statements? Also, what would be the reasons to chose not disclose too much information about their organizations intellectual capital?
During the initial information search in the process of writing this thesis, we came across that there are different components of the intellectual capital. It will be interesting to see how much of an emphasis different organizations put on the different components which make up intellectual capital - is there some part of the intellectual capital that is more important than the other?
The reason why it is interesting to study the disclosure of the intellectual capital for knowledge intensive organizations is because they are increasingly common today. We living are living in a post-industrial society where the many massive physical-capital-intensive manufacturing industries have closed down or moved abroad, and this trend in the Western World shows no signs of slowing down. So these knowledge-intensive companies are ever on the increase, but the financial statements of organizations are being constructed in a similar manner to how you might
2
as well have constructed the financial statements of English 19th century industrialization style steel mills (Fleischman, R. K, et al. 1993).
The financial figures on the annual report will always be historical values, transactions that have already occurred. Intellectual capital on the other hand focuses on the present and the future, not the past. The intellectual capital of an organization shows us in what direction the company is headed and how well suited they are in order to take on future challenges. Intellectual capital is also an important tool for managers and investors in determining the current market value of the organization.
1.2 Purpose
The purpose of this thesis is to analyze three different Swedish knowledge intensive companies, and how they are disclosing their intellectual capital. The reason to look at Swedish knowledge intensive companies is because Sweden, along with the rest of Scandinavia, is advanced in its norms for voluntary reporting of intellectual capital (Artsberg, K. 2003, p. 374), and has been the subject for foreign researchers wanting to learn in preparation for implementations of rules and norms in their respective country (Saleh, et al. 2010).
We are also looking at how the different companies view the respective components of intellectual capital, because if we know that there is a specific component that is more focused upon by the companies, then we will also know that it is more important (in their eyes), and when finding information on intellectual capital in other organizations and companies we can focus more on that specific component.
So by looking at how intellectual capital is disclosed and the differences between the components of the intellectual capital, this thesis can aid individuals in the future wanting to read about an organizations intellectual capital by pointing them in the right direction of where to find information and what is important.
1.3 The scope of the study
The scope of the study is limited to three Swedish knowledge-intensive companies, all of which are noted and frequently traded on the NASDAQ OMX Nordic Stock Exchange. These
3
companies are Acando, Novotek, and Addnode. The study encompasses companies listed on the Stockholm stock exchange because of their accessibility in terms of the annual report, also because of their relative success and relevance in the industry. When looking at the companies annual reports we have limited the number to two years, as we believe this is sufficient since the changing in the disclosure of intellectual capital is organic rather and develop slowly rather than revolutionary changing.
4
Chapter 2, Theoretical Framework
In this chapter, a brief history of intellectual capital will be provided, and an overview of current research and methods already established, to bring the reader up to date on the topic.
2.1 History
Intellectual capital has existed for at least as long as there have been companies, however the notion of intellectual capital has primarily evolved from three different sources (Sullivan, P.H. 2000). The first one came from Japanese Hiroyuki Itamiin when he published his book called "Invisible Assets" in 1980, the second wave of ideas came from David Teece of UC Berkely who fused together different economic researchers ideas and published an article in 1986 about technology commercialization and how to capitalize on innovation. Thirdly there was Karl-Erik Sveiby of Sweden who also in 1986 published his book "The know-how company", which focuses on the human capital aspect of intellectual capital.
Sällebrant, T. et al (2007) states that measuring intellectual capital is difficult because of the problem in relating the cost of developing intellectual capital to its involvement in new discoveries and other value increasing activities for an organization. There is also the problem that intellectual capital is not held by an organization, but rather by individuals within that organization, if they should leave so will also their contribution to the intellectual capital. As opposed to legal intellectual property rights such as patents, which stays with an organization.
2.2 Components of intellectual capital
To provide an understanding of the research topic, this section will describe what intellectual capital is and what components it contains. Intellectual capital can be divided into three parts (Kwee, K.C. 2008, p. 622).
2.2.1 Human capital
Human capital can be the educational or entrepreneurship level, flexibility, innovation, motivation, et cetera, of the employees, depending on which industry. In short, it is what the employees take home with them when they go home for the day. In the IT industry, which is knowledge-intensive or intellectual capital heavy, entrepreneurship has been shown to be
5
important; however the most important item in the human capital category for investors is the experience and quality of the managers (García-Meca, 2005, p. 436).
2.2.2 Organizational/structural capital
Organizational- or structural capital is for example the routines and culture of an organization and is regarded as the most difficult category to evaluate, as the culture of an organization may lose its usefulness or value when it is integrated in to another organization in an acquisition. Studies have shown that the organizational capital may be influenced in the short term by monetary compensation, however monetary compensation is visible in the balance sheet of Swedish companies in compliance with Swedish Accounting Standards Board (BFN) recommendations RR 29 - compensation to employees. However it is a complex relationship between the monetary compensation of employees and actual increased performance (Marr, et al. 2003. p. 447), and how to convey this relationship to external stakeholders.
2.2.3 Relational capital/external capital
Relational capital is the organizations relationship with all of the organizations stakeholders (Saleh, et al. 2010. p 41). For example having good reputation with their suppliers, having well designed databases and means of communicating with their costumers, are both valuable external/relational capital not put on the income statement or balance sheet, but still something that the company may wish to convey to its stakeholders.
2.3 Valuation methods
Here are listed some common methods that are used by organizations today in order to measure, or put a financial value on their intellectual capital. In the Empirical Findings chapter we have asked our targeted companies if any of these methods is what they use - if they use any.
2.3.1 Skandia navigator
Skandia is one of Sweden's leading financial services companies, they appointed Leif Edvinsson as the director of intellectual capital in the early 1990s and he devised this widely used method. It
6
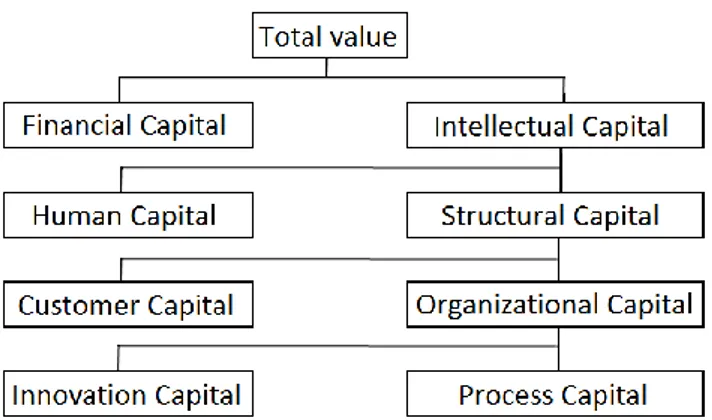
accounts for both financial and non-financial capital in the estimation of an organizations market value, see figure 1. As shown in figure 1, the total value of an organization is the combination of the financial capital and the intellectual capital, and under intellectual capital Edvinsson has two different categories: human capital and structural capital. Organizational capital is viewed as a subtopic under structural capital, along with customer capital, innovation capital and process capital.
This method is was the first of its kind to include such a broad coverage of organizational structural and process factors, it is considered an important tool especially in valuating research and development and the patent process.
Figure 1. Skandia Navigator, Value distinction tree. Source: Chen, J. et al (2004)
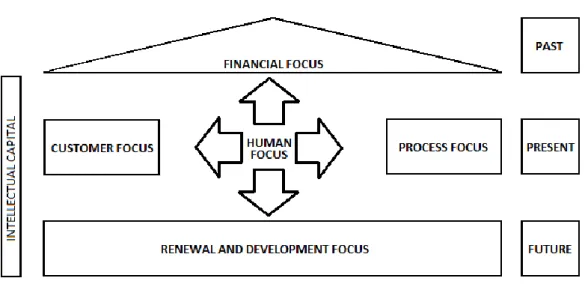
This method by Edvinsson was largely based on Karl-Erik Sveibys publications and can be seen in figure 2 that the focus is mainly on the human aspect of intellectual capital as it all originates from the human focus in the middle of the figure. On the top the financial focus can be seen, all financial figures comes from recorded transactions such as the income statement and balance sheet and are therefore historical values, as can be seen by the "past" box on the right.
What is left is the intellectual capital, as shown by the bar on the left side. In the present time we have our human focus, or human capital, as well as customer focus and process focus, and in the future there are the renewal and development focus. This model shows the importance of the intellectual capital, compare how much space the financial focus occupies compared to the rest of
7
the figure. Although the financial part is an important part, the intellectual capital shows stakeholders in which direction the organization is heading.
Figure 2. The Skandia Navigator.Source: (Ashton, R.H. 2005)
2.3.2 Other methods
There are many different methods to measure intellectual capital which have developed since the concept first developed, we will take a brief look at them to gain a broader view of organizations may valuate their intellectual capital. Sällebrant, T. et al (2007) writes about four different methods:
(1) Direct Intellectual Capital Method
By identifying and assigning a dollar value to the various components of intellectual capital, it is possible once all of the components have been identified to establish the market value of an organization.
(2) Market Capitalization Method
The value of the intellectual capital is the difference between a company's market capitalization and its stockholders equity.
8
(3) Return on Asset Method
By taking the average pre-tax earnings of a company during a time period and dividing it by the average tangible assets for the periods equates to RoA. RoA is then compared to the industry average, the difference is multiplied by the company's average tangible assets to get average annual earnings for the intellectual capital, that figure is then divided by the company's average cost of capital gives an estimated value of the intellectual capital.
(4) Scorecard Method
This method is similar to the Direct Intellectual Capital Method, it identifies the various components of intellectual capital, however, instead of assigning dollar values to the components they are identified and then shown in scorecards or as graphs.
Chen, J. et al (2004) gives us an additional three commonly used methods of measuring intellectual capital:
(5) Human Resource Accounting (HRA)
The objective of this method is to "quantify the economic value of people to the organization", it is primarily used in the service industry since it focuses on the human capital part of intellectual capital and does not take into account organizational capital or relational capital. There are three kinds of HRA models: cost models, Hr value models, and monetary emphasis models, however the authors state that these models have been criticized for being subjective and having to many assumptions.
(6) Economic Value Added (EVA)
This is a tool to measure the performance of an organization without explicitly including intellectual capital. EVA is equal to net sales minus operating expenses, taxes and capital charge. Despite not including intellectual capital, some strategy researchers supports the idea of using EVA since it implies that effective use of intellectual capital will increase EVA. However it leaves managers without adequate information on the components of the intellectual capital.
Now that the established and commonly used methods for measuring intellectual capital have been briefly described, it is possible to narrow down our search with keywords such as:
9
disclosure, IT, annual report, and methods, in addition to intellectual capital. With these keywords the search results in one particular database decreased from around 70.000 to a reasonable 3.000 search results. With these limitations, the query has provided relevant articles from authors that have conducted a similar study as this paper is about to begin, in different industries and locations, such as: intellectual capital disclosure in Sweden, The Netherlands and The UK by Vandemaele, S.N. et al. (2005), in Singapore and Sri Lanka by Abeysekera, I. (2008), in Australia by Dumay, J.C (2007), in India by Bhasin, M.L. (2011), and comparisons of intellectual capital disclosure in different industries by Sonnier, B.M. (2008).
In the article by Vandemaele, S.N. et al. (2005), the author reports an increase in the reporting on intellectual capital, an upward trend is clearly visible in the timeframe of the study, it also showed that the companies examined disclose their relational capital more frequently (40%) than human capital (30%), and organizational capital (30%). Swedish companies ranks highest in the European Union on their disclosure of their intellectual capital, with the study showing that disclosure in Swedish companies was 5% higher than in The Netherlands which ranks second and the UK which ranks fifth in intellectual capital disclosure in the EU.
Vandemaele, S.N. et al. (2005) study is consistent with a study of companies on the Swedish Stock Exchange by Artsberg, K., & Haller, A. (2001), which showed that Swedish companies present in the annual report more than which is required by regulations and norms. The reason for this is because the annual report and accountings main objective is to relay an accurate image of an organization to all of its stakeholders, an IT company may have its greatest strength in its intellectual capital and not its current- and non-current assets. However, revealing too much can be disadvantageous as competitors can take advantage of that information.
There has been several intellectual capital initiatives taken in Sweden, there was one in March of 2001 held jointly by the European Commission and the Swedish Ministry of Industry and Trade, in which 70% of the participants proposed standardization and guidelines on intangibles would be helpful for organizations (Guthrie, J. et al 2001).
10
Chapter 3, Methodology
This chapter will describe thoroughly how this paper aims to approach the research problem; what methods that have chosen and why, how data will be collected and processed as well as explaining a few key concepts that relates to the topic.
3.1 Qualitative and quantitative methods
The qualitative method seeks to gain an in-depth understanding of human behavior and what reasons that lie behind that behavior. This is a more subjective approach, and it also tends to generate several hypotheses the study proceeds, causing it to be inductive. Meaning that the hypothesis and theory may change several times as the research continues. Multiple tools might be required to thoroughly research the topic to provide a result that can be used. Data is gathered in the form of words rather than numbers (McNeill, 1985).The qualitative data used in this thesis was partially gathered from questionnaires, a process which will be explained in a specific topic further down, and partially gathered by reviewing the financial reports of the selected knowledge companies during a two-year period, as well as gathering background information through various sources that can be found under the literature review. The theoretic models that were usedto define intellectual capital were explained in the theoretical framework of this paper.
While the qualitative method seeks to answer “What?”, “Why?” and “How?”, the quantitative method seeks to answer “How often?” and “How many?”, which is communicated through the use numbers rather than words. There is a mathematical relationship between empirical findings that is assessed through a statistical analysis. This is usually conducted with a set of samples from a larger population, a hypothesis is then created and tested towards the collected data processed through statistical models. For the purpose of this thesis, a statistical model called the “Spearman’s coefficient of rank correlation” was used to see if the investigated companies valuated intellectual capital different or not. This is explained in detail under the topic “Spearman’s coefficient of rank correlation” in this thesis.
The study of this paper will include a combination of both the qualitative method and the quantitative method, as this allows for a more thorough research. While the qualitative part is directed towards finding out the difference in how the selected companies disclose intellectual capital, the qualitative part is directed towards finding out the differences in how the selected
11
companies valuate the components of the intellectual capital categories defined earlier in this paper. These two methods put together will provide with a deeper insight of how intellectual capital is viewed in the selected companies.
3.1.2 Inductive and deductive approaches
The deductive approach is the same as deductive logic, meaning that you start with one or several facts and form a hypothesis based on these facts, in order to reach a logically certain conclusion. In this thesis the qualitative reviewing of financial reports were subject to the deductive approach. The reviewed financial statements presented us with information, which enabled the formation of a hypothesis in the analysis and conclusion section of this paper.
The inductive approach begins with observations, from which a hypothesis can be formed. The quantitative statistical analysis was subject to the inductive approach, as data was collected and analyzed. The inductive approach also applies to the questionnaires, as opinions by key subjects within the key companies were collected via e-mail, and were then analyzed.
3.2
ConceptsThis section deals with the key concepts Reliability, Validity and Relevance. These were considered while performing the study and writing this paper in order to assure a high quality throughout the thesis.
3.2.1 Relevance
Relevance means that the research should communicate a purpose and a message that is of interest to the reader (Eriksson & Wiedersheim, 2001). This study is motivated by the fact that intellectual capital today is of growing importance and a key factor in the branch of IT companies.
3.2.2 Validity
Validity means that a research measures what was originally intended to be measured. There are three types of validity according to Yin (2003): Construct validity, internal validity and external validity.
12
Construct validity describes how to clearly define the variables that are to be measured to counteract misunderstandings in the process of interpreting these. This is defined under the topics of problem description, problem discussion, theoretical framework, and methodology of this paper.
Internal validity concerns explanatory and casual case studies, but has no relevance for exploratory and descriptive case studies, which is the aim of this paper and hence this is irrelevant. It seeks to isolate event x as the only cause for event y to take place, with no other alternative explanation or possible cause.
External validity is not associated with internal validity in any way. It deals with the problem of not knowing whether the sample dealt with in the study could be used as a generalization of the entity, such as an entire population, group, country, industry and so on. Critics claim that this is not viable as single study does not provide sufficient data to support this theory. Each case study is unique in its own way and does not provide a good enough basis to make an assumption such as generalization. Case studies are based on an analytic generalization in which the researcher strives to generalize a result in order to connect it to a broader theory. According to Yin (2003), a generalization can only be accomplished if the theory is tested through repeated studies in similar environments where the theory has specified that similar results should be achieved.
The aim of this paper is to analyze a sample of three selected companies. A sample is a small part of a larger population, analyzed to create a hypothesis of what the entire population may look like. The entire population in this case is equal to all the knowledge heavy companies in Sweden that rely a lot on intellectual capital in all of its various forms. A sample should not be mistaken for hard facts, as there is always the chance of sampling error. The sampling error is the same as a bad result due to random chance, where for instance most of the companies included in a sample are considered good, with just a few deviations considered bad. To assure a high external validity, the selected companies (presented under 3.3.2 Selection of companies) were all stock noted, well established, and recognized for their high competence in their respective fields.
3.2.3 Reliability
Reliability can be defined as the absence of random measurement errors in the study. Meaning that no matter how many times the study is conducted, or by whom, the results should be similar.
13
The goal is to minimize the deviations and preconceptions in the study. Thorough protocols and documentation should be recorded of how the study was performed in order to demonstrate good reliability. For example, if a similar study is performed by a third party that produces the same results, it is highly reliable.
The methodology part of this paper was constructed with the purpose of assuring a reliable research. The qualitative and quantitative methods combined with both the inductive and deductive approaches provide a clear image of what this thesis aims to achieve. The subtopic of 3.3, Methods, describes the path to achieving the end result.
3.3 Methods
3.3.1 Primary and secondary data
Both primary and secondary data will be used in this study. Secondary data is already existing information, such as that which can be found in literature, articles and other publications. The secondary data underlying this research is gathered from the internet, books relating to the subject, earlier research publications and the annual reports of the selected companies. Databases such as uppsatser.se, Emerald, DiVa, ABI/Inform and Discovery were browsed and the search words used were limited to intellectual capital, human capital, structural capital and organizational capital. Annual reports were collected from the websites of the selected companies.
Secondary data includes the gathering of information, such as observations, questionnaires and other techniques for collecting raw data. The secondary data was collected through a questionnaire, e-mailed to the employees of the selected companies that we had been in touch with. This process is explained in detail in section 3.3.X Questionnaires. These answers provided us with two sets of data. A qualitative part, and a quantitative part, both which were subject to the inductive approach. The quantitative data was processed through descriptive statistics, which is explained further under section 3.3.X Spearman’s coefficient of rank correlation), and the qualitative data was analyzed together with the financial reports.
14
3.3.2 Selection of companies
Companies selected for this paper are knowledge-heavy companies operational in Sweden, they are also chosen for being noted on the stock exchange. The names of these companies will not be made public in this thesis, instead, they will be referred to as Company A, Company B and Company C. All of the three companies are medium sized, though Company A is slightly smaller than the other two. The figures and information in this section was gathered from the websites and most recent financial reports of the selected companies.
The Company A-group is a supplier of industrial IT- and automation-solutions based on standard products. They operate within a wide range of branches such as infrastructure, pharmaceuticals, energy etcetera, to which they deliver customized solutions to make production more efficient. In other words, they are a developer of software. Company A is noted on the Stockholm Stock Exchange, with a stock value of 101.7 million Swedish crowns (June 2012).The P/E-ratio, which is the market price of the share divided by the annual earnings per share, is at 67.79.
Company B is a consulting firm in the field of IT and management, as they develop and improve the client’s organization and IT in order to strengthen the business activities of their clients. Company B is noted on the NASDAQ OMX Nordic Stock Exchange, with a stock value of 1101.29 million Swedish crowns (June 2012). The P/E-ratio for Company B is at 14.35.
Company C is a leading IT-company in the Nordic countries that delivers IT-solutions in the shape of computer software for design, construction and product life cycle handling. They also have a strong market share within workflow systems to the public sector etcetera. Company C is noted on the NASDAQ OMX Nordic Stock Exchange, with a stock value of 951.05 million Swedish crowns (June 2012). The P/E-ratio for Company C is at 87.17.
The P/E-ratios for Company A and Company C are rather high, this is probably because of predictions of a bright future for these companies, as profits are expected to rise steadily.
3.3.3 Questionnaires
A questionnaire was chosen to be part of the study because some of the data that we wanted to analyze could not be found in the annual reports and similar statements, we did not consider the
15
existing secondary data as sufficient. The first step was to contact key subjects within each of the selected companies by telephone, asking if they were interested to help with the thesis. Since the companies of interest are spread out across the nation, it is not realistic to schedule a physical meeting with these key subjects due to the timeframe we were faced with, and another reason being that these persons are very busy, and in many cases very stressed, therefore we chose to perform the interviews by mail. The persons that were interested in participating provided us with their e-mail addresses, to which we mailed the questionnaire that can be found in the appendix on page 39 and 40. In this questionnaire we first asked them a few questions regarding the intellectual capital categories that were defined earlier in this paper, and how these are valuated. These three categories were also broken down into four sub-components per category, for example the human capital category has been broken down into education, creativity & entrepreneurship, training and previous experiences. All these categories can be found in the questionnaire in the appendix as well as the topic of empirical findings, under the Spearman’s coefficient of rank correlation sub-topic. They were asked to rank each of these components on a scale ranging from one to four, assessing the perceived value of each of these. Where one is the lowest level of importance and fourth the highest. To prevent the interviewees from grading all factors of a particular category with the same figure, we asked them not to use the same figure more than once per category. This assured that the statistic that was originally intended to be used was still applicable (see the Spearman’s coefficient of rank correlation-heading for a more detailed description of the statistic).
Each of the persons who replied to the questionnaire will be referred to as Person X, Person Y and Person Z, all of them will also be referred to as males, regardless of their actual gender. Furthermore, since these interviews are not directly interactive, there is always the chance of misinterpretations or misunderstandings. To limit the chance of these we have chosen to provide the respondents with definitions and explanations of concepts, terms and a brief manual on how to respond, this will all be included in the appendix.
3.3.4 Reviewing of financial reports
The financial reports of the fiscal years of 2009 and 2010 (as these were the most recent reports available when this thesis was written) were collected from the website of each of the companies. These were then reviewed, using keywords such as intellectual capital, human resources, human capital,
16
intellectual capital in general. This was done to see to which extend the intellectual capital is disclosed in the annual reports, and how highly it is recognized. The reports of both fiscal years for each company were reviewed simultaneously page by page, to reveal if there were any differences over the two-year period. Once the picture was clear for each individual company (this part can be found under the empirical findings heading), the findings for all three companies were compared to each other (this part can be found under the analysis heading).
3.3.5 Spearman’s coefficient of rank correlation
The raw data collected from the questionnaires were processed through descriptive statistics, using a coefficient of correlation. Coefficients measure the relationship between two variables, however, which type of coefficient to use depends on the nature of the variables. The most common coefficient of correlation originated from Karl Pearson (StatTrek.com), denoted r (Pearson’s coefficient of correlation). Pearson’s coefficient measures the association between two variables of interval- or ratio-scale (Lind et al 2010). Interval-scale means that there is no clearly defined zero point, e.g. the Celsius scale for temperature, where negative values exist, and Ratio-scale means that there is a clearly defined zero point, e.g. a persons’ height or weight. The ranked data used in this paper is of something called ordinal-level. This type of data cannot be measured by the Pearson coefficient, hence Spearman’s coefficient of rank correlation, which measures ranked data, was most relevant for the purpose of this thesis.
A coefficient of correlation measures the strength of the linear relationship between two variables on a scale ranging from -1 to 1. A value near 0 indicates little association between the variables, -1 indicates a negative or inverse relationship, and a +1 indicates a direct or positive relationship between the variables (Lind et al 2010). Translated to the relevance of this paper, a perfect +1 result would indicate that the interviewees rank the intellectual categories identically, a perfect -1 result would indicate that they had the exact opposite preferences, and a perfect 0 result would indicate little association. In other words, a positive coefficient that is not too close to zero will indicate a similar ranking.
It is very hard to tell if these selected companies valuate intellectual capital differently just by looking at the annual reports (seeing as they are stock noted, and therefore potentially restrained when it comes to disclosing too much or some parts of information), or asking how each individual company perceive it. Therefore the three categories defined earlier in this paper with
17
their four sub-components each, was the most direct way of finding this out. After receiving the perceived values through the questionnaire, these could then be processed through the selected statistics and easily compared to what was found through the qualitative research. As was mentioned earlier – these methods complement each other. They allow for a much more thorough study. Not only does it enable a comparison in valuation, but it is also very easily compared to the qualitative study. By looking at what was found in the annual reports and the results from the inquiry – a more exact analysis and conclusion could be achieved, assuming that the findings strengthen each other in the sense that they are pointing towards the same result. If they were not, however, the reliability and validity of this study would be questionable. As this research aims to see if there are any differences in the disclosure and valuation of intellectual capital, a qualitative statistic such as this one is important and highly relevant to us.
The Spearman coefficient is a strong contributor to this thesis and we, the authors of this thesis, recommend a more extensive use of it. It is fairly easily calculated, and it can affect the reliability of a thesis positively (or negatively, which would be the case if the coefficient would point at a different result from what the rest of the study did, which is obviously not a desirable result that could seriously question the reliability of the study).
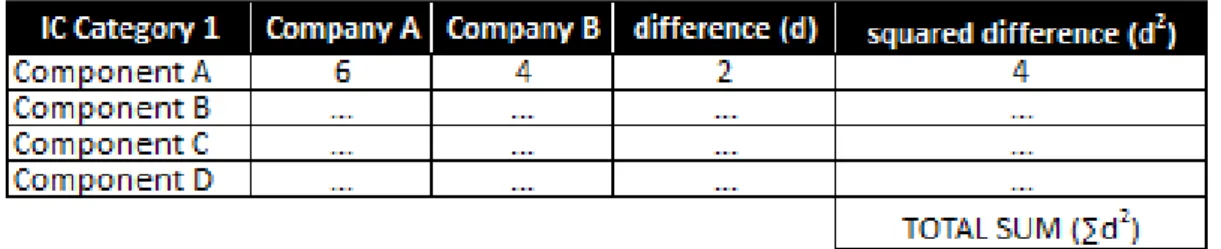
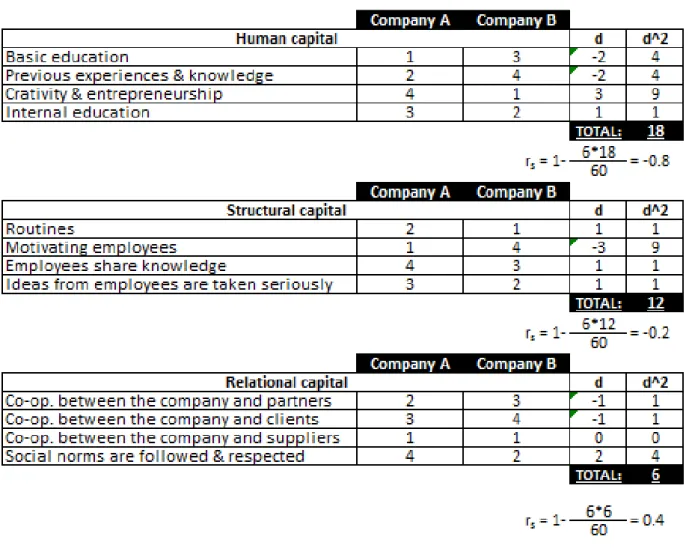
The first step towards acquiring the coefficient is to finding the rankings, and adding these to a table in which parts of Spearman’s coefficient of rank correlation formula is used. To explain this procedure, figure 4 illustrates the formula, and figure 5 displays how it is implemented in a table.
Figure 3. Spearman’s coefficient of rank correlation formula.(Lind et al, 2010)
The d in the formula is the difference in the values between the two variables for each row, and the n is the number of rows (i.e. intellectual capital components in this thesis). Each category of intellectual capital will have a coefficient of rank correlation calculated using its four sub-components. The difference between the two variables (Company A’s ranking versus Company B’s ranking of each component) are found for each row, and then squared. These squared differences are then added up to a total (i.e. sigma d2) which is multiplied by six. The n in the
18
formula is equal to four, as there are three main categories which all consists of four sub-components (defined in the theoretical framework of this thesis).
Figure 4. Spearman’s coefficient of rank correlation formula used in a table for a specific category of intellectual capital.
As can be seen, companies are compared two-by-two, as the statistic does not allow for more than two variables (companies) to be used at a time, resulting in three coefficients that are subject to analysis (as the survey was limited to three companies). Each coefficient will reveal indications of whether association between how the two compared companies valuate intellectual capital categories is reversed, similar or random. By then comparing these coefficients to each other, it can be seen if a set of two firms make more similar rankings than a different set of two firms. The pair of firms that have the highest coefficient of correlation make the most similar ranking of this type of intellectual capital.
This coefficient can be used within various areas of studies, and with data from a much larger sample - it can be used extensively to get very exact results. As was mentioned earlier, this thesis only concerns a sample of a few selected companies out of a population. But if the companies and components (as shown in figure 4) were to switch place, a huge amount of individual companies can be compared towards each other, by using categories instead of components for example. A questionnaire could include rankings of just the human capital versus the rest of intellectual capital, and if then an almost infinite number (figuratively speaking) of companies were to respond to the inquiry – a very precise result could be achieved. However, due to the model defined in the theoretical framework of this thesis, the three categories with their four components were best suited the aim of this thesis. As we wanted to find the differences in intellectual capital using twelve components, instead of just two variables, this results in a more precise result concerning intellectual capital rather than number of similarities between companies (as this is analyzed in the analysis either way).
19
Chapter 4, Empirical findings
For this section of the paper, we will look at how the selected companies have reported their intellectual capital in the annual reports, which is the primary focus and the quantitative section of this paper. The years selected for the annual reports are 2010 and 2009, and the reason for looking at this particular two year period is to gain an a larger view of the disclosure. Furthermore, it will be interesting to see - if any - change in disclosure of the intellectual capital in the selected companies during the end of the global financial crisis and the gradual recovery towards the end of the selected time period.
The annual reports has been examined for much of the intellectual capital is disclosed, some companies might have a header named intellectual capital, others might be more subtle and have headers with names such as "human capital" or statistics of their employees (age, gender, educational status et cetera). Customer relations can be synonymous with the relational capital for example, in short; annual reports will examined for information on anything that can relate to intellectual capital, id est, value creation assets that are not part of the tangible assets or the intellectual property.
We first called the companies and asked to be directed to an individual relevant to our field of study, and introduced ourselves and briefly explained the purpose of our thesis. After that, we have sent the individual a mail with questions, the template we have used for the interviews is to be found in the appendix on page 39 and 40.
The information gathered from the annual reports is divided in to subheading, with the findings from the annual reports, and with the questionnaire. The companies are listed as A, B, and C, because the interviewees wished to be anonymous, and the companies are all noted on the stock exchange so it would be possible to find the names of the interviewees otherwise.
20 4.1 Company A
4.1.1 Study of the 2009 and 2010 annual reports.
Both the report for 2009 and the report for 2010 are very similar at the first glance, as there are only minor changes in the content when compared. Therefore, unless dated or otherwise explained, the following information concerns information found in both reports.
There is a lot of focus on all of the three intellectual capital categories defined earlier in this paper (human capital, relational capital and structural capital) in both reports.
As for human capital, it is mentioned a number of times that a key to succeeding in an IT-market is competence. During 2009 the business climate changed, which led to further (specifically higher for the year) investments in the education and development of employees as part of an adaptation-process to ensure updated employees capable of performing according to expectations and through that the ability add value to the clients of Company A. If a client of Company A was to fail, it is considered to be a failure for Company A as well. Structural capital was also brought up, pointing out that it is important to motivate and encourage the employees as it is the innovative solutions engineered by them that is what drives the company forward. In 2010 there were no mentioning about further investments in education, however the structural capital was yet again brought up, this time with more emphasis to it.
Company A believes that they have the desired knowledge and competence to, as they describe it themselves, add one and one to get three.
Relational capital is mentioned briefly on several occasions in both of the reports, as outsourcing requires close cooperation between Company A and its clients. In 2009 the market was hard to predict, but there were positive progressions at already existing clients and they feel that they have what it takes to remain as the important partner that they have been in the past.
There is a sub-topic in both reports called “Co-workers and organization”, in which they define themselves as a knowledge-company, which relies heavily on attracting and keeping employees with the desired competence. In this section, they relate all of the intellectual capital components to the employee: their knowledge (human capital), social competence and the ability to bring the client into focus (relational capital). Because of this, Company A describes the importance of structural capital, to offer these key recruits attractive terms of employment, both monetary and educational.
21
During 2009 the number of employees with a high school degree or higher were at 52%, the following year there was an increase by 2%. This is not a very significant change while taking in to consideration that the number of employees in the Company A-group was relatively low during these years (175 in 2008, 158 in 2009 and 134 in 2010). Furthermore, it is stated that Company A desires long-term relationships with both customers as well as employees. Still they have decreased the number of employees by about 23.5% in just two years, while the average age increased, leaving the part describing the desire to decrease this figure unchanged. There is no explanation for this in the report. Although it is mentioned in both of the reports that the demand for employees with special training and education has been significant from both clients and competing companies, and that Company A has been successful with acquiring these thanks to the reputation and the position it enjoys in the industry.
Company A also mention a few key ratios that are related to human capital, these are listed during a five-year period (2005-2009 in the 2009 report), adding the financial report of 2010 to that, the period extends to six years. The operating income per employee (not a net figure) appears not to be related to the number of employees in any way. For example, this ratio increased during 2010, compared to 2009, even though there were 25 less employees than 2009, but still at a lower level than 2008 in which there were 175 employees as previously mentioned. 4.1.2 Questionnaire
The questionnaire found in the appendix on page 39 was sent to, and answered by, the CFO of Company A. This person preferred to remain anonymous, as the Company A is a stock noted company, and will be referred to as person X in this thesis.
X has worked within the company for nearly two years and has a high school degree in business administration. According to X, intellectual capital consists mainly of the human capital within the company. The components of intellectual capital are not disclosed in the financial statements under any specific heading, which was also found when going through the financial reports. On the question on whether or not the three categories of intellectual capital defined in this thesis are sufficient, or if the model needs to be expanded, X believes that the theoretical framework used in this paper are very broad and covers all of the relevant areas that Company A is concerned with. Lastly, X mentions that there are no specific models or techniques that are used in the valuation process of the intellectual capital that the company holds.
22 4.2 Company B
4.2.1 Study of the 2009 and 2010 annual reports
In the 2009 annual report they have an intellectual capital heading which briefly states that the development of Company B’s intellectual capital is coordinated by Company B’s Senior management and methodology experts. It is written that the intellectual capital is stored and made available to all of Company B’s employees, it is not stated what exactly is stored and when and how the employees use said information. However, it is written that the results of this intellectual capital sharing system are more efficient customer undertakings, reducing the risks for the company and smoother processes.
However, throughout the rest of the annual report there are many mentions of intellectual capital and its components. The component of intellectual capital that is focused on the most is Human Capital. Two pages are strictly dedicated to Company B’s employees, they write that their success is tied up to their employees and their development, that an important goal is to ensure that they attract the best consultants on the market, as they are a competence company, which in this paper is referred to as a knowledge-intensive company or a "knowhow company". In their words, an employee of an information-led company is a "knowledge worker", and go on to writing that information and people are the most important assets of a business, and over the coming years, the efficiency of information workers will be critical to competitiveness.
They write about how they are working on getting the most important information right, making it accessible, and establishing a culture and tools to simplify collaboration. By doing this, they believe they will be better prepared for the future as they write we are living in a knowledge economy, and are moving towards a creativity economy, where indeed the employees skills will determine the success or lack thereof.
As stated earlier in this paper, people think competence of management is the most important, Company B writes about the degrees and previous working experience of their most senior managers, and how newly appointed managers have further development in the Company B Leadership Academy, where they strengthen their ability to create and develop business. The results from their internal training is said to show results, that it is possible to see the positive effects of the programmes that have already been carried out, the programmes have yielded a higher degree of internal collaboration and external communication with customers and partners. The programme has also showed in employee surveys, with the managers receiving good marks.
23
Except for the Company B Leadership Academy they have long-term incentives programmes in order to increase the incentive to stay in the company as well as attract key future employees, as well as to increase the employee interest in the company and the results as well as to increase the affinity with the company. Senior executives receive an allocation of Company B shares, free of charge, so called performance shares.
They continue to write about their employees, writing that over 90% of their employees have one or more degrees for universities or collages, as well as having pie chart showing the numbers of years of employment in the group, age distribution in the group, as well as the number of men and women in the group. In the key ratios they have decided to include net sales per employee. All components of intellectual capital has some degree of cross-over, and in the annual report it is written that Company B has during the year a new web-based recruitment service has been introduced, and how it has enabled Company B to better, more efficiently and easier been able to handle their recruitment. Such a system is both serve the Human Capital and the Organizational Capital. It is also written about their "structure for collaboration" across the different offices in different countries, as it is a multinational company it is important that the different offices work in unison towards a common goal.
In the 2010 annual report the heading of intellectual capital is removed, however they still write about their Human Capital extensively, although without explicitly writing the term. They now write that they have the best consultants on the market, and how a typical Company B employee has previous experience as a consultant. The pie chart from 2009 showing the length of employment in the company has been replaced with length of service in the whole industry, the age and gender distribution pie-charts remain. Another thing that has been given less emphasis on is a key ratio, net sales per employee, which is related to human capital. In the 2009 report the key ratios are written early in the annual report under a section called Organization, but in the 2010 annual report the key ratios including the net sales per employee cannot be found except for in the consolidated income statement.
Like the previous year, the write how their most important assets are their employees and competition for qualified employees increased and is expected to continue to increase through 2011, they also write about how they are actively pursuing a strategy to retain employees with offerings such as health insurance, parental salary, remunerations, benefits and the provision of opportunities. Although writing about their human capital, it is less than in 2009, and deciding to
24
omit the intellectual capital heading in the 2010 annual report show that they are not as focused on conveying the intellectual capital in the annual report itself.
4.2.2 Questionnaire
The questionnaire found in the appendix on page 40 was sent to, and answered by, the CFO of Company B. This person preferred to remain anonymous, as the Company B is a stock noted company, and will be referred to as person Z in this thesis.
Intellectual Capital [at Company B] according to Z, is what Company B is completely based on as Company B is a consultancy company, and their revenue is based on the amount of time spent by the consultant on their clients. Z writes that the most important part for them is to have the right kind of intellectual capital, Z writes that this is that their consultants have the type of education and experience that the market requires.
Z says that they do not disclose their Intellectual Capital separately in their BS or financial reports, however as their business is based on the know-how of their employees, a high Intellectual Capital yields higher revenue.
On why Intellectual Capital is important he writes that for the employees, a high Intellectual Capital inspires and motivates, for the investors and financial analysts it is important that Company B has the right competence to meet the demands on the market. Lastly, for costumers it is important that the employees have the know-how to give them the best quality of consulting.
25 4.3 Company C
4.3.1 Study of the 2009 and 2010 annual reports
One of the very first things mentioned in both of the annual reports is that Company C enjoys continuous recognition for the strong human capital within the company, the knowledge to be more specific. They continue by also mentioning structural capital, the importance of recognizing and rewarding entrepreneurship and creativity. Furthermore, employees often meet to share their knowledge and experience with each other, the proximity and net of connections contributes to both the individual development as well as the performance of the company.
Relational capital is brought up consistently throughout both reports, as Company C believes that it is of the utmost importance to have a close relationship with its customers, and to understand the full extent of their needs. In the 2010 report, they even positively recognize that they gained an even closer relationship with many of its most important customers during the year. Company C further states that the biggest reward that they can receive from a client is renewed confidence, but first it has to be earned. Both reports mention the need to continuously measure and evaluate their own efforts to stay on top, especially as they work with some of the biggest actors within both the private- and public sector, e.g. Ericsson, the Swedish armed forces, Nokia, the Swedish national television etcetera. Company C mentions that the intangible assets are partially made up of contracts with clients, but no exact figures are mentioned.
The topic “Co-workers” is found in both reports, containing key ratios concerning these. The total number of employees increased from 646 in 2009, to 775 in 2010. This change also led to an increase in post-college educated employees, from 83% in 2009 to 87% in 2010, and an increase in high school educated employees, from 66% in 2009 to 75% in 2010. This is most likely explained by how Company C, in both reports, describes that one of the strategies to acquire an even greater role in the industry is to attract competent employees. More key ratios can be found in other sections of the reports as well. There is a lot of emphasis on human capital, but structural capital is also mentioned, as Company C offer its employees a chance to grow and develop by further educating them within the company, enabling them to recruit managers internally first hand. One of the goals is to recruit the best employees and then make them even better. This is partially shown by the average time of employment, which remained unchanged at a steady 7 years in the two subsequent periods, and motivated by how Company C seeks to make their employees feel at home and thrive within the company, as well as the possibility to work with state of the art technology and facing challenging problems.
26
4.3.2 Questionnaire
The questionnaire found in the appendix on page 40 was sent to, and answered by, the Senior Group Controller of Company C. This person preferred to remain anonymous, and will be referred to as person Y in this thesis.
Y has a high-school education in business administration, with a major in accounting & auditing. Y has worked for Company C for nearly 10 years, but has more than 25 years of experience of working with business administration and similar.
Y defines intellectual capital as “know-how”, in other words the relevance lies within the human capital and structural capital, and Y slightly disagrees with the definition of relational capital as a category of its own, and believes that it is a part of the other two categories.
The past 10 years did not bring many changes to the disclosure of intellectual capital, according to Y, Skandia launched the initial framework and since then there have been no greater alterations.
Furthermore, there are no specific guidelines for disclosing intellectual capital. Instead, accountants base the disclosure on their own subjective evaluations. There is however a desire for a clearly defined framework.
Lastly, on the question of whether the company uses any specific models or techniques when evaluating the intellectual capital held by the company, Y answers with a no.
27 4.4 Spearman’s coefficient of rank correlation
In the questionnaire, the interviewees were asked to rank the four components within each of the three categories of intellectual capital that were defined in the theoretical framework. The results yielded from this survey are presented in figure 5.
Figure 5. Ranked intellectual capital components acquired from questionnaire.
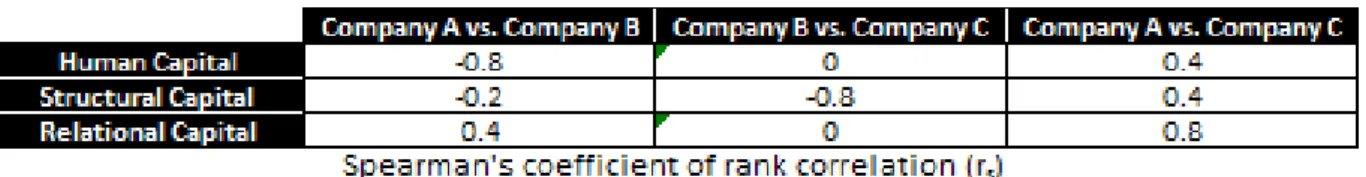
The companies were then processed two-by-two, using Spearman’s coefficient of rank correlation formula to acquire three coefficients for each set of two companies, one for each category. This means that there are nine coefficients to be calculated, as there are three sets of two companies to be worked. These are presented in the table in figure 6 below.
Figure 6. Results from questionnaire, post-statistical processing using Spearman’s coefficient of rank correlation formula.
28
Chapter 5, Analysis
Analysis of our findings in the previous chapter.
5.1 Financial reports
Human capital is the intellectual capital category, out of the three categories defined in the framework of this thesis, mentioned most frequently throughout all financial reports in both of the relevant periods. Company B, Company A and Company C all valuate competence of their employees in the knowledge heavy industry in which they are operating. This is not surprising as common sense dictates that the people with the best knowledge are also the most successful, especially in an industry like this, where competition is based on design, innovation and state of the art technology developed by the most competent employees. However, once the category is broken down into components, differences can be observed.
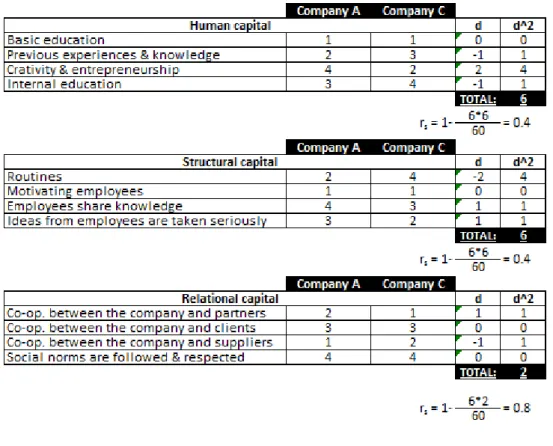
Company C put a lot of emphasis on internal education for instance, which can be seen in both the questionnaire ranking and the reviewing of their financial statement. The interviewee from Company C assigned internal education the highest rank, and it is also written in the financial report that there are extensive education programmes within the company. One of the reasons for this is to further strengthen the company’s relational capital. A company statement further enforced by the high rank assigned to the cooperation between the company and its clients-component of relational capital, by the interviewee.
All of the three companies mention the importance of a good relationship with its customers, as this can be seen in how the ranks were assigned by each interviewee from each company. They all valuate it as the most important or second most important in the relational capital category. In addition, in the financial reports the companies, they all describe how they work closely with clients to develop solutions. Company A describes it as a failure for the company if a client was to fail, and Company C states that the greatest reward they can receive from a client is confidence. Structural capital is mentioned a lot in all of the financial reports as well, but mostly integrated with- or written together with human capital as a consequence of improving the last mentioned.
The interviewees from Company A and Company C responded the same way to the question of whether there was a specific model or guidelines of valuating intellectual capital or not. None of them are using any particular framework, instead they mention it briefly every here and there, to at least recognize it. This question was not answered by the interviewee from Company B.
29
None of the companies uses any particular models to disclose it either; instead it is mentioned while connecting it to other subjects, e.g. the success of a new software or acquiring a new client. They, however, all mention human capital under key figures in the financial reports for all periods, such as the turnover per employee in the fiscal year.
As a summarization, it can be seen that human capital is the intellectual capital category mentioned the most. However, the other two are not neglected in any way. Instead they are usually mentioned together with- or integrated with human capital, and are highly recognized by each of the companies, which can be seen in both the financial reports as well the interviews.
5.2 Spearman’s coefficient of rank correlation
The correlations found in the statistical analysis are relatively high for Company C and Company A. The two positive coefficients of 0.4 for human capital and structural capital indicates a moderate positive correlation, meaning that they are very similar in their valuation of these categories. The coefficient of 0.8 for relational capital indicates a strong positive correlation, meaning that Company A and Company Crank this category almost identically. Whether or not this is due to random chance is hard to tell, but since all of the coefficients shows moderate to strong positive correlation, it is safe to say that they are very similar in their overall valuation of the intellectual capital, based on the framework provided by this thesis.
Proceeding to Company A and Company B, the picture has changed. The coefficients for human capital and structural capital are both negative, indicating that there is no correlation at all, meaning that the two companies rank these categories differently without any similarities. The relational capital coefficient though, indicates a positive correlation, as did the relational capital coefficient of Company C and Company A. However, as Company B and Company Care focused, the coefficient is now zero, indicating no correlation at all. This means that Company A is similar to both Company C and Company B when it comes to valuating relational capital, though Company C and Company B are valuating differently from each other. The rest of the correlation coefficients for Company B and Company C follow the same pattern, as they all indicate zero to negative correlation.
30
The conclusion that can be drawn from this analysis is that Company A and Company Care very similar in their valuation, while Company B differs from them both. However there is a relationship in relational capital, where Company A acts as a “bridge” between the other two companies.
31
Chapter 6, Conclusion
It is clear that intellectual capital is recognized as a highly valuable asset, and the data obtained by this thesis, from the research on the sample of these three companies, even dictates that it is the sole purpose of their continuous success. For instance, person Z from Company B noted that a higher intellectual capital yields a higher revenue.
Surprisingly, there are no sets of clearly defined standards or models used in the disclosure or valuation of intellectual capital in the reviewed companies within the sample of this thesis. Instead it is mentioned every here and there in the financial reports, and it is our, the authors of this thesis, recommendation that a general framework should be developed and used when preparing the financial reports. As intellectual capital is such an important component, it needs to be given more attention. This logical hypothesis is further strengthened by the words of Company B’s CFO, person Z, states that a higher intellectual capital attracts more investors, and further strengthens how the financial position of a company is viewed. The only symmetry observed is that all companies had a brief heading named “co-workers”. And that key figures concerning these were included in the appurtenant section.
There are differences in how intellectual capital is viewed by different firms and corporations, as is shown by the statistical analysis, in which different coefficients of correlation in the intellectual capital valuations were observed. Whether this is due to a random chance associated with the selection of companies in the sample or not is hard to tell. In order to make a more exact analysis, a much larger sample involving more interviewees would be required, and as the timeframe for this thesis prevented just that, only speculations can be made. It is however likely that many companies valuate differently, and that a framework would initially be problematic, but it is our, the authors of this thesis, belief that it would only yield benefits as an end result, and that these weigh more heavily than the potential confusion it may cause during implementation. It is surprisingly difficult to find information about intellectual capital in the annual reports considering how important it is for the success for these companies. It is understandable that the companies do not want to disclose too much of their intellectual capital giving away, exposing internal practices to competitors. However, given the importance of intellectual capital for the future of a company, we believe that companies should make information about their intellectual capital accessible to stakeholders without damaging their competitiveness.