551 11 Jönköping
ElectroFlex
Concept design of tool lanyard with integrated power
cable
FEILD OF STUDY: Mechanical Engineering and Product Design AUTHORS: Benjamin Mastroianni, Oliver Babic
ADVISOR: Marcus Eriksson JÖNKÖPING 2019, May
Post:
Adress:
Phone:
Box 1026
Gjuterigatan 5
036-10 10 00 (vx)
551 11 Jönköping
This thesis work is done at the Jönköping University Technical College within mechanical engineering and product design. The authors are responsible for all opinions, conclusions, and results presented. Examinator: Olof Granath
Advisor: Marcus Eriksson Student scope: 15 hp (bachelor)
Abstract
i
Abstract
ElectroFlex; Concept design of a tool lanyard with integrated electrical cable. Benjamin Mastroianni, Jönköping University Technical College.
Oliver Babic, Jönköping University Technical College.
For a company that focuses on the use of battery power, the integration into fossil fuel dominated markets can be challenging. In order to help with integration into new markets, Globe Group AB are developing job-essential accessories that are compatible with their tools and batteries. The purpose of the work done in this thesis was to develop a concept for a tool lanyard with an integrated electrical cable that is compatible with Globe Group AB’s current line of power tools. During this project it was decided that the research and testing would be conducted and analyzed based off high altitude tree work done by arborists.
This thesis focuses on the evaluation of research and testing to aid in concept design. A large focus was laid on the implementation of physical testing into early research and development stages, in an attempt to increase the validity of design decisions. The project was carried out by doing preliminary research and testing in order to gain information and metrics that could be used in the concept and prototype design stages. The prototypes were tested and compared to data collected prior in the project, to make statements about the feasibility of the concept and it’s included features. The result of this project was a final concept that includes all features that were deemed necessary through research and testing, a physical prototype, and test data to offer proof of concept.
Acknowledgements
ii
Without the assistance of several individuals, we would not have been able to complete this
thesis work to the degree of sucess which we feel that we have achieved.
We would like to thank, our supervisor at Globe Group AB, Kim Larsson, whose engagement
and willingness to help was invaluable.
Thank you to Christer Magnusson and Thomas Biro in the physics department at JTH, for
assisting with test design and the analysis of results.
Thank you to Jörgen Bloom, who took the time to assist us with operating the equipment and
software needed in the tensile tests.
Thank you to Erik von Essen, for allowing us to interview despite the fact that he was in the
middle of operating machinery.
Table of contents
iii
Contents
1
Introduction ... 1
1.1
Background ... 1
1.2
Problem Description ... 1
1.3
Objective and fundamental questions... 2
1.4
Delimitations ... 3
1.5
Dispostion ... 3
2
Theoretical Foundation ... 4
2.1
Connecting fundamental questions with theory ... 4
2.2
Demographic ... 4
2.2.1
Job sector ... 4
2.2.2
Age ... 4
2.3
Usage and safety requirements ... 4
2.3.1
Tool usage and technique ... 4
2.3.2
Lanyard usage and rigging ... 6
2.4
Systems and materials ... 7
2.4.1
Webbing ... 7
2.4.2
Stitching ... 8
2.4.3
Shock absorption ... 9
2.4.4
Electrical connectors ... 10
2.5
Ergonomics ... 11
2.5.1
Anthropometrics ... 11
3
Methodology ... 12
3.1
Process planning ... 12
3.1.1
Stage gate model ... 12
3.1.2
Failure mode effect analysis (FMEA) ... 12
3.2
Concept study ... 12
3.2.1
Gannt chart ... 12
3.2.2
Quality Function Deployment (QFD) ... 13
3.2.3
Competitor research ... 14
3.3
Concept generation ... 14
3.3.1
Brainstorming ... 14
3.3.2
Analogical thinking ... 15
3.3.3
Concept evaluation ... 15
3.3.4
Data collection ... 15
Table of contents
iv
4
Process and implementation ... 17
4.1
Market research ... 17
4.1.1
Interview with arborist ... 17
4.2
Competitor research ... 18
4.2.1
Baseline data ... 18
4.2.2
Customer Opinions ...20
4.2.3
Benchmark testing ... 22
4.3
QFD ... 31
5
Concept design ... 33
5.1
Problem breakdown ... 33
5.2
Brainstorming ... 34
5.3
Concept evaluation ... 34
5.4
Connecting known data... 37
5.4.1
Length ... 37
5.4.2
Elasticity ... 38
5.4.3
Features and Construction ... 39
5.4.4
Materials ... 40
6
Concept prototyping ... 42
6.1
Concept FMEA ... 42
6.2
Initial prototyping ... 42
6.2.1
Independent feature prototypes... 42
6.2.2
Proof of materials (POM) prototype ... 44
6.2.3
Breakaway system prototypes ... 45
7
Analysis and Results of Prototype testing. ... 51
7.1
Prototype displacement test ... 51
7.2
Prototype drop test. ... 52
7.3
Result of prototype drop and displacement test ... 55
7.4
TAS prototype test. ... 55
7.5
Results of TAS prototype test. ... 58
8
Analysis of fundamental questions ... 59
8.1
Question 1- What design features should be implemented? ... 59
8.2
Question 2- How should these features be implemented? ... 59
8.3
Question 3- How can physical testing be used in early stage product design?... 59
9
Discussion and conclusions ... 61
9.1
Implications ... 61
9.2
Conclusions ... 62
Table of contents
iv
9.4
Future research and development ... 63
10
References ... 65
11
Appendix ... 67
Introduction
1
1 Introduction
This thesis report was developed for educational purposes within mechanical engineering at Jönköping’s technical college. The report is written by two students studying mechanical engineering and product development. The project is done in collaboration with Globe Group AB to develop a tool lanyard concept.
1.1 Background
For years, consumers have turned to batteries for their convenience, portability, and rechargeability. As technology continues to improve, there is a significant increase in implementation of batteries in applications that, in the past, have been dominated by fossil fuels as the main source of power. For a company that focuses on the use of battery power, the integration into fossil fuel dominated markets can be challenging.
Globe Group AB is a company that is at the forefront of developing high powered battery packs (
Figure
1.1
) and battery driven tools, such as chainsaws, lawnmowers, and line trimmers. In order to help with integration into new markets, they are also developing job-essential accessories that are compatible with their tools and batteries.Figure 1.1. Greenworks external backpack battery. Source:[1]
1.2 Problem Description
In order to reach certain markets Globe Group AB requires assistance in the design of a tool lanyard, with an integrated power cable. The lanyard will allow users to tether whichever tool they are using to their person, through a harness or belt (see
Figure 1.2
).Introduction
2
Figure 1.2. Lanyard being used with an electric drill. Adapted from: [2]
The function of the lanyard is to catch the tool and prevent it from falling a long distance if it were to be removed from the user’s hands for any reason. The integrated power cable allows transfer of power to the tool directly through the lanyard, while allowing the use of an external battery; greatly reducing the weight of the tool.
To assist with the project, Globe Group AB has provided a list of preliminary specifications for the lanyard.
1. Cable and lanyard shall be integrated into each other. commercial design. 2. Ergonomic usage. Should not interfere with the user during usage of tool. 3. Easily detachable from product with maximum 3 step actions.
4. Existing cable connector shall be used on the battery pocket side.
5. Cable connector on user side shall be detachable when 1500-1800 N is applied. 6. Lanyard shall be detachable from user side when 1500-1800 N is applied. 7. Lanyard material shall handle a 5000 N tear force.
8. Length of the product shall be extendable by 80%-120%. 9. Ergonomic length of safety rope and cable.
10. Cable shall not have a load above 20 N on it when product is dropped. 11. Lanyard shall meet existing standards if any.
12. Lanyard shall be easily mounted onto climbing equipment with standard parts. 13. Product shall not be damaged when being overloaded.
In order to meet these specifications a large focus will be on test design and analysis in order to find relevant data that can be referred to when designing and testing concepts. Research and testing will be done on competitor products in order to develop benchmark standards to build off of. In addition to this, other markets that utilize similar products will be researched in hopes of finding relevant technology and systems that can possibly be utilized.
1.3 Objective and fundamental questions
The objective of this thesis is to design a concept through research and testing. Through research, the goal is to discover how the product is likely to be used and any standards surrounding the product. Testing of existing products will assist in developing a benchmark and determine whether the provided specifications from Globe Group AB are realistic. In addition to this, competitor testing will give insight
Introduction
3
to what features should be implemented or what can be improved. Other important parameters include ergonomics, ease of use, and safety.
Ultimately the goal of this project is to provide data and information relevant to the concept design of a tool lanyard and to present a functioning concept prototype.
There are also internal objectives and goals set by the project group. These include:
• Developing a functional model that can be showcased physically while demonstrating its functionality.
• Generating a concept with in-depth specifications in order for the manufacturer to find and change parts as needed before production can begin.
• Implementation of testing techniques into the design process as a method for making valid and reliable design decisions.
Fundamental questions:
[1] What design features should be implemented on the product? [2] How will these features be implemented?
[3] How can physical testing be used in the early stages of product design?
1.4 Delimitations
While the project goal is to develop as thorough of a concept as possible, several limiting factors have been included to ensure that the quality of the presented information is not impacted by time limitations, budget limitations or lack of facilities and equipment.
• Due to ongoing patents, an in-depth description of the certain features of the final concept cannot be discussed in this rapport.
• While production process and cost will be taken into consideration in the design process, it will not be included as a quantitative value when making comparisons and analyzing data.
• Overly specified and in-depth analysis of material properties is to be avoided. Instead data given by the supplier will be compared to collected data when making material choices.
• Test designs, data, and analysis will be verified by lab technicians at Jönköping Technical College to ensure reliability and validity of tests. Tests that are not verified or have an unsure outcome will be noted as such.
• In order to generalize the use of the product all development will be done in reference to the needs of an arborist. (See 2.2.1)
1.5 Dispostion
This report will start with a theoretical foundation, to give the reader a basic understanding of the theories and information that was used in this report. The following chapter will describe the methods used to aid in the research and product development stages. When knowledge of theory and
methodology is established, the report will move on to the process and implementation of these methods and theories. The ideas are then embodied in the concept design and prototyping chapters. This is followed by an analysis and result chapter where test data is evaluated and the fundamental questions are answered. References and appendix are presented in the last portion of the report.
Theoretical foundation
4
2 Theoretical Foundation
This chapter provides a theoretical foundation to be used as a basis for answering the fundamental questions.
2.1 Connecting fundamental questions with theory
Demographic (2.2): gives a theoretical foundation relating to who will be using the product. Usage and safety requirements (2.3): Provides information regarding standardized or
procedural usage practices. This assists in laying a theoretical foundation to how the tool will be used in conjunction with the lanyard, how the lanyard will be used in conjunction with the harness, and how the lanyard is required to perform.
Systems and materials (2.4): Provides information regarding existing safety systems and possible material choices. This provides a theoretical foundation to a variety of possibly implementable systems and amterials and how they are required to function.
Ergonomics (2.5): lays a theoretical foundation to how the product will be formed regarding size and function. Ergonomic data can be used in conjunction with technical data when making design decisions.
Product testing (2.6): Researches the question “how can physical testing be used in the early stages of product design?” as to understand how testing is currently used within product design and the potential benefits.
2.2 Demographic
2.2.1 Job sector
A tool lanyard is considered a multipurpose accessory that has use in a large variety of job sectors. However, for this project, the product will be designed towards the needs of an arborist, where
climbing is required to trim or cut down trees. An arbory is an ideal profession to use as a basis for the design of the product for the following reasons:
• Tree pruning, trimming, and felling, is often done at high altitudes. (see [3]) • Work is physically demanding and dangerous. (see [4],[3],[5])
• Work is highly dependent on the performance of equipment. (see [4],[6])
• Frequent use of lanyard and chainsaw means that product is perfectly applicable. (see [6])
2.2.2 Age
While statistical information regarding the age range of arborists is not well documented, John Ball, a forestry specialist at South Dakota State University, stated that “Tree workers often start in their 20s, but they may continue to perform production work into their 40s…” [3]. Assuming this statement as fact is viable as age can be considered a relatively insignificant variable in this project.
2.3 Usage and safety requirements
Within many fields, where there is a high potential for accidents, there exists practice guidelines to reduce the risk of injury.[4] These guidelines will often include core competencies that are a considered a requirement to perform the job as well as operational requirements and requirements regarding equipment.[4]
2.3.1 Tool usage and technique
According to the Health and Safety Executive “It is important that two hands are kept on the saw at all times, except where covered under onehanded chainsaw use.”[6], where one handed chainsaw use is to only be used within extreme circumstances [6].
Theoretical Foundation
5
Industry best practice dictates that top-handled saws must only be used one- handed where one hand is required to help hold a balanced stance or when material is situated out of reach of two handed use - usually at the extremities of branches. [6]
Figure 1.1. Source:[6]
Theoretical Foundation
6
When cutting horizontal sections, the saw should be held at hip level where the form of the tree dictates if the saw is held to right, left, or in front of the climber. [6] “On vertical sections, the climber will normally cut with the chainsaw at solar plexus level...”
[6]
Figure 1.3. Source: [6]
Figure 1.4. Source: [6]
2.3.2 Lanyard usage and rigging
The following are the Health and Safety Executive’s (HSE) recommended safe working methods regarding the use of a lanyard to secure a chainsaw to a harness:
Theoretical Foundation
7
The method of securing the chainsaw onto the harness can provide an opportunity for accidentally dropping the chainsaw. Using a chainsaw strop with an additional eye or karabiner can reduce the chances of this happening. This allows the strop to be attached to the harness while holding the saw and before it is released from the climbing line. These types of strop also allow the saw to be clipped directly and/or closer into the harness whilst not in use. This prevents the saw from whipping over a branch and striking the climber should there be a slip or swing whilst branch walking – it also eases climbing by keeping the saw out of the way of obstructions. The saw should be switched off when clipped directly into the harness, in order to prevent injury if the chain brake becomes accidentally disengaged.
The saw may be attached to the harness on the back strap at the centre of the harness (if a purpose designed attachment point is provided), or to one of the sides. In general, the saw should only be clipped to recommended attachment points, particularly as these may incorporate breakaway designs (refer to manufacturers’ specific requirements). Whilst sitting in the harness, the saw may be hung from the lifeline attachment points in order to take weight off the hips. [6]
Figure 1.5. Source: [6]
2.4 Systems and materials
2.4.1 Webbing
Webbing is a woven fabric that is manufactured to be either flat or tubular. There is a range of materials used in the manufacturing webbing and they are usually of very high strength. The most common materials found in modern webbing are polyester, nylon, Kevlar and polypropylene. Which material to use is determined by the application and what it requires in terms of strength, stretch and water repelling capabilities.
Table 1.1. Characteristics of commonly used webbing materials. Source:[7]
Theoretical Foundation
8
Nylon is the only material on the list with a distinguishable stretch property. Webbing made of nylon is commonly used in outdoor equipment and fall arresting applications where elasticity is important for shock absorption. It has decent resistance to UV degradation but should not be exposed to continuous sunshine for a long period of time. The material has absorbency properties when exposed to water, which can add weight to the webbing and host mildew growth.
Polyester webbing
While having similar strength, durability and UV resistance to that of nylon, polyester does not stretch or absorb water. This makes polyester a common material in heavy load-bearing applications such as seatbelts and hammocks.
Polypropylene webbing
Polypropylene webbing has similar properties to nylon despite being much lighter. It is, however, weaker and more susceptible to abrasion. These properties make the material suitable for applications where high loads are absent, such as window nets, backpack straps and plastic bags. [7], [8]
Kevlar webbing
Kevlar webbing is commonly used for its strength-to-weight ratio. It is also highly resistant to abrasion and water. The downsides of this product are the high price point, and low UV resistance, where, reportedly, as little as 40 hours of exposure to the sun can decrease the strength of the Kevlar up to 50% [8].
2.4.2 Stitching
The strength of a seam has a strong correlation to the tensile properties of the sewing thread and how it behaves in a certain stitch pattern. In order to convert thread strength to seam strength it is also important to consider thread structure. Depending on the thread structure, there will be different results as the friction between the thread and textile/fabric varies. [9]
Since the application is in a load bearing system, thread types of higher strength are demanded. When sewing webbing, nylon and polyester threads are most common, as they have a high fiber and tensile strength. Just as described in [2.4.1] the poor resistance to UV-degradation in nylon also applies for the sewing thread, making it not suitable for outdoor operation. The same principle applies for the polyester thread, as it is highly resistant to UV-degradation. [10]
These threads are usually bonded meaning that they undergo an additional process, where they are coated in a compound that keeps the individual yarns together. The bonding gives the thread a higher stiffness, smoothness, resistance to UV-degradation and promotes a higher sewing speed. [11]
Sewing pattern
In a test designed to find the strongest seam pattern and thereby the most suitable one in a load bearing application, three different patterns were analyzed. Shown in the image below, from left to right are the “bar tack”, “diamond” and “W” patterns.
Theoretical Foundation
9
Figure 1.6. The tested, bar tack (left), diamond (center), and W (right) patterns. Source: [8]
The tests were conducted on three different types of webbing:
1. Seatbelt webbing with a width of 5 cm and a minimum breaking strength (MBS) of 2140 kg.
2. Tubular polyester webbing with a width of 2,5 cm and MBS of 1225 kg.
3. Heavy weight nylon webbing with a width of 2,5 cm and MBS of 2132 kg.
The seatbelt webbing, being the widest, required the highest amount of stitches. All of the stitching was made with the same thread and the same amount of stitches per unit of length.
In conclusion, the author claims that the sewing pattern is irrelevant and what really matters is the amount of stitching. This is the case if a stitch formula is used, as it will tell you how many length units of stitching is needed. The “bar tack” pattern turned out to be excessive, as the webbing broke before the stitching and the author suggests that 8 tacks instead of 10 will suffice. What all tests have in common is that when sewn, the webbing will have a lower minimum breaking strength. [10]
2.4.3 Shock absorption
Shock absorption systems can be seen in several applications where there is a high risk of injury due to large impulse forces being subjected on the user. Various shock-absorbing or shock-reducing lanyards have been developed to absorb a substantial portion of the kinetic energy generated during a fall. in this manner, the worker is decelerated gradually rather than being brought to an abrupt halt. For example, systems employing elastic fibers, tear away elements and piston-cylinder shock absorbers have been used to cushion the shock of a fall.[12]
Regarding arresting forces of these systems OSHA 29 CFR subpart M states that a fall arrest system must limit maximum fall arresting force to 1,800 pounds when used with a full body harness. While these regulations apply primarily to construction activities, many other industries follow these guidelines for greater jobsite safety [13].
The tear-away system can be found in “screamers” that are used in mountaineering applications to help absorb the shock of a falling climber. These tear away systems are constructed using a length of high strength material that is folded and stitched together. In the event that a certain force is exerted on the system, the stitching is designed to sequentially fail and allow the material to unfold.
Theoretical Foundation
10
Figure 1.7. Pre-activated "screamer" attached to lanyard. Source: Adapted from [14]
Figure 1.8. Torn stitching of "screamer" after being activated. Source: Adapted from [14]
A drop test performed on a screamer shows that in comparison to a steel chain, the peak drop force can be reduced by 14-26%. The test is constructed to resemble a climbing scenario and is performed two times with different fall factors. Where the fall factor is the height of the fall in relation to the length of the rope. [15]
A tearaway system is currently used in several chainsaw lanyards already on the market. However in this application the system is designed in two parts to allow one end of the lanyard to detach after the stitching has been fully torn, where in the aforementioned applications, the system is required to catch the user after being activated. An integrated tear away system in these chainsaw lanyards acts as a safety measure that prevents the user from being anchored to a large falling mass (tree section/limb), were the chainsaw to get stuck.
2.4.4 Electrical connectors
Globe Group AB has specified that the external battery and its outlets must not take any damage in the case that the lanyards breakaway system were to be engaged. This is mainly due to safety standards listed in IEC 62841-1 2014 regarding batteries and high voltage equipment that states ”Damaged or modified batteries may exhibit unpredictable behavior resulting in fire, explosion or risk of injury”[16]. In addition to this, when comparing the price of the lanyard relative to the price of the battery, the lanyard can be considered expendable.
Most electrical connectors either require the user to intervene in order for it to disconnect, or are designed to sustain large pull forces without failure. In some applications, there is a need for connectors that are engineered to withstand forces until a predetermined threshold force is reached. When reaching this maximum force, the connector disconnects without necessarily breaking the component.[17]
Theoretical Foundation
11
2.5 Ergonomics
“Ergonomics is the process of designing or arranging workplaces, products and systems so that they fit the people who use them.” [18]. By studying the abilities, limitations and behaviors of humans and applying this into the design process, ergonomics aims to improve the interaction between product and person. [18]
Ergonomics is important when optimizing comfort and ease of use. In addition to this ergonomics takes into consideration an individual’s body size, strength, skill, speed, and sensory abilities with the aim to improve user safety. [18]
2.5.1 Anthropometrics
Anthropometry is the measurement and comparison of different body shapes and sizes in the general population. Datasets are constructed by measuring body dimensions of a large sample of personnel [19]. Anthropometrics is important as a way to provide mean values for the general measurements of the human body.
The Australian Government Defence Science and Technology Organisation collected measurements from a sample size of 277 females and 1861 males between the ages 18 and 40, as a way to evaluate soldier systems [19]. The collected measurements can be found in the appendix.
Figure 1.9. Anthropometric dimensions. Source:[19]. (Appendix)
Figure 1.10. Anthrpometric dimensions Source:[19]. (Appendix)
2.6 Product testing
Virtual and physical testing can act as critical design input and essential validation. As product testing tends to be performed at the end of a product design process, it does not receive the same level of attention as other activities. In the early stages of product design, testing is more focused on the use of virtual testing through the use of a computer aided model or simulation. However, there are certain risks in using a virtual test model, such as poorly supported software or failure to properly quantify variables. For this reason, it can be difficult to correlate virtual test results to real world
performance.[20]
It has been realized that product design and testing need to be closely integrated, and it is suggested that and the best time to start testing is immediately after a design task is delivered. It is important for a close collaboration between the design and testing departments to encourage immediate exchange of information [20]
Methodology
12
3 Methodology
This section explains the different methods that are implemented throughout this project.
3.1 Process planning
3.1.1 Stage gate model
The stage gate model is a system that seeks to keep track of, and speed up the product development process. While deployed, it acts a guideline to improve efficiency and effectiveness. It is broken down into stages and gates, where a stage is always followed by a gate. A stage gate model is depicted as a flowchart that is mono-directional, has a start and finish point and always ends with a gate.
Stage
The stages are tasks meant to aid the progression of the project and to help the project in reaching the next gate. Having a main activity known as a “best practice”, stages are if needed broken down into substages that can be run simultaneously. These substages are designed to minimise unknown variables that can increase the risks of failure.
Gate
A gate is a checkpoint where anything done in the preceding stage will see thorough evaluation. This in turn will decide how the project progresses, in a “Go/Kill” manner. To proceed, the results of the previous stage needs to fulfil the requirements and demands found in the gate. [21].
3.1.2 Failure mode effect analysis (FMEA)
FMEA is a highly structured and systematic technique for identifying and analyzing potential failures that may exist in a product or process [22]. Using FMEA has the following possible benefits:
• Multiple options for mitigating risk. [22]
• Higher capability of verification and validation changes. [22] • Collaboration between the design of the product and process. [22] • Improved design for manufacturing or assembly. [22]
• Lower cost solutions. [22]
• Legacy, Tribal Work Knowledge, and Standard Work utilization. [22]
3.2 Concept study
3.2.1 Gannt chart
A Gantt chart is a tool for visually representing the timing and duration of each phase of a project. The chart is constructed with the x-axis representing time and the y-axis representing the different tasks of the project. The chart provides a timeline by presenting horizontal boxes that represent the start and end of each task. Tasks done concurrently or partially concurrently can be displayed by overlapping boxes in the time axis. [23] The use of a Gantt chart aids in time management and provides an overview for important tasks and their deadlines.
Methodology
13
3.2.2 Quality Function Deployment (QFD)
A QFD or Quality Function Deployment is a way of defining customer requirements and converting them into engineering specifications.[24] This project will use level 1 QFD.
Level one QFD, called the House of Quality, represents the relationships between customer
wants/needs or “whats” and the product’s design parameters or “hows”. The following will describe the house of qualities different sections.
Figure 3.2. Source:[24]
WHATS: Wants and needs of the customer. [24]
HOWS: Design features or technical requirements of the product. [24]
Importance: Here the “whats” are rated by their importance. This is usually done on a scale of 1-5 with 5 being most important. [24]
Body or main room: Here the “hows” are ranked depending on their relation to, or ability to fulfill the “whats”. The ranking system uses a set of symbols that represent weak, moderate, or strong correlation (
Table 3.1
). [24]Table 3.1. Source:[24]
ROOF: Indicates how the “whats” interact with each other. The rating system ranges from strong positive interaction to strong negative interaction (
Table 3.2
). [24]Methodology
14
Table 3.2. Source:[24]
Competitor comparison: Visualizes the competitor product’s ability to fulfill the “whats”. This is usually rated using a scale of 1-5 where 5 represents the highest level of customer satisfaction. [24] Relative importance: The total sum of each column multiplied by importance factor. Used for ranking the importance of the “hows” when allocating resources. [24]
Lower level: Target values for the “hows”.
3.2.3 Competitor research
“Unless the team expects to enjoy a total monopoly, the relationship of the new product to competitive products is paramount in determining commercial success”.[23]
Extensive research on competitor products is essential to understanding the market and the needs of consumers. This research includes “purchasing, testing, disassembling, and estimating the production costs of the most important competitive products” [23] (For more information see section 3.5.1)
3.3 Concept generation
3.3.1 Brainstorming
Brainstorming is the use of a team’s collective knowledge and creativity to generate concepts and solutions. Brainstorming is one of the most open-ended and creative tasks in the product design process. It can be done in small or large groups and usually involves coming up with as many ideas as possible within a select amount of time. [23]
The four guidelines for brainstorming are as follows:
1. Suspend judgement. A general rule during brainstorming sessions is that criticism of concepts is not allowed, and any perceived weakness should be channeled into generating solutions or alternative concepts. [23]
2. Generate many ideas. Striving for quantity over quality encourages team members to share a larger range of ideas and increases the likelihood of the team to explore the entire solution space. [23]
3. Welcome ideas that seem infeasible. Ideas that at first seem infeasible can often be improved upon, and are beneficial in expanding the boundaries of the solution space and encouraging team members to think outside of the limits of possibility. [23]
4. Use graphical and physical media. Using three dimensional medias such as clay, foam, or cardboard can aid in communicating ideas that are difficult to verbalize. [23]
Methodology
15
3.3.2 Analogical thinking
Using analogical thinking to research unrelated areas that have comparable problems can provide new ways to approach the problem or solution. This can be done by considering if the problem exists on a different dimensional scale, if there is a natural or biological analogy to the problem, or if devices exist that have similar functions. [23]
3.3.3 Concept evaluation
Gut feel method
The gut feel method of evaluation depends on the intuition of the team to make design decisions instead of explicit criteria or data. This can be useful to speed up the development process where evaluating the feasibility of a concept is obvious or the team has a high level or experience within the field. This method must be used carefully in order to avoid the risk of making faulty decisions.
Concept screening and scoring.
Concept screening and scoring is a process where concepts are evaluated in respect to the needs and wants of the customer as well as the relative strengths and weaknesses of each individual concept. These methods are applicable not only during concept development but throughout the subsequent design and development process [23]. Concept screening is based on a method developed by Stuart Pugh in the 1980s to evaluate concept variants against selection criteria and quickly narrow down the range of concepts under consideration. “Concept scoring uses weighted selection criteria and a finer rating scale. Concept scoring may be skipped if concept screening produces a dominant concept” [23].
In certain cases, concepts can be improved, or two concepts can be combined if doing so preserves “better than” qualities while nulling “worse than qualities”. Combined concepts are then added to the matrix and rated along with the original concepts. [23]
Data analysis
Through research, and by performing a variety of tests a set of data can be collected that describes a concept or product’s individual metrics. These metrics can be compared and evaluated to understand which individual metrics function best for a given criteria.
MATLAB
MATLAB aids in the ability to compile and accurately compute large quantities of data. MATLAB’s programability allows for different variables to be changed quickly and easily when computing data. This grants a theoretical model where different parameters can be modified.
3.3.4 Data collection
Physical testing
Physical testing is a quantitative or qualitative process used to determine properties such as
mass, dimension, strength, shape, surface texture, and density [25]. Physical testing can be
performed on both products and individual materials. However because physical testing is
done on a macroscopic level, physical testing can only deal with limited variables and may
not always be comprehensive enough to include all operating conditions. [20]
Virtual testing
Virtual testing uses computer aided engineering to simulate a large spectrum of variability
over many interacting variables[20]. The virtual testing process can use computer models to
run performance simulations, but can also be done by making calculations in order to
estimate or predicts the behavior of a product or material.
Methodology
16
Benchmark testing
When developing a new product, a team will start the innovation process with an idea of “how it wishes to compete in the marketplace”. [23] The team works around target specifications and uses these to determine the performance of their product in relation to existing products, this includes competitors products and their own. To support the performance in relation to competitors, data from competitors products must be gathered and expressed numerically.
The benchmarking process is often time consuming but essential for the success of the product. In some cases, the information provided by competitors through manuals and advertised specifications are not accurate, therefore it is important that values regarding the key metrics of a product should be verified by independent testing or observation. [23]
Logger pro
Logger Pro is a software from Vernier that enables the user to analyze input collected from LabPro, which is an interface between a measuring device and a computer. Using Logger Pro one can get data collected from measuring instruments, expressed both numerically and graphically. It also allows for exportation to Excel, where a spreadsheet can be created. [26]
Sensors -Accelerometer
A 3-axis accelerometer is a device that detects and measures the change in velocity over time. It does this by sensing the change in capacitance between two plates that move relatively to each other, based on the acceleration experienced. This sensor measures acceleration in both the X, Y and Z
direction.[27] -Force meter
A dual-range force sensor is a multi-use measuring device that measures push and pull forces along one axis. This sensor has two measuring modes, each with a different force-range. One is for smaller forces of ±10 Newtons, providing higher accuracy in that particular range. The other range is ±50 Newtons, this will measure larger forces but have decrease in resolution. [28]
Prototype testing
The goal for prototype testing is to determine if a concept will work as intended and meet the customer requirements and specifications. Early stage prototypes serve as a proof of concept in deciding the feasibility of a concept. This testing is often done with use of an analytical prototype and a physical prototype. [20]
An analytical prototype is a theoretical model, where mathematical approximations can be used to narrow the feasible parameters. After the feasible parameters have been decided a physical prototype can then be used to fine-tune or confirm the design. It is often beneficial to construct a variety of physical prototypes in order to explore different combinations of design variables. Physical prototypes are also important in detecting unanticipated phenomenon that may occur in practice. [23]
The 4-step method for planning the prototype testing process are as follows:
1. Define the purpose of the prototype. The team must decide if the purpose for the prototype is learning, communication, integration, or mile-stone. [23]
2. Establish level of approximation. The team must establish which attributes are critical in the performance of the prototype.
3. Outline Experimental plan. The experimental plan includes the variable of the experiment, the test protocol, the measurements that will be performed, and the plan for analyzing the collected data. [23]
4. Create a schedule. Define when the prototype will be constructed and when the testing will start and end.
Process and implementation
17
4 Process and implementation
This chapter discusses the procedure and steps taken in order to answer the fundamental
questions.
Process flowchart
To further describe the workflow of this product development project, a flow diagram has been created. Where the squares represent product development stages, followed by gates, where the stage is evaluated and confirmed for advancement. The gates are illustrated as a rhombus. To fit this project, the flowchart is a modified version of the Stage-Gate system described in section 3.1.1.
Figure 4.1. Project process flow chart.
4.1 Market research
4.1.1 Interview with arborist
This interview was conducted through a phone call with an arborist of a nearby forestry company, Essaskog. The interview was recorded, with the compliance of Erik von Essen, whom also permitted for the use of his name and statements to be provided. The interview has been directly translated from Swedish to English for the purpose of this report.
Oliver: Are you currently using a lanyard to attach your chainsaw to your harness? Erik: Yes, you have too, I think it is legislated.
Oliver: Which brand/ type of lanyard are you using?
Erik: Well I don’t really know the brands or the model names but we have three different types. Oliver: Having experience in arboriculture, could you mention a couple of important properties and characteristics of a chainsaw lanyard?
Erik: The length is very important; it can’t be too short nor too long. It is also important that is hangs nicely from the harness. Sometimes I think that they are a bit too short. I’m right handed so the chainsaw is attached to my right hip and when I need cut on the left side they can sometimes feel a little short. It has to be stretchy, to gain some length.
Process and implementation
18
Oliver: Is lanyard that you are using coiled or straight?
Erik: My lanyard is of a straight construction, with tubular webbing and a rubber core. The chainsaw is attached with a so called ‘cow hitch’ that is tied with the integrated loop on the lanyard.
Oliver: Have you ever heard of a so called break away system in chainsaw lanyards, i.e. it breaks at a threshold force? Most lanyards break at a set force, but there are also those that rip off gradually to reduce the impact force. Are you currently using a lanyard with a break away system?
Erik: Yes, the one that I’m using has a system like that and we also have some that don’t have that feature. I do however, think it is required.
Oliver: This break away system of yours, is it integrated in the lanyard or attached separately, connecting the lanyard to the harness?
Erik: It is integrated in the lanyard.
Oliver: We have heard that another use for the lanyard can be to use it to reel the chainsaw from the ground to the arborist located high above the ground, in the tree.
Erik: Not really, if you want to climb up without the chainsaw you usually use the climbing rope to reel the chainsaw up.
4.2 Competitor research
4.2.1 Baseline data
Four different competitor tool lanyards were selected to be studied. The products were chosen due to their variances in construction, size, and elasticity. It is important to note that products 1-3 are intended for use with a chainsaw, while product 4 is a marketed as a general use tool lanyard.
Figure 4.2. The tested competitor products.
The metric subsets needed for the baseline data are the lanyard dimensions and masses. A row for stretch and observations were included to provide additional important information regarding construction, and function. This data can be found in the tables below (
Table 4.1
,Table 4.2
,Table
4.3
,Table 4.4
).Process and implementation
19
Table 4.1. Baseline date for product 1.Product 1
Stretch
elastic band
Mass (Kg)
0.167
Length Initial (m)
0.85
Length Full (m)
1.25
Webbing Width (cm)
2.83
Webbing Height (cm)
0.75
Observations
Elastic resistance feels very strong. Includes non-removable steel loop on tool end.Table 4.2. Baseline data for product 2.
Product 2
Stretch
elastic band
Mass (Kg)
0.079
Length Initial (m)
0.85
Length Full (m)
1.25
Webbing Width (cm)
1.97
Webbing Height (cm)
0.7
Observations
Elastic resistance feels very weak. Includes non-removabe steel loop on tool end.Table 4.3. Baseline data for product 3.
Product 3
Stretch
coil/spring
Mass (Kg)
0.218
Length Initial (m)
0.85
Length Full (m)
2.5
Webbing Width (cm)
1.82
Webbing Height (cm)
1.38
Coil Diameter (cm)
4.1
Observations
Process and implementation
20
Very smallcaribeaner loop. Coils get caught on loop when
threading on tool.
Table 4.4. baseline data for product 4.
Product 4
Stretch
elastic band
Mass (Kg)
0.156
Length Initial (m)
0.6
Length Full (m)
1.2
Webbing Width (cm)
1.24
Webbing Height (cm)
0.36
Observations
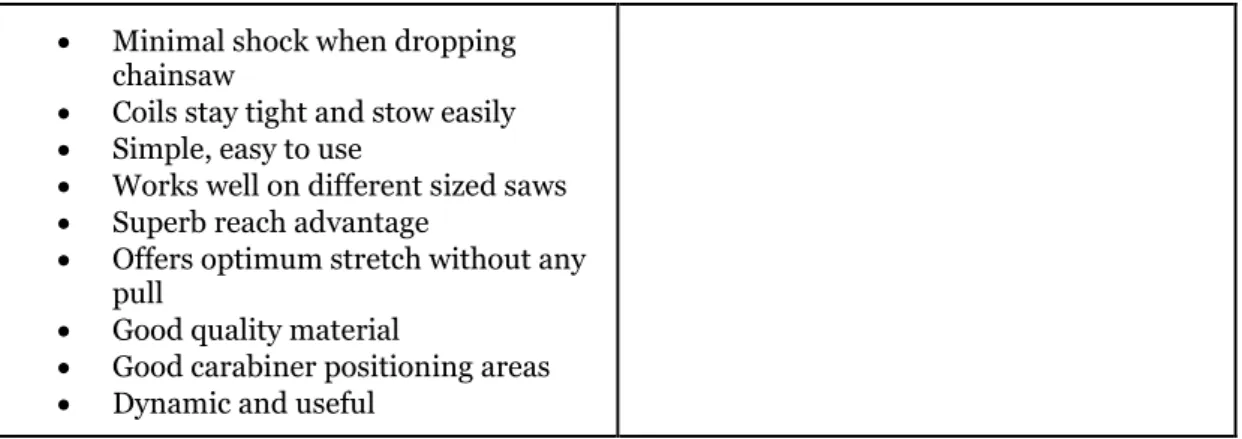
Includes non-removable caribeaner at each end4.2.2 Customer Opinions
In order to gain an initial idea of what customers expect from this product, a number of reviews were analyzed. During this research, only product 3 had an extensive amount of reviews. For this reason, an additional competitor lanyard, that is not included in the selected benchmark products, was also analyzed. This product will be referred to as product A (
Figure 4.3
). Product A was chosen due to its range and quantity of reviews and because it is, in terms of length and construction, similar to that of product 1, 2 and 4. In addition to this, it has an integrated breakaway system, which is absent in the lanyards used during benchmark testing.Process and implementation
21
Figure 4.3. Product A, where small pouch at end houses breakaway system. Source: Adapted from[29]
After the reviews were read, they were summarized into pros and cons. Product A:
Table 4.5. Summarized customer opinions for product A. Source: Adapted from [29]
Pros Cons
• Lots of stowing and attachment options
• Doesn't get all twisted • Good looking
• Never gets in the way • Reaches as far as you need • Great quality
• Break away system tears too easily
[17]
Product 3:
Table 4.6. Summarized customer opinions for product 3. Source: Adapted from [30]
Pros Cons
• Great reach • Well made
• Well thought out design • Robust build
• Stays out of the way
• Moves easily through thick foliage in trees
• Coils get hung upon the user's saddle
• Coils hang up on branches or transporter
• Too long
• Loop for carabiner is too small • Coils are a bit large, gets stuck • Doesn't minimize saw storage
Process and implementation
22
• Minimal shock when droppingchainsaw
• Coils stay tight and stow easily • Simple, easy to use
• Works well on different sized saws • Superb reach advantage
• Offers optimum stretch without any pull
• Good quality material
• Good carabiner positioning areas • Dynamic and useful
4.2.3 Benchmark testing
Displacement test
The purpose of this test is to measure each competitor product’s ability to resist displacement when loaded with a mass. This test provides information regarding the elasticity of each product.
The system used to conduct this test includes a rigid beam, brass weights, and a measuring stick. Excel and MATLAB are used for analyzing data and making calculations.
The parameters for this test are as follows:
1. The selected point on the lanyard used for indexing the distance between the point and the floor will remain the same for each measurement.
2. Displacement for at least 14 different masses will be documented, or until just before the lanyard is fully stretched.
The experiment was conducted by securing one end of the lanyard to a rigid anchor point, and then hanging incrementally increasing weights from the other end. The distance from the floor to a select point on the lanyard was measured after the addition of each mass. The data is then inserted into an Excel to be analyzed. The resulting data can be seen in the figures below.
See Appendix. Table 4.7, Table 4.8, Table 4.9, Table 4.10.
Product 1:
Figure 4.4. Force over displacement graph for product 1.
Process and implementation
23
Figure 4.5 . Force over displacement graph for product 2.Product 3:
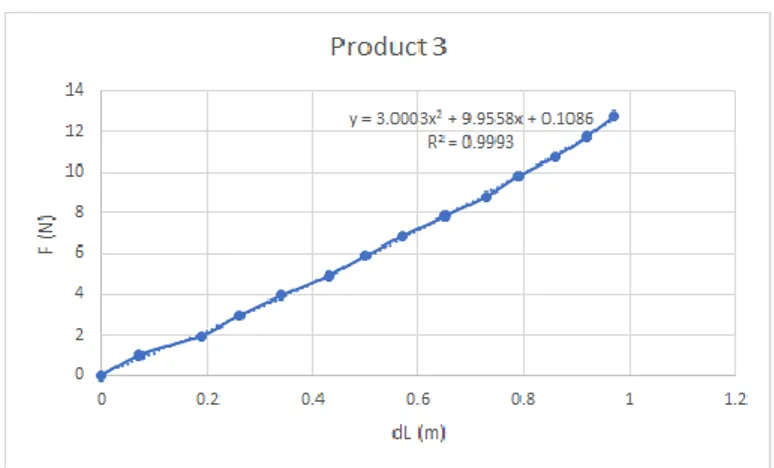
Figure 4.6 . Force over displacement graph for product 3.
Product 4:
Figure 4.7 . Force over displacement graph for product 4.
In Excel, the data is plotted to display the relationship between the force (N) acting on the lanyard and the change in distance undergone with the addition of each weight (m). Initially a degree of 3 was used
Process and implementation
24
for the trendlines corresponding to product 1, 2, and 4, however the trendline for product 1 and 4 were changed to a degree 4 due to hysteria encountered while making calculations. The curve for product 3 is set to degree 2 as it exhibits a near linear trend. In this case the curve function (can be seen in
Figure
4.4
,Figure 4.5
,Figure 4.6
,Figure 4.7
) represents Hooke's law, with multiple spring coefficients.𝐹(𝑥) = 𝑘
𝑛𝑥
𝑛… + 𝑘
3𝑥
3+ 𝑘
2𝑥
2+ 𝑘
1𝑥
Equation 1. Curve function expressed with multiple spring coefficients.
Because the behavior of each product in this test is dependent on interaction between the construction, materials, and elastic mechanism, using this function allows for calculations to be done with greater accuracy.
Using this function, the force required to extend each product to it’s maximum length (𝑑𝐿𝑚𝑎𝑥) can be
calculated, where x is substituted for the elastically active length of the product. This value is found by subtracting the initial length of each product by it’s fully stretched length.
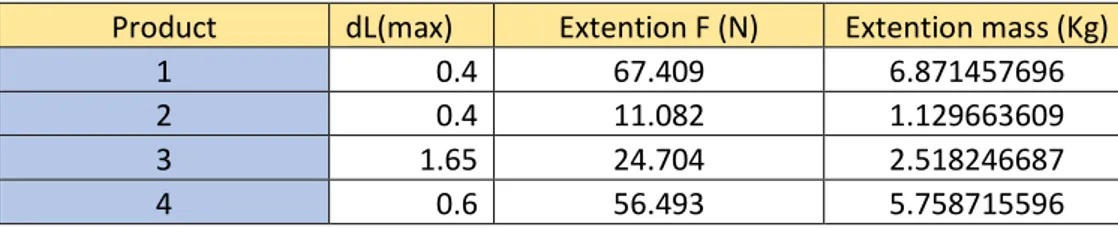
Table 4.11. Force and mass required to extend products to full length.
Product
dL(max)
Extention F (N)
Extention mass (Kg)
1
0.4
67.409
6.871457696
2
0.4
11.082
1.129663609
3
1.65
24.704
2.518246687
4
0.6
56.493
5.758715596
Integrating this function (
Equation 1
) from 0 to each products max extension length, provides the elastic potential energy (𝑈𝑒) in each lanyard(Table 4.12
). This is expressed as:𝑈𝑒 = ∫ 𝐹𝑑(𝑑𝐿)
𝑑𝐿𝑚𝑎𝑥
0
Equation 2. Elastic potential energy.
Table 4.12. Max potential energy for each lanyard.
Product
dLmax
Ue (J)
1
0.4
11.79
2
0.4
2.38
3
1.65
18.22
4
0.6
7.77
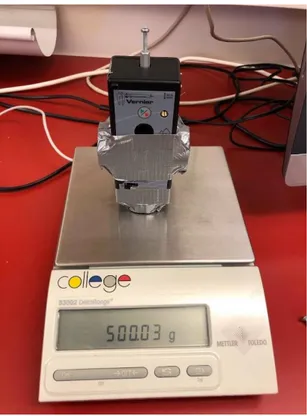
Drop testThe purpose of this test was to simulate a falling tool and collect numerical data relating to the performance of the four competitor products when catching a falling mass. This data allows for the products different elasticities and lengths to be compared.
The system used to conduct the experiment consists of an accelerometer secured to collection of brass weights, giving a combined mass of roughly 0.5 Kg, and several steel rods to act as a rigid beam. The brass weight and accelerometer assembly will be referred to as the measurement device. In this case the measurement device is acting as the tool, and the rigid beam acts as the anchor point on the user’s harness.
Process and implementation
25
1. The starting position for all four products will be the point where the lanyard is anchored to the rigid beam in order ensure the measurement device falls the entire length of the lanyard. 2. The mass of the measurement device will be the same for all four products.
3. The measurement device will be allowed to fall the entire length of the product and allowed to “bounce” at least two times.
The experiment is conducted by securing the measurement device to one end of the lanyard and the other to the rigid beam. The measurement device is then dropped from the starting position and allowed to collect the changes in acceleration experienced under the time the device is falling and being caught by the lanyard. The data collected by the accelerometer is then inserted into Logger Pro to be analyzed. In addition, any behaviors observed under the experiment, that are unable to be collected by the measurement device, are documented.
Process and implementation
26
Figure 4.9. Lanyard hanging from test set up.
Output:
After each test the data logged by the accelerometer is uploaded to LoggerPro. LoggerPro provides a table of collected values as well as a graph displaying the values as a relationship between the acceleration in 3 dimensions and time. In this case the data labelled as “X Acc” (in red) relates to vertical acceleration and thus is the primary focal point for this test. That being said, the acceleration in the Y and Z direction are of some interest, as they present rotational phenomenon underwent by the measurement device during the test.
The initial peak force is derived from the initial peak acceleration (a1,Table 4.13) through Newton’s II law, where the mass multiplied by the acceleration equals force. This force will be referred to as F1:
F1=m*a
The same formula will be applied using the second peak acceleration (a2, Table 4.13), to calculate the second peak force ( F2). F2 will then be subtracted from F1 to get the change in force, ΔF. This will help when determining the shock-absorbing capabilities of each lanyard.
ΔF=F1-F2
Table 4.13. Collected acceleration data.
Product
a1
(m/s^2)
F1 (N)
a2
(m/s^2)
F2 (N)
Δ F (N)
1
42.64
21.32
30.42
15.21
6.11
2
N/A
N/A
N/A
N/A
N/A
3
32.88
16.44
20.51
10.255
6.185
4
38.08
19.04
21.78
10.89
8.15
The sampled data from product 2 is not applicable since the peak acceleration exceeds the sample range of the accelerometer. The 3-axis accelerometer has a sample range of ±50 ㎨ and does not provide accurate data outside of these boundaries.
Process and implementation
27
Product 1:
Figure 4.10. Graphed accelerometer data for product 1.
Product 2 (N/A):
Figure 4.11. Graphed accelerometer data for product 2.
Product 3:
Figure 4.12. Graphed accelerometer data for product 3.
Product 4:
Process and implementation
28
Figure 4.13. Graphed accelerometer data for product 4.Ergonomics test
The purpose of this test is to simulate use of an arborist chainsaw and lanyard in a controlled environment in order to collect data relating to each lanyard’s ergonomics. The data collected gives insight to how the elasticity, length, and construction function in a dynamic environment. This test provides important parameters that ensure that the concept stays in a realm of usability when deciding features. An example of this, is that a lanyard with high elastic forces may show data that proves its ability to dampen drop forces, however in practice, is too stiff to be used comfortably. The system used to conduct the test consists of a belt, a device with similar grips and length of an arborist chainsaw, and a 1x2.4 m grid consisting of 9 points. To ensure that the handheld device does not have any influence on the results, its weight is lower than that of a typical top handled arborist chainsaw, as the sought-after data is strictly in relation to the ergonomic properties of the lanyard, rather than the chainsaw.
The distance between the 9 points was decided using the measurements provided by the Australian Government Defense Science and Technology Organization [5] and distributed in a way to simulate movement and positioning, ranging circumstantially from common to extreme. These measurements are used because a specific geographic market was not specified by Globe Group and the large sample size provides an accurate generalization of anthropometric data. Each point is numbered in a way that ensures variation in muscle group use between each movement. The order can be seen labeled for each point in
Figure 4.14
.Procedure:
The subject is directed to stand on a line that is positioned 70 cm from the test grid. For a control, the subject is first asked to touch the tip of the handheld device to the 9 points with no lanyard, being conscious of how comfortable they feel at each point. The subject is then fitted with a belt that ensures the lanyard being tested is anchored at a point at the base of their spine, with the other end anchored to the handheld device. The subject is asked to reach out and touch the tip of the device against each of the 9 points (or to come as close to possible), maintaining contact with the point for at least 15 seconds. Following each point, the subject is asked: “on a scale from 1 to 7, where 1 is much less comfortable and 7 is no difference, how comfortable would you say that was when compared to the control test?”. Each of the 9 ratings is then documented, along with any comments or actions made by the subject. After completing the test, the subject is asked 4 general questions:
1. On a scale from 1 to 7, how comfortable would you say the experience was? (1: very uncomfortable, 7: very comfortable)
2. On a scale from 1 to 7, how stiff did you experience the product to be (1: very stiff, 7 not stiff at all)
Process and implementation
29
3. On a scale of 1 to 7, how would you rate the range of motion allowed by this product? (1: fully restricted, 7:fully unrestricted)
4. When describing the products length, would you describe it as 1: too short, 2: a bit too short, 3: just right, 4: a bit too long or 5: too long?
This process was repeated for each of the 4 benchmark products.
A B C X
Y
Process and implementation
30
The points on the grid will be referred to as the combined coordinates of the horizontal values (A,B & C) and the vertical ones (X,Y and Z).
The four test subjects had their weight, reach, dominant hand, height and build documented. When testing, the subjects were not allowed to observe each other and were asked to be in a separate room.
Table 4.14. Dimensional information for each tested subject.
Subject
Mass (Kg) Height (m) Reach (cm) Build
Dom hand
1
75
193
76 normal
R
2
73
178
63 normal
R
3
79
177
64,5 muscular
R
4
75
181
67 thin
R
The hypothetical outcome of this test was that product 2 would be most comfortable, as it has the lowest stiffness, it was however expected to limit the reach. Product 3 was expected to have the best reach and product 1 was expected to be experienced as the stiffest while being limiting in terms of reach. It was expected that lanyard 4 would have a lower rating at longer reaches.
Output:
Along with the average score of each lanyard, the scores for each vertical and horizontal line ar also calculated. When looking at the vertical distances, X, Y and Z are not of the same significance. As stated in section 2.3.1, the saw should be held at hip level when cutting horizontally and at solar plexus level when cutting vertically. The saw should only be used one- handed when the second hand is required to maintain a balanced stance. Therefore, coordinates on the Y axis are regarded as most important, followed by the X axis. Cutting at foot level may interfere with ropes and security rigging, making it a suboptimal technique and gives the Z axis values the lowest significance.
Table 4.15. Average comfort ratings from Ergonomics test
Averages
Product Combined average X average
Y average Z average
A average B average C average
1
3,69
2,50
5,83
2,75
3,08
4,17
3,83
2
4,94
4,33
6,25
4,25
4,33
5,33
5,17
3
5,56
5,08
6,42
5,17
5,17
5,83
5,67
4
4,88
3,71
6,42
4,50
4,33
5,17
5,13
The average values of axes A, B and C shows which horizontal position is the most comfortable. As all test subjects were right-handed, reaching to points along the A axis would cause the lanyard to elongate more than for axis B and C. This provides metrics to Erik von Essens claim in section 4.1.1: “I’m right- handed so the chainsaw is attached to my right hip and when I need cut on the left side they can sometimes feel a little short”.
The questions answered after each lanyard test were compiled into average scores, giving further insight to the experience of each lanyard.
Table 4.16. Answers to questions from ergonomics test.
Average score
Product
Q1
Q2
Q3
Q4
1
2,5
2,25
3
1,75
2
4,25
5,75
3,75
2,25
3
5,75
6
6,5
4
4
4,5
4,25
4,25
2,25
Process and implementation
31
All of the testing was documented and the full tables can be found in appendix.
4.3 QFD
With the results from market and competitor research done in section 4.1 and 4.2, a level 1 QFD can be made (Figure 4.15). The consumer wants (HOWS) of the QFD are sourced from the specifications provided by Globe Group, the information gathered in the interview with an arborist (4.1.1), and the costumer reviews (4.2.2). The design parameters (WHATS) are the features that will be included in the product.
Figure 4.15. QFD
The matrix allows for the design parameters to be ranked in respect to its relationship to each of the consumer wants. Each rank is then multiplied by its respective customer importance. The sum of the column can then be seen as the importance of each design parameter. These are valuable metrics when allocating how time and material recourses are divided amongst product features.
The results of this QFD show a high importance on a tool lanyard with integrated electrical cable, options for equipment and accessories, that is compact yet allows full range of motion. Durable and functional materials are considered the most important parameter.
Process and implementation
32
The QFD “roof” is a judgment on whether the interaction between two design parameters will have a negative or positive effect. These interactions are important factors when making design decisions that can affect the function of other parts of the product.
Using information gained through research and testing a comparison of how the competitor products are able to fulfill the consumer wants can be done. This is used to give an idea what parameters are important in order to compete in the existing market.
Concept Design
33
5 Concept design
This chapter describes the steps taken in the generation and design of the concept.
5.1 Problem breakdown
Before the concept generation can start, a more detailed understanding of the problems needs to be reached. Because of high number of specifications in this project, the concept will need to consist of a collection of solutions that can integrate and interact with each other. In order to do this, the problem is broken down into five sub-problems, which then are broken down further into important focus points to guide the brainstorming process. By doing this, it grants the ability to evaluate solutions for each sub problem separately, as well as in combination. The five sub problems are as follows:
Table 5.1. Problem breakdown.
Sub-Problem
Focus points
Electrical Cable
• Power transfer• Interaction • Integration • Minimal stresses • Break away • Size • Safety • Retractable
Load bearing portion
• High strength• Interaction • Load bearing • Breakaway • Material • Size • Retractable
Attachment
• High strength• Interaction • Integration • Construction • Size
• Usability
Elastic
• Braking ability• Integration • Ergonomic • Minimize size
Breakaway system
• Function• Integration • Reliability • Construction • Shock absorbing
![Figure 1.2. Lanyard being used with an electric drill. Adapted from: [2]](https://thumb-eu.123doks.com/thumbv2/5dokorg/5556664.144980/9.892.330.579.102.547/figure-lanyard-used-electric-drill-adapted.webp)
![Figure 1.5. Source: [6]](https://thumb-eu.123doks.com/thumbv2/5dokorg/5556664.144980/14.892.249.645.398.711/figure-source.webp)
![Figure 1.6. The tested, bar tack (left), diamond (center), and W (right) patterns. Source: [8]](https://thumb-eu.123doks.com/thumbv2/5dokorg/5556664.144980/16.892.114.732.107.484/figure-tested-tack-diamond-center-right-patterns-source.webp)
![Figure 1.7. Pre-activated "screamer" attached to lanyard. Source: Adapted from [14]](https://thumb-eu.123doks.com/thumbv2/5dokorg/5556664.144980/17.892.247.645.108.333/figure-pre-activated-screamer-attached-lanyard-source-adapted.webp)
![Figure 3.2. Source:[24]](https://thumb-eu.123doks.com/thumbv2/5dokorg/5556664.144980/20.892.281.608.243.611/figure-source.webp)