Visual browsing of semantic descriptions of
heritage buildings morphology
Annika Moscati
1, Julie Lombardo
2, Luigi Valentino Losciale
3,
Livio De Luca
21
Dipartimento S.D.R.A., La Sapienza Università di Roma, Italy
2MAP-Gamsau Laboratory, UMR CNRS/MCC 694, Ecole Nationale
Supérieure d’Architecture, Marseille, France
3
Università “G. D’Annunzio”, Chieti-Pescara, Italy
Abstract
This contribution focuses on the possibility to link and visualize the relation between a 3D representation of an architectural building and its conceptual description by a graph-based browser interface. For this reason it is used a 3D model and a web application, the Nubes Visum. This platform utilizes a semantic description model that is defined by a semantic level, a structural level and a representation one. To have a new approach at the stored information we added to Nubes Visum another interface that is divided into two parts: the interactive 3D model and an interactive graph. Being a tree structure every node can have children with the same characteristics. This graph allows to establish a privileged link between the 3D representation of buildings and the concepts that describe them in the world of knowledge. The model's hierarchy is expressed by the tree hierarchies of the graph and in the same web page it is possible to choose the graph related to one of the three semantic description levels. By this bilateral relation between information written in the graph and elements describing the object morphology, is possible to perform information searches in two directions: the seek related to the selected entities in the 3D scene and search of entities in the 3D scene trough queries obtained from database.
Keywords: cultural heritage, architecture knowledge, semantic description,
1
3D models to access at the cultural information
1.1 ContestIn recent years, the scientific analysis of documentary resources has benefited of informatic solutions in data's organization and managing. Many solutions have been developed in order to improve the management of digital content (Fedora Commons Repository Software), while other works focused on the definition of a formal structure to describe the implicit and explicit concepts and relationships used in cultural heritage documentation (Doerr, 2002). A research consortium (A.I.M.A.T.S.H.A.P.E.) worked also on the definition of metadata and paradata related to the procedure of data's acquisition and processing.
If many works focused on the semantic characterization of generic 3D shapes (Attene et al., 2009), very few works seem to deal with the integration of heterogenous data in a display device referring to the morphology of buildings (Manferdini et al., 2008). In this area, research works focuse on how heterogeneous data are linked to the morphology of the building or to its graphic representation. In the panorama of current researches, some systems associate information to the entire building (Herbig & Waldhusl, 2008), other ones associate information to entities belonging to a 2D representation (Salonia & Negri, 2000) or to a 3D representation (Knuyts et al., 2008; Havemann et al., 2001), and finally other systems organize information around a model description (Dudek et al., 2003). However, if the goal starts from architectural survey, to establish a link among the phases of description, analysis and documentation of buildings, several problems should be taken into account.
1.2 Objective
This contribution focuses on the possibility to link and visualize the relation between a 3D representation of an architectural building and its conceptual description through a graph-browser interface.
Organize the graphical documentation according to the building morphology requires the integration of a purely geometric level to a representation semantic level concerning the studied building. Actually, the concept of shape contain all instances of the object. Instances can be represented in a digital environment, independently from their format, use, or size, considering that their geometrical nature is characterized by their spatial extension (Falcidieno & Spagnuolo, 1998). Architectural objects have a shape (spatial extension), they can be described by structures (entity collections and part-whole relationship), they have quality attributes (colours, textures, terms, etc.) and they have specific thesauri associated.
Our approach starts from the assumption that the digital model can be considered as the interface of privileged access to data and the graph is an easier and more effective tool to explain this. The steps followed to achieve this, are the following:
• decompose hierarchically a 3D model of a building and create a semantic description;
• choose the most suitable type of graph to describe the building;
• connect the graph to the 3D model;
• visualize the connection in a new interface where simultaneous queries at the graph and at the 3D model are possible.
1.3 Structure of the paper
The structure of the paper is the following:
• description of the web application used for our work and how 3D model is there structured (section 2);
• state of art about ontologies, graphs and their applications (section 3);
• description of the connections between 3D models and graph in a new visual interface trough two cases of study (section 4).
2
Web application and 3D model
2.1 Nubes VisumThe Nubes Visum project (Nubes Visum) is an integrated platform to manage 3D representations of heritage buildings, based on Web technology, created by a team of researchers of MAP GAMSAU Laboratory, CNRS, France. The platform focuses on three main aspects: description, analysis, and documentation of buildings. Organising graphic documents around the morphology of a building requires purely geometrical information to be integrated with a semantic representation of the building in question.
The system consists of a web-based application with a tripartite architecture. From a technical perspective, this system aims to respond to three distinct requirements: storage of heterogeneous data (a MySQL database is used to organise the raw survey data, the various representations and their associated information, according to different user profiles), real-time manipulation of 3D
geometric representations (a 3D interactive scene developed with Virtools DEV
is used for downloading, displaying and manipulating 3D representations),
on-line access and data management (the application is based on a website offering
user access to the data stored in the database and providing the links required for interaction between the 3D scene and the database).
The Web application is based on a dialogue between the relational SQL database and the 3D Virtools scene using PHP and Javascript via table synchronisation. Every time there is an interaction with the 3D scene: the information related to the manipulated entities is updated in SQL database and vice-versa.
2.1.1 Semantic level
The platform uses a semantic description model as a common denominator between the various potential building representations and its related information. Building's description starts when a pre-established morphological decomposition is uploaded. This representation is generally obtained by the aforementioned 3D reconstruction approach (De Luca et al, 2007). A ‘decomposition’ consists of organising items within the scene according to a compartmentalised structure, where a geometric shape is associated to each individual or ‘atomic’ concept. Since the knowledge used in a semantic decomposition of a building’s morphology is always related to an analytical objective, the descriptive phase can start at various levels of decomposition, varying according to the atomic entities that make up the architectural “ensemble”, for example built assemblies (e.g. towers, curtain walls, etc.) or architectural features (e.g. walls, roofs, openings, etc.). The decomposition is a set of morphological entities, each represented by a symbol at a point in space that indicates the entity’s central point (Reper). These points are then used to generate descriptive graphs. The descriptive model around the building morphology is defined by three distinct levels: semantic, representation, and structural levels. The semantic level is used to isolate concepts (descriptive terms) and to associate parts of the form with these concepts. The used semantic annotation (association of a concept to an entity) and the thesaurus are completely customize. This allows two things: the possibility to describe the shapes of the specific terms and the opportunity to describe entities or sub-surface entities (degradation, condition (Vallet et al, 2010), etc.).
The representation level is used to associate one or more geometric representations with each isolated concept. In choosing a representation system, is possible to select the relationships established among the atomic entities within a morphological decomposition and their different representations recorded in the database. Once a morphological entity has been selected within the 3D scene all the representations associated with it are displayed and can be downloaded from the database. In order to support the diverse range of representation techniques available today, the storage of representations is structured on the basis of three geometric concepts: point-based representations,
curve-based representations, polygonal representations. In terms of
representation, Nubes (whose technological aspects are not detailed in this article) allows the manipulation of different types' representations, including dense point clouds and meshes very detailed.
The structural level is used to establish a relationship graph between these concepts so as to organise items in the scene with respect to a descriptive requirement. Symbolic representations are used within the 3D space to show relationships (part/whole) among individual items and to provide support to the semantic description of the building morphology. The representation is a 3D graph or spatial relationship structure, whose configuration depends on the manipulation (hierarchical relationships) of a set of terms within a list. The graph is drawn using nodes that have been specifically defined: morphological
entity (taken from a morphological decomposition, is a user-identified concept to
describe the building, which may be associated with one or more geometric representations), finalised group (it is a node grouping together several morphological entities and which does not have a specific geometric representation. Its spatial extension is given as a combination of the envelopes around the entities belonging to the group), and marker (it is a particular aspect within an entity).
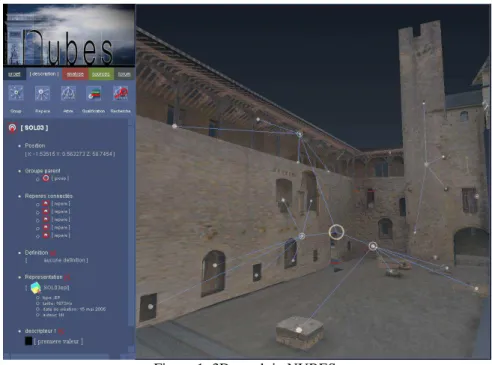
To use imported morphologic entities which a geometrical representation is associated to, the user can interactively construct a description graph, by introducing finalised groups or markers into the 3D scene (Figure 1). Creating a group means establish a concept that draws together a set of entities. Within the graph, a 3D symbol is created at the centre point of the envelope that encompasses all the selected morphologic entities. A marker can be set up by selecting any point on the geometrical representation of a morphological entity.
Figure 1: 3D graph in NUBES.
2.1.2 “Point of view”
The three descriptive levels (semantic, structural and representation), alongside the ability to classify entities using thesaurus establish what we refer to as a “point of view”. System's logic is based on the requirement of descriptive structures to be split down in order to allow a genuine freedom in data
organization. The choice of representation types, the strategy to organise entities within the description graph and the choice of terms to classify them will depend on the type of observation to be carried out from the building morphology.
3
Graphs and knowledge representations
3.1 The ontology
In computer science, an ontology is a formal representation of the knowledge through a set of concepts within a domain and the relationships among those concepts. It is used to reason about the properties of that domain, and can be used to describe the domain itself. In theory, an ontology is a “formal, explicit specification of a shared conceptualisation” (Gruber, 1993). An ontology provides a shared vocabulary, which can be used to model a domain that is the type of objects and/or concepts that exist, and their properties and relations. Ontologies are used in artificial intelligence, the Semantic Web, systems engineering, software engineering, biomedical informatics, library science, enterprise bookmarking, and information architecture as a form of knowledge representation of the world or some part of it (Arvidsson & Flycht-Eriksson, 2008).
A domain ontology model is a specific domain, which represents the particular meaning of terms as they apply to that domain. These terms are the thesauri. A thesaurus denote a collection of terms which share some meanings. In computing the thesaurus is a set of keywords that gives access to a database or vocabularies (with lists of synonyms) associated with the word processors. The main feature of a thesaurus is its ability to facilitate the terms’ search by general categories. The terms are the basic semantic units to convey concepts. They are usually single words. “Term relationships” are links among terms. These relationships can be divided into three types: hierarchical, equivalency or associative.
The ontologies are commonly encoded using ontology languages. There are a number of such languages for ontologies, both proprietary and standards-based:
Common Algebraic Specification Language, Common logic (ISO standard
24707), the Cyc project (it has its own ontology language called CycL), DOGMA (Developing Ontology-Grounded Methods and Applications), The Gellish
language, OWL (Web Ontology Language), and many other.
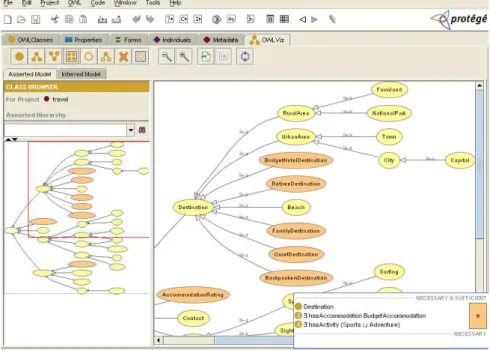
There are also applications designed to assist in the creation or manipulation of ontologies like Protégé (Figure 2). Each of these applications uses a graph to explain the ontology because it allows to read the links and hierarchies. More correctly, the hierarchical classification is a Taxonomy. It is the practice and science of classification.
Figure 2: example of a Protégé's graph
3.2 The graph
A graphs is a mathematical structure used to model pairwise relations among objects from a certain collection. A "graph" in this context refers to a collection of vertices (or nodes) and a collection of edges that connects pairs of vertices. Typically, a graph is depicted in diagrammatic form as a set of dots for the vertices, joined by lines or curves for the edges (http://en.wikipedia.org/wiki/Graph(mathematics)).
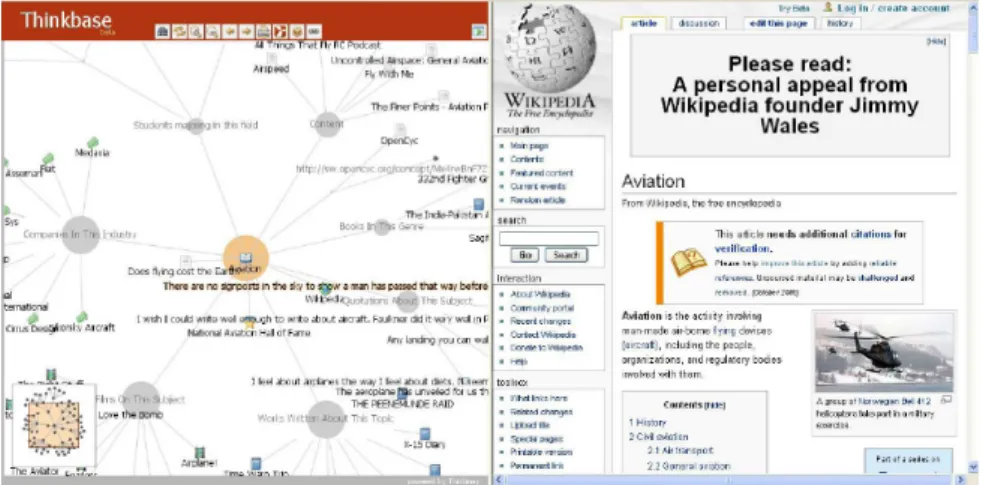
Applications of graph theory are primarily, but not exclusively, concerned with labelled graphs and various specializations of these. The link structure of a website could be represented by a directed graph (Figure 3, from http://thinkbase.cs.auckland.ac.nz/start.jsp). A similar approach can be taken to problems related to biology, computer chip design, and many other fields. The development of algorithms to handle graphs is therefore of major interest in computer science. Conceptual graphs (CGs) are a formalism for knowledge representation. In the first published paper on CGs, John F. Sowa used them to represent the conceptual schemas used in database systems.
Figure 3: Thinkbase - connection between a graph and pages of Wikipedia
3.2.1 Describe the architecture through a graph
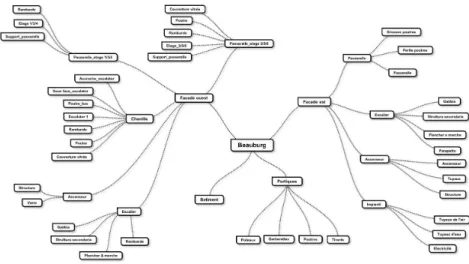
To describe an architectonic heritage trough a graph is necessary a preliminary simplification and a schematization of this. Firstly we make a semantic description of the architectural object, namely a suitable decomposing that allows to identify the hierarchical relation among the various parts. Each architectural element is composed by sub-elements according to a clear hierarchy. Then we search thesaurus in order to obtain an adequate vocabulary of terms to nominate exactly each part and then we structure a database that contains the thesauri. In the end we make a 3D model which consists of all elements that we want to interrogate and that has a hierarchical structure.
Figure 5: description graph of the Beaubourg.
While the 3D graph is created in Nubes by an expert user who knows the architectural object and the relationships among the various component parts (and which is able to assign thesaurus, attributes and descriptions), the 2D graph is conceived and created to allow an easy approach to the 3D model (and thus to improve the knowledge around the relative cultural heritage) by all those novice users.
4
Visual interface to link conceptual and morphological
representations
Firstly it is important to understand the structure of the architecture to structurate its model in Nubes, to make a split into groups, to identify the individual components and finally to search a suitable thesaurus to create a specific and appropriate vocabulary. Subsequently, on the base of the results that have been obtained, we realize a new "point of view" of three-dimensional model (section 2.1.2). Then we create groups of architectural elements to establish the various hierarchies and we qualify the parts with descriptions, attributes and thesaurus.
We add to Nubes Visum another interface to have a new approach to the stored information. This interface is divided into two parts: the 3D model and a graph. At the beginning it is possible to choose (through a menu) the project and the point of view. The 3D model appears in the left half of the screen and the 2D graph in to the right. For our work we tested two types of graph connected at two different cases of study: a tree graph from HyperGraph (http://hypergraph.sourceforge.net) connected at Chateau Comtal and
SpringGraph (http://mark-shepherd.com/SpringGraph/) connected at the Beaubourg.
In each instance the goals have to get the model linked at the graph, to obtain as much information as possible from the graph and to visualize (through an automatic movement) the part of the 3D model related to the selected node in the graph.
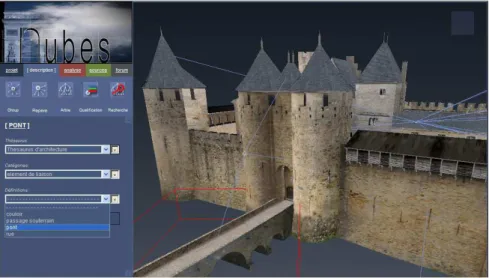
4.1 HyperGraph and Chateau Comtal
The first test was conducted on Chateau Comtal, a medieval fortress city located in Carcassonne. The 3D model and all the information about the Castle (like thesauri, qualifications, etc.) were previously inputted into Nubes Visum (Figure 6). The structure of the Castle is not vey complex, so we needed a graph to be connected at the database in order to have automatically all the information already contained in the database of Nubes and to describe the three levels of information existing in Nubes (Hiérarchie, Thésaurus and Qualifications) through a graph. For this reason we used HyperGraph.
Figure 6: allocation of the thesaurus to the 3D model in Nubes.
HyperGraph is an open source project which provides java code to work with hyperbolic geometry and especially with hyperbolic trees. It provides an extensible API to visualize hyperbolic geometry, to handle graphs and to layout hyperbolic trees. The graph structure is an array of nodes, each having the following properties: an ID like a unique identifier for the node (that can be connect at a database) and a name for each node. The data property contains a dataset (that is an array of key-value objects defined by the user) and the adjacencies (an array of strings each representing a nodes ID).
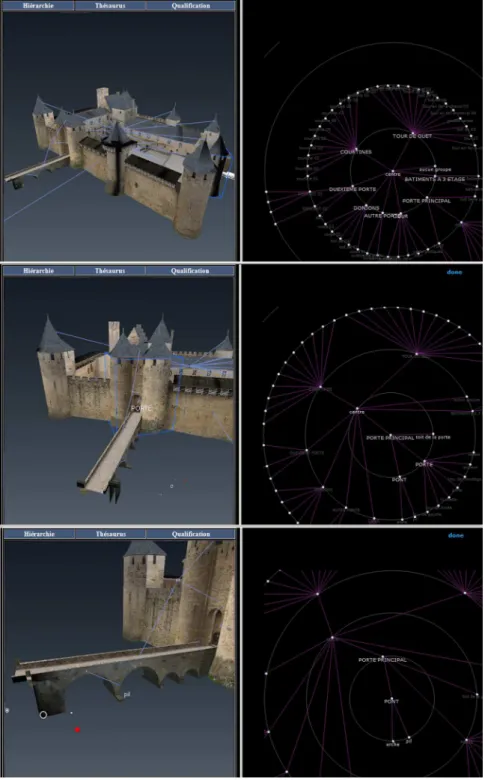
Technically, the employed graph written in JavaScript is a Hyperbolic Tree graph (a visualization technique is used to display a huge quantity of inter-related data). Its structure consists of nodes, each having as features an ID (a unique identifier for the node), a name and information about it. Being a tree structure every node can have children with the same characteristics. In a PHP script the ID of the graph nodes is connected through MySQL query to the Visum database so that each node undertakes both the name and the property from the group, the entity or the connected Reper. Each entity in Nubes Visum has a position in the 3d space (x, y, z) but also an ID used to catalog all objects on the scene in a database. In compiling the database while building the graph, each graph entity must be identified by its consistent ID in Nubes . The graph is automatically constructed in SVG format, and shows the attributes assigned by the user. This graph allows to establish a privileged link between the 3D representation of buildings and all concepts describing them in the world of knowledge. In the same PHP text it is possible to find the references to the CSS file for the graph's design and to the JavaScript file for the movements. The HT algorithm applies a Möbius transformation to the tree in order to display it with a magnifying glass effect and, with this effect, clicking on a node, it goes in the centre of the graph and at the same time also the 3D scene moves. Thanks to three buttons expressly created in the new interface, it is possible to choose which kind of information to visualize (Hierarchy, Thesauri or Qualification) and clicking on a node it becomes the center of the graph and the 3D scene. To do that, a function implemented in the 3D scene calculates the 3D object’s movement, which has been selected through the node, and place it in the middle of the scene.. The ability to conduct the conceptual navigation on three different graphs can easily meet the description of the elements of the building's vocabulary with analysis conducted on the conservation status (for example, by assigning specific attributes in Nubes).
4.2 SpringGraph and the Beaubourg
We linked the 3D model Beubourg’s of complex structure to an other kind of graph whose name is SpringGraph, an open source Adobe Flex 2.0 component that displays a set of items which are linked to each other. The component finds an appropriate dimension layout for each item, links them, and draws lines to represent the links. Inside its code folder there are: API documentation for the SpringGraph component and associated classes, source code and binaries for the SpringGraph component. There are also 2 packages: the forcelayout package which implements the iterative force-directed layout algorithm and the SpringGraph package containing the SpringGraph and Roamer components and their associated classes. This package provides for managing the item Renderers, link-drawing, timing, and other UI-related tasks. Inside the SpringGraph folder there is the SWC file: it is an archive file for Flex components and contains a SWF file and a catalog.xml file. The SWF file inside the SWC file implements the compiled component or group of components and includes embedded resources as symbols.
Flex applications extract the SWF file from a SWC file, and use the SWF file's contents when the application refers to resources in that SWC file. The catalog.xml file lists the contents of the component package and its individual components. This file contains a compiled clip, the component's ActionScript class file, and other files that describe the component:
• swf: ShockWave Flash. (animation flash, the only file that we didn't modify);
• swz: extension of the file component of Adobe platform;
• xml: eXtended Markup Language. (that contains the information about the nodes and the .jpg files for the images);
• mxml: description lenguage developed for Macromedia and after from Adobe Systems forAdobe Flex;
• html: HyperText Markup Language (for the animation);
• js: Javascript Script (for the animation);
The graph used to describe Chateau Comtal was structured according to the database and nodes which were appointed under the terms entered in the database as it directly connected to it. With SpringeGraph the connection to the database of Nubes is only through the node’s ID of the graph and each corresponding element of the 3D model. All the information are now inside the flex files and in the nodes we can obtain, for example, images instead of names. Also here if we click a node of the graph, the 3D moves itself and the selected object is displayed in the center of the window. This graph is also more manageable: the user can change it in shape, size and choose the number of levels to display. We can see the hierarchy among the elements (figures 9-10), but also display all the items of the same material (figure 11).
5
Conclusions and objectives
In this paper we discussed the complementary use of a 3D and a conceptual representation of an architectural building in order to explore new possibilities of visual browsing of complex data. The conceptual description of the building is laid on a graph-based representation of terms describing its morphology in the knowledge domain of the architectural documentation.
This first experience opens different ways for future works.
First, the possibility of using graph-based representations in order to compare the semantic description established by different profiles (architects, historians, archaeologists, engineers, etc.).
Second, the possibility of studying new solutions to link the 3D representation of a heritage building to heterogeneous documentary sources related to it. In this way, the graph-based representation could become the
common denominator to establish relationships between multiple semantically annotated media.
To test the effectiveness of the new developed interface, especially from the cognitive point of view, it will be interesting to experience the intersection of multiple descriptions (models with different levels of segmentation of the shape). This would mainly assess the limits (in terms of readability) of the dynamic graph in a morphological analysis.
References
A.I.M.A.T.S.H.A.P.E. - Advanced and Innovative Models And Tools for the development of Semantic-based systems for Handling, Acquiring, and Processing knowledge Embedded in multidimensional digital objects: http://www.aimatshape.net.
Arvidsson, F., & Flycht-Eriksson, A. (2008). OntologiesI. Retrieved November 26, 2010, from
http://www.ida.liu.se/~janma/SemWeb/Slides/ontologies1.pdf
Attene, M., Robbiano, F., Spagnuolo M., Falcidieno B. (2009). Characterization of 3D shape parts for semantic annotation. Computer-Aided Design, 41(10), 756-763.
De Luca, L., Véron, P., Florenzano, M. (2007). A generic formalism for the semantic modeling and representation of architectural elements. Visual
Computer, Springer.
Doerr, M. (2002, November). The CIDOC CRM - an Ontological Approach to Semantic Interoperability of Metadata. AI Magazine, Special Issue on Ontologies.
Dudek, I., Blaise, J-Y, Beninstant, P. (2003). Exploiting the architectural heritage's documentation: a case study on data analysis and visualisation. Proceedings of IKNOW'03. Graz, Austria. Falcidieno, B., Spagnuolo, M. (1998). A Shape-abstraction paradigm for
modelling geomerty and semantics. Procedings of the international Conference on Computer Graphics, IEEE Computer Society Press, Los Alamitos, CA.
Fedora Commons Repository Software. Open source technology to manage, preserve and link digital content: http://www.fedora-commons.org. Gruber, T.R. (1993). A Translation Approach to Portable Ontology
Specifications. Knowledge Acquisition, 5(2), 199-220.
Havemann, S., Settgast, V., Berndt, R., Eide, Ø, Fellner, D. (2008). The Arrigo Showcase Reloaded – towards a sustainable link between 3D and semantics. Proceedings of VAST.
Herbig, U., Waldhusl, P. (1997). APIS - Architectural Photogrammetry Information System. International Archives of Photogrammetry and Remote Sensing, Vol. XXXII, Part5C1B, pp. 23-27.
Knuyts, K., Kruth, J-P., Lauwers, B., Neuckermans, H., Pollefeys, M., Li, Q., Schouteden, J., Van Balen, K., Van Gool, L., Vergauwen, M. (2001). Vision on conservation: Virterf. Proceedings of International
Symposium. Virtual and Augmented Arhitecture, Springer Verlag. Dublin,. pp. 125 - 132.
Manferdini, A.M., Remondino, F., Baldissini, S., Gaiani, M., Benedetti, B. (2008). 3D modeling and semantic classification of archaeological finds for management and visualization in 3D archaeological databases. Proceedings of 14th International Conference on Virtual Systems and MultiMedia (VSMM), Cyprus: 221-228.
Nubes Visum, an integrated platform for describing, analysinig, documenting and sharing digital representations of heritage buildings,
http://www.map.archi.fr/nubes.
Salonia, P., Negri, A. (2000). ARKIS : An Information System as a Tool for Analysis and Representation of Heterogeneous Data on an Architectural Scale. Proceedings of WSCG 2000, Plzen (Czech Republic).
Vallet, J.-M., De Luca, L., Feillou, M., Guillon, O., Pierrot-Deseilligny, M., Baudry, O., Trabelsi, N. (2010). An interactive 3-dimensional database applied to the conservation of a painted chapel. Proceedings of 7th International Conference on Science and Technology In Archaeology and Conservation.
Waralak, V. (2007). Siricharoen, Ontologies and Object models in Object Oriented Software Engineering. IAENG International Journal of