http://www.diva-portal.org
Postprint
This is the accepted version of a paper published in Competitiveness Review. This paper has been peer-reviewed but does not include the final publisher proof-corrections or journal pagination.
Citation for the original published paper (version of record): Mellander, C., Florida, R., Martin, R., Pogue, M. (2015) Creativity, Clusters and the Competitive Advantage of Cities. Competitiveness Review, 25(5): 482-496
http://dx.doi.org/10.1108/CR-07-2015-0069
Access to the published version may require subscription. N.B. When citing this work, cite the original published paper.
Permanent link to this version:
1 | Page
Creativity, Clusters and the Competitive Advantage of
Cities
Roger Martin, Richard Florida, Melissa Pogue and
Charlotta Mellander
June 2015
Revision: July 2015
Martin is Institute Director of the Martin Prosperity Institute and professor of strategic management at the Rotman School of Management, University of Toronto,
(martin@rotman.utoronto.ca). Florida is director of the Martin Prosperity Institute and professor of business and creativity at the Rotman School of Management, University of Toronto,
(florida@rotman.utoronto.ca). Pogue is a research associate at the Martin Prosperity Institute at the Rotman School of Management, University of Toronto (melissa.pogue@rotman.utoronto.ca), Mellander is professor of economics, Jönköping International Business School
2 | Page Abstract:
Purpose – The article marries Michael Porter’s industrial cluster theory of traded and local clusters to Richard Florida’s occupational approach of creative and routine workers to gain a better understanding of the process of economic development.
Design/methodology/approach – Combining these two approaches, four major industrial-occupational categories are identified. The shares of U.S. Employment in each – creative-in-traded, creative-in-local, routine-in-traded and routine-in-local – are calculated and a correlation analysis is used to examine the relationship of each to regional economic development
indicators.
Findings –Economic growth and development is positively related to employment in the creative-in-traded category. While metros with a higher share of creative-in-traded employment enjoy higher wages and incomes overall, these benefits are not experienced by all worker categories. The share of creative-in-traded employment is also positively and significantly associated with higher inequality. After accounting for higher median housing costs, routine workers in both traded and local industries are found to be relatively worse off in metros with high shares of creative-in-traded employment, on average.
Social implications – This work points to the imperative for the U.S. government and industry to upgrade routine jobs, which make up the majority of all employment, by increasing the creative content of this work.
Originality/value –The research is among the first to systematically marry the industry and occupational approaches to clusters and economic development.
Keywords: Creativity, clusters, cities, metros, occupations, regional development. Paper type Research paper
3 | Page Introduction
Among the many important contributions made by Michael Porter in The Competitive Advantage
of Nations was to call attention to the central role played by industrial clusters in the process of
economic development (Porter, 1990a). He was not the first to identify the economic advantages of clustering of firms and industries, what economists refer to as “agglomeration economies.” Here he followed in the great tradition of Alfred Marshall (Marshall, 1890) and later Jane Jacobs (Jacobs, 1961). But what made his work so influential was how he identified these clusters empirically and was able to specify their role in economic development in a way that captured the attention not just of other economists and academics but also of policy makers in the real world.
There is much that is important about his work on industry clusters but perhaps the most
significant aspect was his differentiation between two key types of them (Porter, 2003). ‘Traded clusters,’ which account for about a third of U.S. employment, are the more important type for economic development. As their name implies, traded clusters are composed of industries that sell to markets beyond their local region and therefore are found clustered together in only a limited number of regions within any country and in only a select number of countries around the world. They not only provide higher wages for their workers, they are the primary source of innovation and productivity and generate all-important ‘spillovers’ that boost their local economy. Locally dispersed industries (‘local industries’), which are found evenly distributed across jurisdictions and serve only their local markets, account for the other nearly two-thirds of U.S. employment. They have lower wages, lower productivity and do not generate spillovers like traded clusters. They are dispersed relatively evenly across all jurisdictions in a country.
Porter focused primarily on the dynamics of industry clustering. That said, workers were certainly not ignored in Porter’s work. His theory holds that traded clusters tend to attract specialized human resources to their region because the multiple firms in the cluster provide a deep local labor market in the skill-sets sought by employers in that particular cluster.
4 | Page
Richard Florida came at agglomeration from the perspective of the clustering of people or talent as opposed to firms and industries (Florida, 2002). He focused particularly on the clustering of groups of talented workers he dubbed the “creative class,” spanning science and technology, arts, culture, media and entertainment, business, management and the professions. These workers were defined by the creative content of their work, which requires knowledge of field-specific information and pattern recognition as judgment and decision-making. This article will refer to this kind of work as creativity-intensive work and these kinds of workers as ‘creative workers. While the share of people in creative occupations has increased threefold in the last century, it still makes up slightly more than a third of the wage earning population in 2012.[1] Routine-intensive jobs, on the other hand, prescribe workers to carry out pre-determined commands and to undertake repetitive tasks with little independent judgement necessary to complete. A typical ‘routine worker’ may be an assembly line worker or a store clerk. This kind of work will be referred to as routine-intensive work and these kinds of workers as routine workers. Routine employment is the dominant form of work in the United States.
Like Porter, Florida also paid attention to the other related factor – industry clustering. He noted that regions that drew large proportions of creative workers also drew industries with high-paying jobs, particularly technology industries (Florida, 2002). However, Florida focused on people first and industry second.
When Roger Martin, who worked closely with Michael Porter as a colleague at Monitor Company and collaborator on Porter’s work on country competitiveness, recruited Florida to head up the Martin Prosperity Institute at the Rotman School of Management in 2007, they looked to combine the power of these two lenses – the industry lens and the occupational lens. Their first effort to marry the industry and occupational lens occurred in 2009 with the Ontario
in the Creative Age report, which applied this combined lens to the Ontario economy to better
understand the underlying connections to urban and regional prosperity (Martin Prosperity Institute, 2009).
5 | Page
This article extends that work by using the 2009 framework for linking the industrial and occupational approaches, inspired by Porter’s work, to clustering within the U.S. economy and 260 U.S. metro regions. It will examine the effects of traded clusters and local industries and creative and routine work and workers independently and together. The findings suggest that combining the two approaches can yield a better understanding of and estimates for the economic growth and development of regions.
The results of combining these two lenses also suggests that the U.S. economy has a very significant and rising challenge in dealing with the negative consequences of industry and occupational clustering, which is leaving behind a substantial part of the workforce. The authors believe that the way out of this dilemma is to dramatically increase the creative content of jobs across the U.S. economy.
The remainder of this article is organized as follows. The first section marries industrial and occupational approaches to identify four major industrial-occupational categories and determine their composition within the U.S. national labour force. The second section explores the
relationship between these four categories of work and industry on the economic performance of U.S. metro regions. The third section explores the connections between the most economically important of these categories – workers in creativity-intensive occupational categories working in traded clusters - and the earnings of all categories within metros. The final section discusses the imperative for the U.S. economy to unleash the full creative potential of workers across all industries.
Marrying Industries and Occupations
The matrix below (see Figure 1) shows how the two approaches combine to divide the economy into four basic categories: (1) creative occupations in traded industries (creative-in-traded); (2) creative occupations in local industries (creative-in-local); (3) routine occupations in traded industries (routine-in-traded); and (4) routine occupations in local industries (routine-in-local.).
6 | Page Figure 1. Four Types of Combined Industry and Occupational Clusters
Source: Authors’ analysis based on data from Florida, 2002 and Delgado et al, 2014 To populate these four categories, data was used from the 1 percent sample of the 2012
American Community Survey (ACS) Integrated Public Use Microdata Series (IPUMS) and the 5 percent sample of the 2000 Census IPUMS, both provided by the University of Minnesota (Ruggles et al, 2010). The cluster definitions used for the traded industries are based on the U.S. Cluster Mapping Benchmark Definitions (Delgado et al, 2013).[2] The definition of creative and routine occupations is based on previous work by Richard Florida (Florida, 2002, 2012). The regional analysis focuses on the 260 U.S. metro regions identified in the IPUMS database. These metros represent approximately 78 percent of the U.S. total population in 2012 and include all 52 metros with populations greater than one million. The population used in the analysis is U.S. employed wage earners. The paper examines the connection between these four key categories and key measures of regional economic performance: wages, economic output and innovation and income inequality.
7 | Page
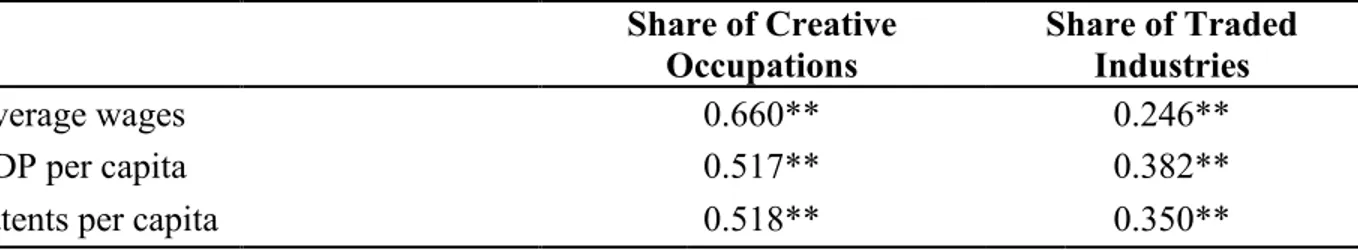
It has historically been known that having a greater percentage of workers in traded clusters is good for the economy of a metro along a number of dimensions (Porter, 2003). Likewise it has been known that having a greater percentage of creative workers is similarly beneficial (Florida
et al, 2008). As Table 1 shows, both are positively correlated with key indicators of metro
economic performance. Data sources for all metro level economic performance indicators are available at the end of this document in the notes.[3]
Table 1. Occupational and industry structures in relation to regional performance
Share of Creative Occupations Share of Traded Industries
Average wages 0.660** 0.246**
GDP per capita 0.517** 0.382**
Patents per capita 0.518** 0.350**
** Statistically significant at 1% level. N=260
Source: Authors’ calculations based on data from U.S. Census Bureau; U.S. Bureau of Economic Analysis; USPTO; Florida, 2002; Delgado et al, 2014; and Ruggles et al, 2010.
While Porter showed that working in a traded industry was important for a worker’s
productivity, measured by the wages they commanded, the above analysis demonstrates that creative occupations have a significantly greater relationship to wages, and economic output per capita, and innovation.
Now let’s look at what happens when the two approaches are combined. First, and
unsurprisingly, there is a relationship between traded industries and creative workers. Traded industries are more likely to draw on creativity-oriented workers. Within traded industries, 46 percent of workers are in a creative occupation, compared to 35 percent in in non-traded ones. This is not surprising given that the former are the industries that compete on innovation and creativity
8 | Page
Second, the creative-in-traded category generates the highest wages by far. Wages for workers in these industries average $78,690, which is 31 percent more than for creative-in-local industries ($59,990), 117 percent higher than for routine-in-traded ($36,190), and 182 percent more than for routine-in-local ($27,840).
Figure 2 shows the relative sizes of the four categories and the degree to which each category has a higher or lower average income compared to the U.S. national average.
Figure 2. Average wage comparison and employment composition by occupation and industry clusters
9 | Page
The challenge for equality and opportunity in the modern economy is that the routine-in-local workers earn by far the lowest wages on average and make up by far the largest category – 44.8 percent of workers. The best off, the creative-in-traded workers, earn a 78.5 percent premium on average and make up the smallest share at 13.9 percent of workers.
Third, the shift over time in both the proportions of workers in each category and the relative wages is worrisome (Figure 3). While the proportion of workers in the highest-earning creative-in-traded category rose from 13.3 percent to 13.9 percent between 2000 and 2012, the routine-in-local category increased by twice as much, from 43.5 percent to 44.8 percent (1.3 percentage points versus 0.6 percentage points). Furthermore, the wage differentials have widened with creative-in-traded rising from 74.0 percent to 78.5 percent above the national average wage and routine-in-local falling from 31.7 percent to 36.8 percent below average. This has the effect of exacerbating inequality and suggests that, if anything, the gap between the more and less advantaged categories of workers is likely to continue widening over time.
10 | Page Figure 3. Change in occupational and industry wage and employment shares between 2000 and 2012
Industries and Occupations at the Metro Level
Both Porter and Florida note the geographic concentration of traded clusters and creative
occupations respectively. When the two approaches are combined and charted, the distribution of creative-in-traded employment across U.S. metros is seen to be highly concentrated, uneven and spiky. The range is from less than 4 percent in the least concentrated and least developed metro in the 260 sampled metros (El Centro, California at 3.9 percent) to a third of employment in the most concentrated and most advanced metros (San Jose-Sunnyvale-Santa Clara, California at 33.0 percent).
Table 2 shows the leading and lagging large metros (those with more than one million people) for share of creative-in-traded employment. The leading large metros reads like a who’s who of leading knowledge and tech hubs. San Jose tops the list, followed by San Francisco, Boston, Raleigh and Seattle. Washington DC, Austin, Denver, the Twin Cities of Minneapolis-St. Paul and Hartford round out the top ten. Conversely the lagging metros are a mix of Sunbelt and Rustbelt centers.
11 | Page Table 2. Top and Bottom 10 metros with population over one million by share of
creative-in-traded employment Rank out of
260 Metro Share of Creative-in-traded (%)
1 San Jose-Sunnyvale-Santa Clara, CA 33.0 8 San Francisco-Oakland-Hayward, CA 23.1 15 Boston-Cambridge-Newton, MA-NH 21.3 16 Raleigh, NC 21.3 17 Seattle-Tacoma-Bellevue, WA 21.0 19 Washington-Arlington-Alexandria, DC-VA-MD-WV 20.7 24 Austin-Round Rock, TX 19.8 27 Denver-Aurora-Lakewood, CO 19.0 28 Minneapolis-St. Paul-Bloomington, MN-WI 18.8 29 Hartford-West Hartford-East Hartford, CT 18.5 123 Miami-Fort Lauderdale-West Palm Beach, FL 11.8
125 New Orleans-Metairie, LA 11.7
130 Louisville/Jefferson County, KY-IN 11.4 131 Virginia Beach-Norfolk-Newport News, VA-NC 11.4
138 Oklahoma City, OK 11.2
143 Jacksonville, FL 11.0
158 Memphis, TN-MS-AR 10.3
191 Las Vegas-Henderson-Paradise, NV 9.0
206 Riverside-San Bernardino-Ontario, CA 8.3
Source: Authors’ calculations based on data from U.S. Census Bureau; Florida, 2002; Delgado et al, 2014; and Ruggles et al, 2010.
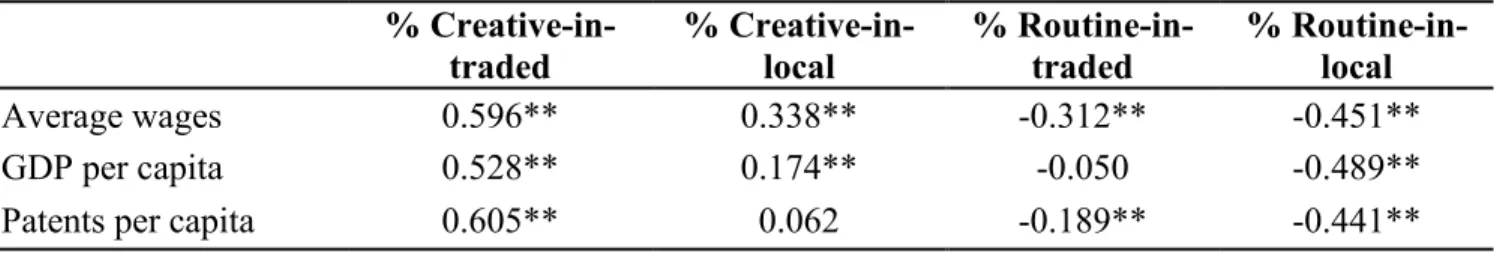
Porter and Florida both note that a region with a higher proportion of traded clusters or creative workers, respectively, will have higher wages and overall prosperity (Porter, 2003; Florida et al, 2008). Table 3 shows the connection between the four broad categories and regional economic performance based on standard measures of economic output per capita, average wages, and innovation (measured as patents per capita).
12 | Page Table 3. Correlation table of key indicators
% Creative-in- traded % Creative-in- local % Routine-in- traded % Routine-in- local Average wages 0.596** 0.338** -0.312** -0.451** GDP per capita 0.528** 0.174** -0.050 -0.489** Patents per capita 0.605** 0.062 -0.189** -0.441** ** Statistically significant at 1% level.
N=260
Source: Author’s calculations based on data from U.S. Census Bureau; U.S. Bureau of Economic Analysis; USPTO; Florida, 2002; Delgado et al, 2014; and Ruggles et al, 2010.
The share of creative-in-traded jobs is strongly associated with metro economic performance, with positive correlations to economic output per capita, wages and innovation (in the range of 0.4 to 0.6). The correlations for creative-in-local jobs are also mainly positive and significant but substantially weaker than for creative-in-traded (in the range of 0.17 to 0.38) and in the case of patents statistically insignificant. Conversely, a higher proportion of in-traded or routine-in-local workers is negatively and significantly correlated with all the above measures of
regional economic performance (except insignificantly so for routine-in-traded for GDP per capita).
It is important to note that wages are generally higher in traded industries due to their higher intensity of both human capital and physical capital. This paper partially captures the effect of higher human capital intensity by adding a second occupation dimension which separates occupations into routine and creative. Since creative occupations are more likely to have higher levels of human capital (Florida, 2012) this partially captures the effects of higher human capital intensity in areas with higher shares of traded industries.
Market size also undoubtedly plays a significant role in the ability for the industry clusters to achieve critical mass. To account for this, a partial correlation analysis based on the log of population was used to control for market size. The results of this analysis remain more or less the same as the single correlations shown in the paper without the addition of population.[4]
13 | Page
So it is clear that metros where creative-in-traded employment makes up a bigger share of the economy, the metro has better overall economic performance. The question remains as to how these gains are distributed. It would be naïve to assume that the benefits of these creative-in-traded categories simply trickle down to the other clusters and groups of workers. There is already one signal that this may not be the case -- the much higher wages and salaries commanded by creative-in-trade workers suggests that they may be coming away with a disproportionate share of these economic performance gains.
One way to get at this is to see if there is a connection between the share of creative-in-traded employment and inequality. Table 4 reports the results of a simple correlation analysis
comparing the share of creative-in-traded employment to the standard measure of income inequality based on the Gini coefficient. The correlations confirm the suspicion that the overall gains from creative-in-traded clustering are unevenly distributed within metros. The proportion of creative-in-traded is positively and significantly correlated with higher inequality. That is, metros with higher intensity of creative-in-traded employment experience greater levels of income inequality. This is consistent with the literatures on the increasing returns to knowledge work and of skill-biased technical change (Acemoglu, 1998; Autor et al, 1998, 2003, 2006; Goldin and Katz, 2008).
Table 4. Correlation table for income inequality
% Creative-in- traded % Creative-in- local % Routine-in- traded % Routine-in- local Income inequality 0.306** 0.050 -0.195** -0.108 ** Statistically significant at 1% level.
N=260
Source: Authors’ calculations based on data from U.S. Census Bureau; Florida, 2002; Delgado et al, 2014; and Ruggles et al, 2010.
Neither shares of creative-in-local nor routine-in-local employment is significantly correlated with inequality. However a higher proportion of routine-in-traded is negatively and significantly correlated with inequality. In other words, metros with greater shares of routine-in-traded
14 | Page
effects on inequality of higher-wage but lower skilled manufacturing jobs (Autor et al, 1998, 2003, 2006; Goos and Manning, 2007; Goos et al, 2009). The problem of course is that these are exactly the kinds of jobs that have been disappearing as a consequence of automation and
globalization. As Figure 3 shows, this is the one category of work that has declined as a share of employment between 2000 and 2012.
This suggests that there are discrete winners and losers in an economy where workers in
creative-in-traded categories power innovation and economic growth. To get at this, a correlation analysis was conducted to look at the relationship between the shares of creative-in-traded
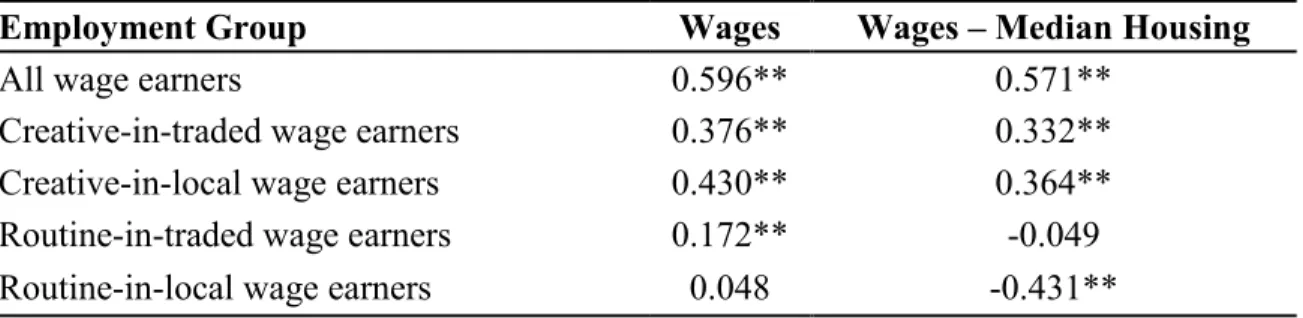
employment in each metro and the wages for each of the four categories of workers. The analysis looked at both the wages these workers take home and the amount of these wages that are left over after paying for housing. This is because housing costs eat up the largest share of wages and also because housing costs tend to be higher in metros with bigger shares of creative-in-traded categories.
Table 5. Correlations for economic performance variables
Employment Group Wages Wages – Median Housing
All wage earners 0.596** 0.571**
Creative-in-traded wage earners 0.376** 0.332** Creative-in-local wage earners 0.430** 0.364** Routine-in-traded wage earners 0.172** -0.049 Routine-in-local wage earners 0.048 -0.431** ** Statistically significant at 1% level.
N=260
Source: Author’s calculations based on data from U.S. Census Bureau; Florida, 2002; Delgado et al, 2014; and Ruggles et al, 2010.
First, the good news: the creative-in-traded category tends to lift both wages overall and the wages of three of the four major categories. As Table 5 shows, metros with larger shares of workers in the creative-in-traded category have higher wages overall. And considerable benefits extend to these traded workers themselves. The greater the proportion of creative-in-traded employment in a metro, the more its creative-in-creative-in-traded workers earn on average. So,
15 | Page
overall, it is much better for a creative-in-traded worker to be in San Jose-Sunnyvale-Santa Clara where creative-in-traded workers earn $117,630 on average, as opposed to El Centro where creative-in-traded workers earn $48,450 on average.
This good news extends to creative workers in local industries, the creative-in-local category. Their wages also rise alongside the creative-in-traded intensity (with a positive and significant correlation of 0.430). Interestingly and perhaps surprisingly, the correlation here is even stronger than for creative-in-traded workers.
The positive story also extends to routine workers in traded industries, those in the routine-in-traded category who also gain a wage boost in metros with high creative-in-routine-in-traded intensity, though it is not as substantial as for the two categories of creative workers (with a positive and significant correlation of 0.172).
But, this is where the positive impact on metro wages ends. There is no connection between the employment intensity of the creative-in-traded category and the wages of routine workers in local industries. The creative-in-traded category has no effect on their wages with an
insignificant correlation of 0.048.
The story is much different, and much less rosy, however, when wages these groups of workers take home after paying for median housing costs in each metro is examined.[5] This is important because the presence of more knowledge-based and export-oriented wage earners, who are associated with higher productivity and higher incomes in metros, tends to be translated into higher metro housing costs.
The second column in Table 5 shows how the picture changes when the wages that are left over after median housing costs are factored in. The two groups of creative workers – workers in the creative-in-traded (0.332) and creative-in-local categories (0.364) – still are relatively better off. Their wages rise enough on average to more than cover the increased costs of housing associated with living in a more expensive creative-in-traded intensive metro.
16 | Page
But two groups of workers are not better off. Routine workers in traded clusters essentially gain no benefit since the correlation is statistically insignificant. And routine workers in local
industries are significantly worse off with a negative correlation of -0.431.
Note the clear divide between the four main categories of workers. The two categories of creative workers do better after paying for median housing, while the two categories of routine workers do worse. These two categories account for the majority of all workers and they are being left behind.
The implications of this pattern are stark. It both is associated with rising inequality and to the sorting and separation of the new economy’s winners and losers. The higher wages offered in metros with larger creative-in-traded employment creates substantial incentives for more skilled and advantaged workers to migrate to these metros. As housing costs rise, routine workers, especially those in routine-in-local jobs, are shunted off to less expensive metros which, by definition, have smaller concentrations of creative-in-traded workers. This creates a vicious cycle of sorts where the advantaged get more advantaged over time while the disadvantaged sink further. This also likely increases the commute times of routine-in-local workers who must live farther and farther away to afford housing and fall outside various professional and knowledge networks that are important for upward mobility. This sorting process also means that the children of more advantaged categories of workers gain access to many other advantages like better schools, lower crime rates, better extra-curricular activities which compound their advantages over time. In fact, research by Rebecca Diamond (Diamond, 2015) finds that these differences in the inequality of well-being is at least 30 percent over and above than what can be explained by the wage gap between college and high school graduates.
Porter showed that the shares of traded industries in metros were not equally distributed throughout the U.S. and that those areas with high shares of traded industries also had higher wages – not just for those in traded industries but also overall (Porter, 2003). This analysis has extended the work initiated by Porter to include the role of creativity-intensive occupations and the role played by median housing costs. The analysis finds that there is great variation in shares of creative workers in traded industries across the U.S. metros, and that these are connected to
17 | Page
substantially divergent outcomes for workers across those metros based on their differences in average wages and median housing costs. In particular, it is creative workers working in traded industries who have experienced the greatest benefit from clustering in metro areas. While these metros have higher wages and incomes overall, the bulk of these gains are captured by creative workers with little in the way of benefit trickling down to routine workers. Indeed, inequality is higher in metros with greater shares of creative-in-traded employment.
Closing the Gap
The above analysis adds important context to the modern economic challenge for the U.S. economy. The creative-in-traded category is greatly related to economic growth. The size of this is growing, as is the huge wage premium over the average American worker that is earned by workers in this category. However, the size of the routine-in-local category is also increasing and the negative gap between what its members earn compared to the average is also widening. These two things in combination are connected to the growing income inequality in America. In addition, given that membership in the routine-in-local category is nearly 50 percent of the workforce and heading higher, nearly half of the American workforce is stuck in low and declining wage employment, nearly guaranteeing the continued stagnation of earnings of the American middle class.
In the modern economy, the prerequisite for personal and family prosperity is to hold a creativity-intensive job, preferably one in a traded industry. Though it might be thought that holding a routine job in a traded cluster in a creativity-intensive metro can still be a route to an attractive economic future, it is simply not the case most of the time. On average, housing costs simply eat away all of the economic advantages of cluster and location.
Worse yet, holding a routine job in a local industry is more likely to produce an unattractive economic outcome regardless of in what metro that job happens to be. Tragically, the better off the metro is, the worse the economic situation is related to the large number of workers doing routine jobs in local industries.
18 | Page
The economic challenge is clear. While the proportion of creative jobs is inching upward slowly, it is occurring at a glacial pace – on average 1.4 percent per year over the past half-century.[6] All other things equal, at the current rate it will take another 25 years to hit the breakeven point at which there will be as many creative jobs as routine jobs. In the meantime, the income inequality related to the stagnation of the routine-in-local jobs, in particular, combined with the continued rise of the earnings in the creative-in-traded jobs will tend to be accentuated.
In order to stem the tide of rising inequality, a transformation in how work is structured and valued is now necessary. The economy can’t depend solely on the slow substitution of creative jobs for routine jobs. The creative content of routine jobs needs to be enhanced.
Governments have contributed by increasing the supply of workers capable of specialized creativity-intensive work through a broadly available primary and secondary educational infrastructure and an increasingly robust tertiary educational sector. For the years 2010 to 2012, only 41 percent of young Americans aged 30-34 have completed tertiary education.[7]
Governments will have to continue to expand the tertiary sector to ensure the supply of workers best suited for creativity intensive work.
The deeper challenge is on the demand side and lies in the hands of the business community. Business must lean into the wind and provide opportunities for their employees to draw on their full creative potential. To do so, it must create the environments that add creativity (via
independent judgment and decision-making) to routine work.
Currently, there is a self-fulfilling prophecy in the routine sector of the economy. If employers discourage or prohibit independent judgment and decision-making, these jobs can become and remain routine jobs. These low-paid, low skill jobs will never add to the bottom-line and never attract the kind of applicant that would have the skills to make it a more creative job, setting in motion a vicious cycle.
If instead, employers purposefully create workplace environments that promote employee
19 | Page
improve productivity and enable the employer to profitably pay higher wages. Ultimately, it may attract better talent to these positions, creating instead a virtuous circle
In this way, the creative-intensity of routine jobs can increase and indeed hasten the replacement of routine jobs with creative jobs. While there are undoubtedly those who would argue that this is impossible – believing that routine jobs will always be routine jobs – history shows that
leading companies have won in their industries in part by encouraging independent judgment and decision-making from their routine employees.
Toyota, which rose from being a small Japanese player to become the most successful automobile manufacturer in the world, did so by encouraging independent judgment and
decision-making by employees on the plant floor. The famed Toyota Production System turns on the recognition that judgement and decision-making by factory workers contributes to higher quality and lower costs. Famously, every worker contributes to continuous improvement and each has the authority to ‘pull the Andon cord’ to shut down the plant’s entire assembly line if the worker sees a quality problem that would be better solved immediately than allowed to produce a number of flawed vehicles that would later have to be repaired.
In the service sector, Four Seasons Hotels and Resorts is the largest and, along many dimensions, the most successful global luxury hotel chain. In an industry featuring low wages and employee turnover of approximately 60 percent a year, Four Seasons has extremely loyal, low-term staff earning industry-leading wages. The basis of its performance advantage is a belief that in order to provide the best customer service experience in the industry, each member of the hotel staff has to have the independent judgment and decision-making authority to address the immediate needs of the guest. Famously, Four Seasons has no customer service department. Every single staff person in the hotel from manager to maid to bellhop is responsible for delivering highest quality and customized guest service.
Retailing is typically seen as the epicenter of low-paying, dead-end routine jobs. But MIT’s Zeynep Ton has shown how retailers like convenience store QuikTrip, supermarkets Trader Joes and Whole Foods, and home improvement chain Costco have made it a central feature of their
20 | Page
strategies to provide more independent judgement and decision making authority and provide workers with commensurately higher wages. The result is a virtuous circle of higher wages, higher sales, lower employee turnover, superior customer service, improved productivity, and striking competitive success (Ton, 2014).
While these are only a few examples, they demonstrate the strikingly different ways jobs can be improved and the impact this can have on company productivity and profitability. The creative-intensity or routine-creative-intensity of a given job is not pre-determined and fixed. It is constructed by the employer in conjunction with the employee. If both conspire to define it as involving minimal independent judgment and decision-making, it will remain a low-paid job, which will barely enable the worker to live in a prosperous city and will provide little or no hope for a prosperous future for its holder and family. If instead, the employer provides both the support for and the pressure in the form of encouragement for the individual to demonstrate increasing levels of independent judgment and decision-making in that job, the employer will be able to pay a higher wage for the job and the employee will build their creative skills.
That is the fastest and most productive way forward for the U.S. economy; the transformation of a routine-intensive economy into a creativity-intensive one.
Conclusion
Michael Porter was instrumental in thinking about economic performance in regions; that national performance is made up of many smaller regions and that the performance of regional economies differs by industry composition. He championed the idea that regional policies should be accommodating of individual circumstances. The analysis in this paper adds to his insight that regions also vary by the creative content of their workers, and that when creative workers are employed in traded industries, they have productivity gains greater than those just employed in traded industries.
The evolution of this new economy closely related to clusters of traded industries and agglomerations of creative workers presents us with both great opportunities and substantial
21 | Page
challenges. The creative-intensity of the economy has grown substantially. But it is supported by a routine economy of workers who are not participating in the economic upside. To prosper in the global economy, every region and every industry must boost the creative content of all work while continuing to encourage and support the growth of creative jobs in traded clusters.
Notes
1. Previous research by Florida has used data from the Occupational Employment Statistics at the Bureau of Labor Statistics whereas this paper takes its data from the American Community Survey at the U.S. Census Bureau. Consequently, these figures may not be comparable with prior research conducted by Florida.
2. The Delgado, Porter, and Stern definition for traded industries are identified at the 6-digit NAICS level, while the ACS IPUMS database identifies industries at the 4-digit NAICS level. The industry variables are expanded based on the proportion of the national or metropolitan employment (for the corresponding analysis) at the 6-digit NAICS level within the 4-digit NAICS level using employment for the analogous year from:
a. U.S. Census Bureau, County Business Patterns, Complete Metropolitan Area, and Complete U.S. File, 2012 and 2000
In some cases, metro level data may be missing from the CBP at the 6-digit NAICS level. In these cases, national level proportions are used to expand and weight the 4-digit
NAICS into 6-digit NAICS.
For the purpose of this analysis, all other industry codes than those in traded industries are included in the local industries rather than those used by Delgado, Porter, and Stern. 3. Data sources for the metro level economic performance variables are:
a. Average wages: Author’s calculations based on 1% sample of the 2012 American Community Survey (ACS) Integrated Public Use Microdata Series (IPUMS) b. GDP per capita: U.S. Bureau of Economic Analysis, Per capita real GDP by
metropolitan area (chained 2009 dollars) for the year 2012.
c. Population: U.S. Bureau of Economic Analysis, Population by metropolitan area for the year 2012.
22 | Page
d. Personal Income per capita: U.S. Bureau of Economic Analysis, Per capita personal income by metropolitan area for the year 2012.
e. Patents per capita: Author’s calculations based on United States Patent and Trademark Office, Patent in technology classes breakout by origin, U.S.
Metropolitan and micropolitan areas, Count of 2000-2013 Utility Patent Grants, Average of years 2010-2012; and U.S. Bureau of Economic Analysis, Population by metropolitan area for the year 2012.
f. Income inequality is captured by the GINI for each metro: U.S. Census Bureau, American Community Survey, 2012 American Community Survey 1-Year Estimates, All Metroplitan and Micropolitan Statistical Areas within United States, Table B19083, using American FactFinder. Correlation results for wages and wages after housing in relation to the share of creative-in-traded share of the labor market.
4. The results of the partial correlation analysis for all correlations are available from the authors upon request.
5. Median housing values in metros come from: U.S. Census Bureau, American Community Survey, 2010-2012 American Community Survey 3-year Estimates, Median Monthly Housing Costs (Dollars), All Metropolitan and Micropolitan Statistical Areas within United States, Table B25105, using American FactFinder. To calculate the yearly values used in the paper, the median monthly value for each metro is multiplied by 12.
6. Using compound annual growth rates.
7. Based on author’s calculations using the 3-year 1% sample of the American Community Survey based on the IPUMS database.
References
Acemoglu, D. (1998), “Why do new technologies complement skills? Directed technical change and wage inequality”, The Quarterly Journal of Economics, Vol. 113 No. 4, pp.
23 | Page
Autor, D.H., Katz, L.F. and Krueger, A.B. (1998), “Computing inequality: have computers changed the labor market?”, The Quarterly Journal of Economics, Vol. 113 No. 4, pp.
1169-1213.
Autor, D.H., Levy, F. and Murnane, R.J. (2003), “The skill content of recent technological change: an empirical exploration”, The Quarterly Journal of Economics, Vol. 118 No. 4,
pp. 1279-1333.
Autor, D.H., Katz, L.F. and Kearney, M.S. (2006), “The Polarization of the U.S. Labor Market”, working paper No. 11986, National Bureau of Economic Research. Bischoff, D. and Reardon, S.F. (2014), “Residential segregation by income, 1970- 2009”, in Logan, J. (Ed.), Diversity and Disparities: America Enters a New Century, Russell Sage Foundation, New York, NY.
Delgado, M., Porter, M.E. and Stern, S. (2014), “Defining Clusters of Related Industries”, working paper No. 20375, National Bureau of Economic Research.
Diamond, R. (2015), “The Determinants and Welfare Implications of US Workers’ Diverging Location Choices by Skill: 1980-2000”, working paper, Stanford
Graduate School of Business, Stanford University, Stanford, CA, 18 February. Florida, R. (2002), The Rise of the Creative Class, Basic Books, New York, NY.
Florida, R. (2012), The Rise of the Creative Class Revisited, Basic Books, New York, NY. Florida, R., Melander, C. and Stolarick., K. (2008), “Inside the Black Box of Regional Development – human capital, the creative class and tolerance”, Journal of Economic
24 | Page
Goldin, C.D. and Katz, L.F. (2008), The race between education and technology, Harvard
University Press, Cambridge, MA.
Goos, M. and Manning, A. (2007), “Lousy and Lovely Jobs: The Rising Polarization of Work in Britain”, Review of Economics and Statistics, Vol 89 No. 1, pp. 118-133.
Goos, M., Manning, A. and Salomons, A. (2009), “Job Polarization in Europe”, The
American Economic Review, Vol. 99 No. 2, pp. 58-63.
Jacobs, J. (1961), The Death and Life of Great American Cities, Random House, New York, NY.
Marshall, A. (1890), Principles of Economics, 8th ed., Macmillan, London.
Martin Prosperity Institute (2009), Ontario in the Creative Age, February, available at:
http://martinprosperity.org/media/pdfs/MPI%20Ontario %20Report%202009%20v3.pdf
(accessed May 25, 2015).
Porter, M.E. (1990a), The Competitive Advantage of Nations, The Free Press, New York, NY.
Porter, M.E. (1990b), “The Competitive Advantage of Nations”, Harvard Business
Review, Vol. 68 No. 2, pp. 73 – 91.
Porter, M.E. (2003), “The economic performance of regions”, Regional studies, Vol. 37 No. 6-7, pp. 545-546.
Ruggles, S., Alexander J.T., Genadek, K., Goeken, R., Schroeder, M.B. and Sobek, M. (2010), Integrated Public Use Microdata Series: Version 5.0 [Machine-readable database], University of Minnesota, Minneapolis, MN.
25 | Page
Ton, Z. (2014), The Good Jobs Strategy: How the Smartest Companies Invest in Employees to