1
Uppsala University Annual Bibliometric Monitoring 2019
Per Ahlgren1, Leif Eriksson1, Daniel Wadskog2, and Erik Åkesson Kågedal2 1 Planning Division, Uppsala University
2 Uppsala University Library
1 Introduction
Nowadays, and in several countries in the world, bibliometric evaluation of research is performed to a quite large extent. In the Swedish context, bibliometric analysts at Karolinska Institutet and KTH Royal Institute of Technology, for instance, perform annual bibliometric analyses of the publication output of these universities.
Uppsala University (UU) Annual Bibliometric Monitoring (ABM) produces statistics on publication volume, publishing level, citation impact, collaboration (in terms of co-publishing) and open access (OA). The aggregation level is primarily department, which means that it is primarily the departments of UU that are the units of analysis in ABM. However, the first subsection of the results section below reports outcomes for UU as a whole.
Values of several bibliometric indicators are obtained for the departments included in ABM. Indicator values are obtained by publication year. However, 3-year moving averages are generally applied. In “Quality and Renewal 2017” (“Kvalitet och förnyelse 2017”) (Malmberg et al., 2017), the peer assessments were complemented with a bibliometric report. One conclusion of the exercise was that an annual bibliometric report was desirable. The ABM 2019 is a response to this conclusion and presents extensive bibliometric statistics with regard to the UU departments.
The remainder of this report is structured as follow. Section 2 treats the data and methods of ABM. The results of ABM are reported in Section 3, whereas the results are briefly discussed in Section 4. Concluding remarks are given in Section 5.
2 Data and methods
Two main data sources are used in ABM: the local publication database of UU, DiVA, and the in-house version of Web of Science (WoS) database available at the Centre for Science and Technology Studies (CWTS) at Leiden University, the Netherlands. The latter database is accessed via CWTS Monitor, a tool for bibliometric analysis of WoS publications and provided by CWTS. We used version 2019/2 in ABM 2019. DiVA data, or more precisely DiVA data as it appear in GLIS (Generellt Lednings Informations System), are used for the analysis according to the Norwegian model, whereas CWTS Monitor is used for the analysis of citation impact and collaboration. For OA, DiVA data is used from DiVA directly but combined with data from GLIS, WoS1, and Directory of Open Access Journals
(DOAJ).
In the Norwegian model, as well as in the citation analyses in ABM, author fractionalization is used. An author of a publication is assigned 1/n of the publication, where n is the number of authors of the publication. The fraction of the publication assigned to a given UU department is the sum of the author fractions with regard to the authors affiliated to the department. Note, though, that if an author is affiliated to m (m ≥ 2) UU departments in a publication, the author contributes with 1/(n × m) author fraction to all m departments (see Appendix 2).
1 Since WoS does not cover all UU publications, the levels of different OA classes might vary between different research fields. We use, however, information in DiVA and DOAJ to classify all UU publications, even those not covered by WoS.
2 In the citation analyses and in the collaboration analyses of ABM, only the WoS publication types “Article” and “Review” are taken into account. Further, in these two types of analyses, only core publications are used. Core publications are publications in international scientific journals in fields that are suitable for citation analysis.2 In the citation analyses, author self-citations are excluded. A citation
is counted as an author self-citation if the citing and the cited publication have at least one common author name.
For open access, we use whole counts at the department level: each affiliated department is assigned the publication. OA is measured by defining the open access status for each publication and counting the number of publications affiliated to each department.
We use the following condition for department inclusion in the Norwegian model, the collaboration and the OA analyses:
(a) The researchers of the department have not their main affiliation to another unit.
Information on (a) was obtained from the offices for the three scientific domains of UU. These three domains are Humanities and Social Sciences (HumSam), Medicine and Pharmacy (MedFarm), and Science and Technology (TekNat).
With regard to the citation analyses of ABM, the following two inclusion conditions are applied. (a) the researchers of the department have not their main affiliation to another unit, and
(b) the department has at least 40 publications (of the types “Article” and “Review”) in the period 2010-2017.
For each table below that reports citation analysis results, the expression “null” in a cell indicates that condition (a), but not condition (b), is satisfied by the department corresponding to the row of the cell.
2.1 The Norwegian model
The Norwegian model considers publishing volume and publishing level. For level, the model does not use citations. Instead, the model takes into account the extent to which publications from a unit of analysis are published in publishing channels with large prestige. The channels that are considered in the model are journals, publishers and series. A large number of channels have been assessed in Norway by subject experts and assigned to one of three levels: level 0 (non-scientific channel), level 1 (scientific channel), and level 2 (scientific channel with extra-large prestige).
The Norwegian model comprises three publication types: article in journal or series, article in anthology and monograph. Conference papers are taken into account. If the host publication of a conference paper belongs to a series, the paper is classified as article in journal or series, otherwise the paper is classified as article in anthology. The weight of a publication is determined by its type and by the level of its channel. How publications are weighted is reported in Table 1.
Table 1. The weights of the Norwegian model as a function of publication type and publishing level. Publication type Level 1 Level 2
Article in journal or series 1 3
Article in anthology 0,7 1
Monograph 5 8
The publishing channels at level 2 in a given research field should publish a certain proportion (20%) of the publications of the field. By this rule, comparisons across fields are fairer, compared to if a certain number of channels, constant across fields, had been stipulated for level 2. The reason for this is that the
2 For more on core journals, see the CWTS Leiden Ranking page https://www.leidenranking.com/information/indicators.
3 access to level 2 channels becomes more equal across fields. Note that the proportion publications at level 2 for a given unit of analysis can be seen as a quality indicator (Schneider, 2009).
Some publications are excluded in analyses according to the Norwegian model, for instance: Letter to the editor
Working reports
Publications where the author has editorship Popular scientific publications
Each unit of analysis is assigned a publication score, a weighted expression for publishing volume and publishing level. The scores are obtained by multiplying author fractions by weights. For example, the publication score for a department, for a given publication year, with respect to articles published in level 2 journals is equal to the sum of the department author fractions over the articles (published in the year) multiplied by 3, the weight for a an article published in a level 2 journal (Table 1).
In ABM, each considered UU department is assigned a publication score for each considered publication year. In the application of the Norwegian model, the publication period is 2011-2018.
2.2 Field normalized citation impact
An important principle in evaluative bibliometrics is to compare like with like. It is a fact that citation volumes are not equal across research fields. For instance, the volumes are considerably larger in biomedicine than in pure mathematics. This is due to different citation practices in the two fields. If publications from fields as these two should be compared with regard to citation impact, some form of normalization of raw citations scores should be performed. In ABM, all used citation impact indicators are field normalized.
The publication period used for the citation analyses is 2010-2017. The end publication year in the version of CWTS Monitor used is 2017. Further, a later end year than 2017 would not be proper due to an inappropriately short citation window.
ABM makes use of two kinds of field normalized citation indicators: publication-level indicators and journal-level indicators. In the next section, we treat the former ones, whereas the latter ones are treated in the section after the next section.
Publication-level indicators
Two publication-level indicators are used, namely mean normalized number of citations per publication (MNCS) and proportion of frequently cited publications (top 10%) (PP(top 10%)). These two indicators, which complements each other, are used, for instance, in the CWTS Leiden Ranking 2019.3 For both
MNCS and PP(top 10%), and for the two journal-level indictors described below, a subject classification of publications is used for normalization purposes. The classification is generated by application of an advanced clustering methodology, in which a publication-publication relatedness measure based on direct citations between publications is utilized (Waltman & van Eck, 2012). The classification, which contains about 4,000 classes, is such that each publication belongs to exactly one class.4
Regarding MNCS, and for each publication from a given department, the citation score of the publication is divided by the mean citation score across the publications, published in the same year as the publication, in the class to which the publication belongs. The resulting value is a (field) normalized
3 http://www.leidenranking.com/
4 The traditional approach to field normalization typically uses the journal subject categories in WoS. However, one problem with the traditional approach is that the subfields of a certain field, where the fields are defined at a given level of granularity, might differ substantially from each other in terms of citation volume (e.g., van Eck et al., 2013). Moreover, it is clearly more reasonable to group the publications themselves into subject classes than to group the publications into such classes based on subject class membership of their journals.
4 citation score (NCS) for the publication. The MNCS for the department is then obtained by dividing the weighted sum of NCS values over the publications from the department–where the weight of a publication consists of the author fraction the department has of the publication–by the sum of the department author fractions over the publications. If the department has a MNCS of, say, 1.2, the department performs 20% above world average (= 1).
For PP(top 10%), and publication i from the department, the same class in the classification is used as in the calculation of the NCS for i. The citation score distribution for the class, with respect to publications published the same year as i, is obtained, and the extent to which i belongs to the 10% most frequently cited publications is determined. The result for i is a value in the interval [0, 1], say (top 10%)i.5 PP(top 10%) for the department is then obtained by dividing the weighted sum of (top 10%)
values over the publications from the department–where the weight of a publication consists of the author fraction the department has of the publication–by the sum of the department author fractions over the publications (cf. the calculation of MNCS). If the department has a PP(top 10%) value of, say, 8, the department performs 20% below the world average (= 10).
Journal-level indicators
The two publication-level citation indicators are complemented by two corresponding journal-level citation indicators, namely mean normalized journal impact score per publication (MNJS) and mean journal proportion of top 10% publications (MJPP(top 10%)).
For MNJS, each journal is first assigned an impact score, NJS, for each of the considered publication years. NJS, for given year, is equal to the mean across the NCSs of the publications in the journal published that year. Thus, NJS is a field normalized variant of the well-known Journal Impact Factor, values of which is available in Journal Citation Reports (provided by Clarivate Analytics). The latter indicator is not field normalized, however. Now, for a department and each publication from the department, the department author fraction of the publication is multiplied by the NJS of the journal of the publication with respect to the publication year of the publication. These operations yield a weighted sum over the publications from the department, and this sum is divided by the sum of the department author fractions over the publications. The result of the division is the MNJS for the department. Like MNCS, the world average for its journal-level counterpart, MNJS, is equal to 1.
The MJPP(top 10%) indicator is calculated as follows. For each combination of a journal, a class, and a publication year, the proportion of the publications in that journal, class, and year that belong (to a degree in the interval [0, 1]) to the 10% most frequently cited publications in that class and year is determined. This yields a PP(top 10%) value for each combination of a journal, a class, and a year. This value is assigned to all publications in that journal, class, and year. In this way, each publication obtains a JPP(top 10%) value. The MJPP(top 10%) value of a department is obtained dividing the weighted sum of JPP(top 10%) values over the publications from the department–where the weight of a publication consists of the author fraction the department has of the publication–by the sum of the department author fractions over the publications.
2.3 Collaboration
ABM uses two collaboration indicators: proportion of international collaborative publications (PP(int collab)) and proportion of publications with industry (PP(industry)). PP(int collab) for a department is the proportion of its publications that have been co-authored with two or more countries, whereas PP(industry) for a department is the proportion of its publications that have been co-authored with one or more industrial organizations. All private sector for profit business enterprises, covering all manufacturing and services sectors, are regarded as industrial organizations.
5 The approach to assign fractions of publications to the (for instance) 10% most frequently cited publications is described and discussed by Waltman and Schreiber (2013). The approach has the property to produce exactly 10% top 10% publications. In Appendix 2, we show how the extent to which publication i belongs to the 10% most frequently cited publications is calculated.
5 Here, and normally, whole counts (and not fractional counts) are used for collaboration analysis. This means, taken international collaboration as an example, that if an UU department publication has at least one foreign address, relative to Sweden, the department is assigned one international collaborative publication, regardless of the author fraction the department has of the publication. If fractional counts are used, collaboration might be underestimated. However, publications with many organizations, like some of the publications in certain subfields of physics, do not indicate, to any larger extent, collaboration between the involved organizations.
For the collaboration part of ABM, the publication period is 2010-2017.
2.4 Open access
Open access (OA) in the simplest explanation is the concept of publications being available freely online without any costs or other access barriers to the reader. In the research policy bill “Collaborating for knowledge” (Prop. 2016/17:50), the Government presents a national goal that all scientific publications that are the result of publicly funded research should be published immediately open access, and it is stated that it is a shared responsibility for all actors in the research system to strive to achieve this goal. Also large national, and international, funders such as the Swedish Research Council and Horizon 2020 (European Commission) mandate OA publishing. This makes it relevant to measure the trend of OA publishing at UU.
There are different ways for a researcher to achieve OA publication and many different ways to define or source a publication as being OA. In ABM, we use information from DiVA, DOAJ and WoS as primary sources to distinguish between the different classes of OA. Gold OA is defined as a publication made freely available online by the publisher through its own services. Gold hybrid OA is defined as a publication published in a traditional subscription-based journal that is immediately freely available online through the publisher. In ABM, Gold hybrid is a subset of Gold OA. Green OA is defined as any publication available freely online through other services than the ones provided by the journal itself, often a postprint in an institutional repository. In ABM, a publication P is considered to be open access if at least one of the following four conditions is satisfied:
1) The full text of P is published OA in DiVA
2) P is included in a journal classified as OA journal in DiVA 3) P is included in a journal classified as OA journal in DOAJ 4) P is classified as ”gold” or ”green” OA in WoS6
For the OA part of ABM, the publication period is 2011-2018.
3 Results
In this section, we report the results of ABM. We first give, as a background, some results for UU as a whole. We then report the results for the UU departments, grouped by scientific domain.
Each of the sections 3.2-3.4, which corresponds to scientific domains, initially puts forward tables, which correspond to faculties and which report publication volumes (absolute and relative) and WoS coverage by department and publication type. Regarding WoS coverage, the validity of bibliometric indicators are in general higher if the coverage is high compared to low. Within a given section corresponding to a scientific domain, like Section 3.2, the other results are grouped based on what is analyzed: publishing volume and publishing level (the Norwegian model), field normalized citation impact, collaboration, and OA. Within a group of the indicated kind, the results are grouped by faculty.
6 WoS classify OA through a third party service, Unpaywall https://clarivate.com/webofsciencegroup/solutions/open-access/
6
3.1 UU as a whole
In Figure 1, an overview of the subject profile of UU is given.7 In the map of the figure, all WoS subject
categories in which UU has at least one publication of the types “Article” or “Review” and published in the period 2008-2017 are represented (237 categories). The size of a node indicates the publication output of UU in the corresponding category, whereas the color of a node indicates citation impact, relative to the world average, of the publications in the category. Citation impact is measured by the indicator MNCS. The color coding is as follows:
Blue: The impact of a university in a subject category is far below world average Green: The impact of a university in a subject category is around world average. Red: The impact of a university in a subject category is far above world average.
Observe that the number of publications in some subject categories is very low. In such cases, the color of the category should be interpreted with caution.
Figure 1. Subject profile map for UU. Publication period: 2008-2017.
In Figure 2, UUs proportion (in %) of the total number of publication fractions (P) for UU in
combination with 10 benchmarking universities (see Table 2) is shown by publication year. The figure also shows UUs proportion of the total number of publication fractions belonging to the top 10% most frequently cited (P(top 10%)) for the same combination, where class (and thereby subject) and
publication year of the publications are taken into account. The figure can be interpreted as the research production of UU over time, relative to a comparable set of universities.
7 The subject profile overview was inspired by the CWTS web page at the following address: https://www.vosviewer.com/university-profile-maps.
7
Figure 2. UUs proportion of publication fractions and of publication fractions belonging to the top 10% most frequently cited, by publication year and with regard to UU in combination with 10 benchmarking universities. Publication period: 2008-2017.
In Table 2, the 10 benchmarking universities are listed, together with a brief motivation for their inclusion.
Table 2. The 10 benchmarking universities.
Benchmark university Brief motivation for inclusion
Durham University European reference, belonging to the Matariki8 network
Eberhard Karls University Tübingen European reference, belonging to the Matariki and Guild9 networks Ghent University European reference, belonging to U4Society10 and Guild
Lund University Swedish reference, belonging to the SLUG11 network Stockholm University Swedish reference, belonging to the SLUG network University of Copenhagen Nordic reference
University of Gothenburg Swedish reference, belonging to the SLUG network University of Groningen European reference, belonging to U4Society and Guild University of Helsinki Nordic reference
University of Oslo Nordic reference
In Figure 3, UUs proportion in different OA-classes compared to the total production is shown. We count the total production as articles, reviews, books, book chapters and conference proceedings. Full counts are used. For Uppsala University as a whole, the proportion of OA publishing is increasing during the entire period, but are well below 40% during the entire period even though the large Swedish and European funders mandate immediate OA. The major part of the increase is Gold Hybrid publications.
8 The Matariki network is an international group of seven universities. 9 The Guild is a network of 21 European universities.
10 U4Society is a collaboration between five European universities.
11 SLUG is a Swedish network of the Stockholm, Lund, Uppsala and Gothenburg universities.
7,5% 8,0% 8,5% 9,0% 9,5% 10,0% 2008 2009 2010 2011 2012 2013 2014 2015 2016 2017 Pr op or tio n Publication year P P(top 10%)
8
Figure 3. UUs proportion of different OA-classes compared to the total scientific production of UU. Publication period: 2011-2018. 3-year moving average.
3.2 HumSam
The number of HumSam units of analysis included in ABM is 31: 28 departments and three faculties. Faculty of Law and Faculty of Theology consists of only one large department each, responsible for all publications. Nearly all the publications of the Faculty of Education belong to the Department of Education, and the few remaining ones belong to SWEDESD. For practical reasons, the faculty is therefore regarded as one unit in the ABM.
Tables 3-6 report publication volume in terms of both fractional counts and full counts (within parentheses) by department (by faculty for Table 5) and publication type, and WoS coverage. WoS coverage concerns the number of WoS publications of the four types represented in the tables relative to all publications of these types for the department.
Table 3. Faculty of Arts. Publication volume by publication type, and WoS coverage (in %). Publication period: 2010-2018. Data source: GLIS.
Department Publication type
Article Article in
anthology Monograph Conference paper Total coverage WoS
ABM 91,6 (120) 51,8 (60) 5,8 (7) 19,3 (26) 168,5 (213) 26,9 Archeology and Ancient History 221,2 (306) 239,4 (262) 16,7 (21) 39,1 (48) 516,4 (637) 14,6 Art History 67,1 (85) 96,9 (102) 10,8 (13) 17,0 (25) 191,8 (225) 13,1 Cultural Anthropology and Ethnology 117,8 (133) 113,7 (127) 26,4 (32) 6,3 (6) 264,2 (298) 6,9 Game Design 10,9 (16) 1,3 (2) 50,0 (50) 14,8 (23) 77,0 (91) 5,0 Gender Research 130,4 (177) 131,3 (157) 13,4 (18) 15,6 (20) 290,7 (372) 14,8 History 186,7 (205) 283,8 (288) 37,2 (43) 33,4 (36) 541,1 (572) 12,4 History of Sciences and Ideas 150,3 (161) 135,7 (147) 15,2 (19) 1,0 (1) 302,1 (328) 10,7 Literature 187,3 (201) 283,9 (297) 71,5 (74) 6,6 (8) 549,2 (580) 1,9 Musicology 110,0 (116) 68,0 (70) 10,0 (10) 2,5 (3) 190,5 (199) 10,3 Philosophy 160,1 (170) 138,0 (140) 12,8 (15) 10,5 (11) 321,5 (336) 18,6 0% 5% 10% 15% 20% 25% 30% 35% 40% 2011-2013 2012-2014 2013-2015 2014-2016 2015-2017 2016-2018 Pr op or tio n O pe n Ac ce ss
9
Table 4. Faculty of Languages. Publication volume by publication type, and WoS coverage (in %). Publication period: 2010-2018. Data source: GLIS.
Department Publication type
Article Article in
anthology Monograph Conference paper Total coverage WoS English 123,1 (131,0) 101,4 (108) 15,7 (17) 5,5 (6) 245,6 (262) 23,0 Linguistics and Philology 319,5 (369) 274,7 (301) 61,3 (70) 130,1 (194) 785,7 (934) 8,6 Modern Languages 255,8 (275) 225,9 (233) 20,5 (26) 37,9 (41) 540,1 (575) 7,7 Scandinavian Languages 427,6 (460) 214,4 (231) 25,8 (31) 72,5 (79) 740,4 (801) 2,3
Table 5. Faculty of Education, Faculty of Law and Faculty of Theology. Publication volume by publication type, and WoS coverage (in %). Publication period: 2010-2018. Data source: GLIS.
Faculty Publication type
Article Article in anthology Monograph Conference paper Total WoS coverage Faculty of Education 309,6 (442) 281,7 (358) 46,4 (68) 52,1 (70) 689,8 (938) 14,6 Faculty of Law 537,8 (583) 516,1 (537) 123,8 (140) 11,1 (13) 1188,5 (1273) 3,1 Faculty of Theology 356,1 (389) 456,4 (477) 77,0 (89) 19,1 (23) 908,6 (978) 8,8
Table 6. Faculty of Social Sciences. Publication volume by publication type, and WoS coverage (in %). Publication period: 2010-2018. Data source: GLIS.
Department Publication type
Article Article in anthology Monograph Conference paper Total WoS coverage Business Studies 292,2 (409) 275,1 (348) 53,9 (75) 155,0 (195) 776,2 (1027) 17,6 Russian and Eurasian Studies 243,1 (282) 153,1 (166) 22,4 (25) 9,8 (11) 428,4 (484) 15,2 Economic History 121,9 (150) 242,2 (267) 33,8 (40) 29,0 (35) 427,0 (492) 11,8 Economics 164,2 (290) 18,0 (23) 6,1 (9) 1,0 (1) 189,3 (323) 68,1 Food Studies, Nutrition and Dietetics 67,4 (133) 45,4 (49) 1,0 (3) 7,1 (11) 120,9 (196) 35,4 Government 336,0 (452) 266,5 (300) 33,5 (40) 38,0 (42) 674,0 (834) 27,5 Housing and Urban
Research 175,2 (293) 158,6 (200) 18,5 (25) 82,7 (97) 435,0 (615) 19,0 Informatics and
Media 125,0 (173) 104,5 (126) 14,7 (18) 111,9 (151) 356,1 (458) 17,7 Peace and Conflict
Studies 241,3 (293) 180,4 (206) 24,3 (29) 39,0 (42) 484,9 (570) 31,5 Psychology 354,7 (689) 35,7 (47) 3,0 (5) 18,1 (26) 411,5 (767) 70,5 Social and Economic Geography 152,5 (213) 58,6 (69) 7,7 (12) 20,2 (24) 238,9 (318) 44,4 Sociology 237,6 (324) 147,1 (188) 29,9 (43) 66,3 (79) 480,9 (634) 23,4 Statistics 53,6 (114) 1,5 (2) 1,0 (2) 0,5 (1) 56,6 (119) 86,8
10 3.2.1 Publishing volume and publishing level–The Norwegian model
Faculty of Arts
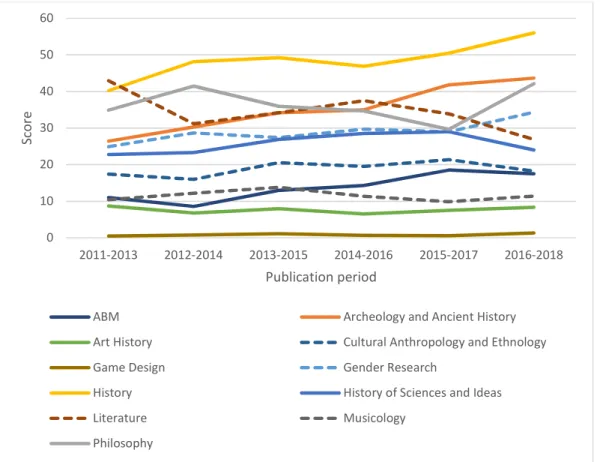
Figure 4. Faculty of Arts. Norwegian score by publication period. 3-year moving average.
Table 7. Faculty of Arts. Proportion (in %) publication fractions at level 2 relative to the sum of publication fractions across levels 1 and 2 (given within parentheses) by publication period. 3-year moving average.
Department 2011-2013 2012-2014 2013-2015 2014-2016 2015-2017 2016-2018 ABM 39,9 (23,4) 26,8 (19,9) 42,9 (24,7) 32,9 (29,1) 37,2 (31,4) 32,3 (31,7) Archeology and Ancient History 27,7 (65,6) 33,2 (71,6) 31,9 (90,1) 36,1 (88,4) 40,4 (94,1) 47,7 (88,6) Art History 1,4 (23,7) 8,6 (19,9) 6,7 (23,7) 8,3 (19,0) 3,6 (21,9) 12,6 (20,5) Cultural Anthropology and Ethnology 33,0 (31,8) 33,0 (31,8) 37,8 (38,3) 38,0 (40,0) 38,2 (45,0) 27,9 (46,5) Game Design 0,0 (2,0) 0,0 (3,0) 0,0 (4,0) 0,0 (2,1) 0,0 (1,8) 47,5 (2,1) Gender Research 37,8 (65,0) 31,0 (61,4) 23,1 (60,0) 20,0 (63,8) 29,3 (60,0) 29,6 (73,3) History 23,7 (92,8) 19,6 (104,5) 23,9 (104,1) 32,3 (92,9) 36,1 (95,5) 41,9 (98,1) History of Sciences and Ideas 20,6 (52,7) 27,3 (56,2) 28,3 (60,2) 28,8 (64,2) 27,4 (57,7) 17,7 (61,2) Literature 6,8 (95,8) 11,7 (93,8) 13,1 (91,5) 10,4 (81,5) 5,9 (68,1) 11,6 (55,8) Musicology 35,1 (18,5) 16,7 (30,0) 14,2 (35,2) 12,8 (31,2) 21,3 (28,2) 32,8 (29,0) Philosophy 32,5 (80,0) 39,4 (91,3) 36,0 (76,3) 45,6 (76,8) 50,0 (58,0) 51,0 (74,5) 0 10 20 30 40 50 60 2011-2013 2012-2014 2013-2015 2014-2016 2015-2017 2016-2018 Sc or e Publication period
ABM Archeology and Ancient History Art History Cultural Anthropology and Ethnology Game Design Gender Research
History History of Sciences and Ideas Literature Musicology
11 Faculty of Languages
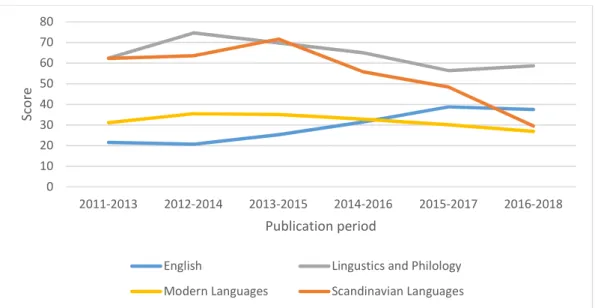
Figure 5. Faculty of Languages. Norwegian score by publication period. 3-year moving average.
Table 8. Faculty of Languages. Proportion (in %) publication fractions at level 2 relative to the sum of publication fractions across levels 1 and 2 (given within parentheses) by publication period. 3-year moving average.
Department 2011-2013 2012-2014 2013-2015 2014-2016 2015-2017 2016-2018 English 21,9 (51,0) 25,6 (53,8) 33,2 (59,5) 39,9 (57,0) 42,9 (65,3) 41,4 (62,3) Linguistics and Philology 43,9 (122,9) 53,2 (135,5) 52,7 (129,9) 55,6 (110,7) 47,5 (101,4) 53,5 (105,2) Modern Languages 16,9 (87,0) 15,9 (99,3) 16,4 (96,8) 15,2 (92,0) 18,4 (80,8) 13,1 (83,8) Scandinavian Languages 28,4 (121,6) 30,9 (119,9) 29,1 (133,9) 25,6 (107,6) 17,9 (108,2) 12,6 (73,8) 0 10 20 30 40 50 60 70 80 2011-2013 2012-2014 2013-2015 2014-2016 2015-2017 2016-2018 Sc or e Publication period
English Lingustics and Philology Modern Languages Scandinavian Languages
12 Faculty of Education, Faculty of Law and Faculty of Theology
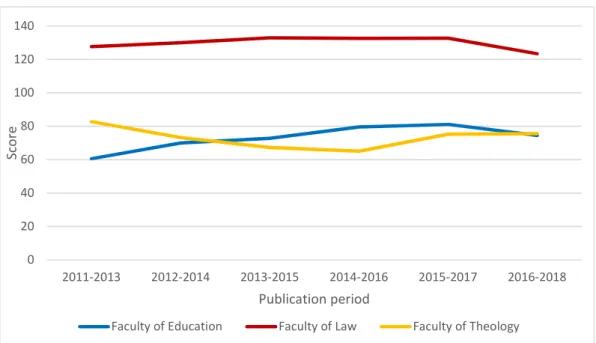
Figure 6. Faculty of Education, Faculty of Law and Faculty of Theology. Norwegian score by publication period. 3-year moving average.
Table 9. Faculty of Education, Faculty of Law and Faculty of Theology. Proportion (in %) publication fractions at level 2 relative to the sum of publication fractions across levels 1 and 2 (given within parentheses) by publication period. 3-year moving average.
Department 2011-2013 2012-2014 2013-2015 2014-2016 2015-2017 2016-2018 Faculty of Education 10,4 (129,6) 11,7 (137,0) 16,1 (142,8) 19,5 (164,6) 25,4 (159,0) 27,8 (136,3) Faculty of Law 10,4 (246,6) 13,5 (273,1) 20,2 (278,3) 26,0 (290,4) 24,6 (274,5) 21,7 (266,6) Faculty of Theology 28,3 (177,8) 33,4 (156,3) 35,1 (148,6) 33,7 (139,0) 32,3 (159,8) 39,0 (152,1) 0 20 40 60 80 100 120 140 2011-2013 2012-2014 2013-2015 2014-2016 2015-2017 2016-2018 Sc or e Publication period
13 Faculty of Social Sciences
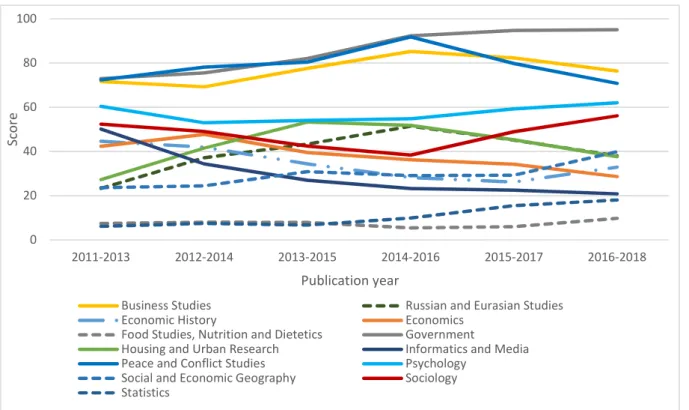
Figure 7. Faculty of Social Sciences. Norwegian score by publication period. 3-year moving average.
0 20 40 60 80 100 2011-2013 2012-2014 2013-2015 2014-2016 2015-2017 2016-2018 Sc or e Publication year
Business Studies Russian and Eurasian Studies Economic History Economics
Food Studies, Nutrition and Dietetics Government
Housing and Urban Research Informatics and Media Peace and Conflict Studies Psychology
Social and Economic Geography Sociology Statistics
14
Table 10. Faculty of Social Sciences. Proportion (in %) publication fractions at level 2 relative to the sum of publication fractions across levels 1 and 2 (given within parentheses) by publication period. 3-year moving average. Department 2011-2013 2012-2014 2013-2015 2014-2016 2015-2017 2016-2018 Business Studies 31,8 (144,3) 34,5 (131,2) 31,0 (142,7) 33,8 (164,6) 36,4 (159,7) 37,3 (155,8) Russian and Eurasian Studies 25,2 (49,5) 21,8 (69,0) 33,3 (84,1) 31,8 (108,4) 34,1 (99,3) 28,6 (78,5) Economic History 14,4 (100,7) 20,6 (89,6) 27,3 (78,6) 32,7 (62,7) 33,9 (60,0) 40,6 (62,7) Economics 32,1 (71,5) 38,3 (74,2) 44,3 (57,4) 46,3 (53,5) 51,0 (48,9) 50,3 (42,9) Food Studies, Nutrition and Dietetics 11,8 (21,5) 8,0 (25,0) 10,1 (24,7) 14,0 (16,1) 12,9 (16,1) 7,7 (26,9) Government 43,0 (146,8) 46,2 (153,7) 44,5 (16,0) 41,3 (170,4) 45,0 (167,4) 44,7 (175,7) Housing and Urban Research 25,7 (62,9) 37,4 (81,2) 33,7 (105,4) 31,3 (100,5) 30,7 (92,6) 31,2 (75,6) Informatics and Media 29,0 (98,0) 37,0 (70,9) 32,7 (59,4) 33,6 (49,0) 22,2 (49,5) 31,3 (50,7) Peace and Conflict Studies 42,5 (135,9) 46,8 (144,5) 51,3 (125,6) 57,1 (141,3) 54,3 (131,6) 58,4 (130,2) Psychology 28,9 (117,4) 21,9 (113,7) 21,6 (115,3) 23,9 (116,0) 25,4 (124,4) 29,1 (122,9) Social and Economic Geography 31,2 (47,1) 38,0 (47,1) 41,2 (58,7) 46,8 (57,1) 44,0 (58,0) 45,3 (66,9) Sociology 30,0 (97,1) 26,4 (100,7) 28,4 (101,6) 24,8 (97,2) 28,3 (106,1) 33,9 (115,6) Statistics 25,4 (12,1) 22,1 (15,5) 17,4 (13,9) 20,0 (18,3) 31,1 (26,3) 34,6 (30,4)
3.2.2 Field normalized citation impact Faculty of Arts
Table 11. Faculty of Arts. Publication fractions (P; full counts within parentheses), MNCS, PP(top 10%), MNJS and MJPPtop10% for the whole publication period 2010-2017.
Department Indicator
P MNCS PP(top 10%) MNJS MJPPtop10%
ABM 31,4 (43) 0,72 3,2 0,91 9,4
Archeology and Ancient History 30,0 (70) 0,98 8,4 0,91 10,2
Art History 3,2 (9) null null null null
Cultural Anthropology and Ethnology 7,5 (11) null null null null
Game Design 0,1 (1) null null null null
Gender Research 12,1 (24) null null null null
History 13,1 (17) null null null null
History of Sciences and Ideas 3,4 (6) null null null null
Literature 0,0 (0) null null null null
Musicology 0,7 (2) null null null null
15
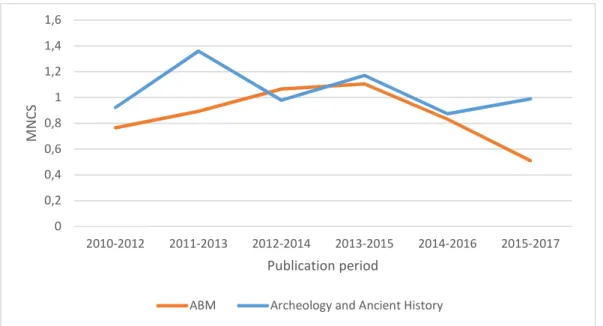
Figure 8. Faculty of Arts. MNCS by publication period. 3-year moving average.
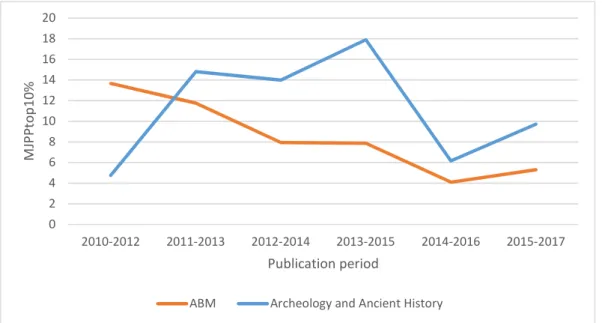
Figure 9. Faculty of Arts. PP(top 10%) by publication period. 3-year moving average.
0 0,2 0,4 0,6 0,8 1 1,2 1,4 1,6 2010-2012 2011-2013 2012-2014 2013-2015 2014-2016 2015-2017 M N CS Publication period
ABM Archeology and Ancient History
0 2 4 6 8 10 12 14 16 18 2010-2012 2011-2013 2012-2014 2013-2015 2014-2016 2015-2017 PP (t op 1 0% ) Publication period
16
Figure 10. Faculty of Arts. MNJS by publication period. 3-year moving average.
Figure 11. Faculty of Arts. MJPPtop10% by publication period. 3-year moving average.
Faculty of Languages
Each of the four departments of the faculty has less than 40 publications for the publication period 2010-2017. This yields that the four departments are excluded from the citation analysis of ABM.
Table 12. Faculty of Languages. Publication fractions (P; full counts within parentheses), MNCS, PP(top 10%), MNJS and MJPPtop10% for the whole publication period 2010-2017.
Department Indicator
P MNCS PP(top 10%) MNJS MJPPtop10%
English 8,5 (9) null null null null
Linguistics and Philology 16,2 (30) null null null null
Modern Languages 11,3 (14) null null null null
Scandinavian Languages 6,1 (12) null null null null
0 0,2 0,4 0,6 0,8 1 1,2 2010-2012 2011-2013 2012-2014 2013-2015 2014-2016 2015-2017 M N JS Publication period
ABM Archeology and Ancient History
0 2 4 6 8 10 12 14 16 18 20 2010-2012 2011-2013 2012-2014 2013-2015 2014-2016 2015-2017 M JP Pt op 10 % Publication period
17 Faculty of Education, Faculty of Law and Faculty of Theology
Table 13. Faculty of Education, Faculty of Law and Faculty of Theology. Publication fractions (P; full counts within parentheses), MNCS, PP(top 10%), MNJS and MJPPtop10% by department and for the whole publication period 2010-2017.
Department Indicator
P MNCS PP(top 10%) MNJS MJPPtop10% Faculty of Education 57,0 (97) 0,68 3,5 0,81 7,3
Faculty of Law 12,2 (20) null null null null
Faculty of Theology 11,8 (23) null null null null
Figure 12. Faculty of Education. MNCS by publication period. 3-year moving average.
Figure 13. Faculty of Education. PP(top 10%) by publication period. 3-year moving average.
0 0,1 0,2 0,3 0,4 0,5 0,6 0,7 0,8 0,9 2010-2012 2011-2013 2012-2014 2013-2015 2014-2016 2015-2017 M N CS Publication period Faculty of Education 0 1 2 3 4 5 6 7 8 9 10 2010-2012 2011-2013 2012-2014 2013-2015 2014-2016 2015-2017 PP (t op 1 0% ) Publication period Faculty of Education
18
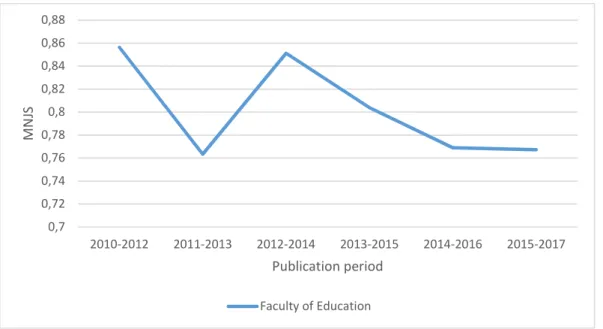
Figure 14. Faculty of Education. MNJS by publication period. 3-year moving average.
Figure 15. Faculty of Education. MJPPtop10% by publication period. 3-year moving average.
Faculty of Social Sciences
Table 14. Faculty of Social Sciences. Publication fractions (P; full counts within parentheses), MNCS, PP(top 10%), MNJS and MJPPtop10% by department and for the whole publication period 2010-2017.
Department Indicator
P MNCS PP(top 10%) MNJS MJPPtop10%
Business Studies 83,1 (146) 0,98 10,0 1,02 9,9
Russian and Eurasian Studies 16,7 (30) null null null null
Economic History 17,7 (29) null null null null
Economics 85,6 (184) 1,03 11,0 1,07 11,4
Food Studies, Nutrition and Dietetics 28,7 (69) 0,57 4,0 0,75 7,3
Government 111,4 (180) 0,87 8,2 1,00 9,3
Housing and Urban Research 63,2 (130) 1,50 13,1 1,20 10,0
Informatics and Media 28,5 (49) 0,97 6,0 0,79 4,0
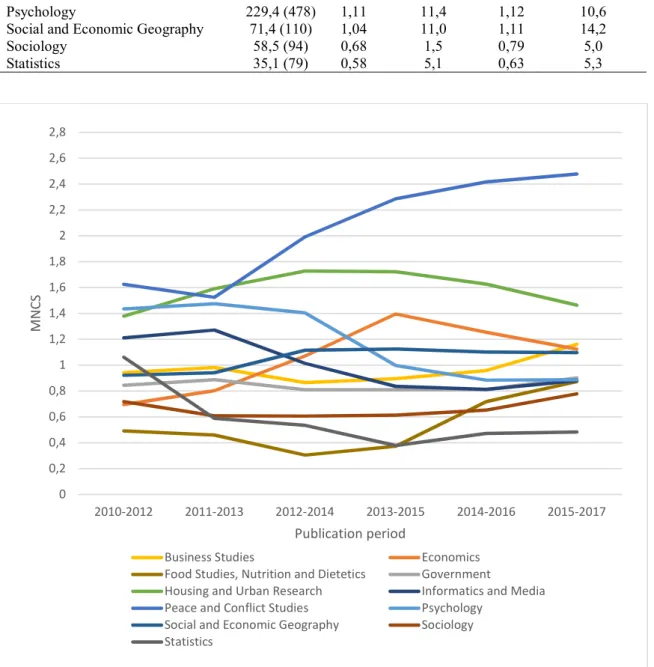
Peace and Conflict Studies 95,7 (135) 2,05 23,1 1,33 14,6
0,7 0,72 0,74 0,76 0,78 0,8 0,82 0,84 0,86 0,88 2010-2012 2011-2013 2012-2014 2013-2015 2014-2016 2015-2017 M N JS Publication period Faculty of Education 0 2 4 6 8 10 12 2010-2012 2011-2013 2012-2014 2013-2015 2014-2016 2015-2017 M JP Pt op 10 % Publication period Faculty of Education
19
Psychology 229,4 (478) 1,11 11,4 1,12 10,6
Social and Economic Geography 71,4 (110) 1,04 11,0 1,11 14,2
Sociology 58,5 (94) 0,68 1,5 0,79 5,0
Statistics 35,1 (79) 0,58 5,1 0,63 5,3
Figure 16.Faculty of Social Sciences. MNCS by publication period. 3-year moving average.
0 0,2 0,4 0,6 0,8 1 1,2 1,4 1,6 1,8 2 2,2 2,4 2,6 2,8 2010-2012 2011-2013 2012-2014 2013-2015 2014-2016 2015-2017 M N CS Publication period
Business Studies Economics Food Studies, Nutrition and Dietetics Government
Housing and Urban Research Informatics and Media Peace and Conflict Studies Psychology
Social and Economic Geography Sociology Statistics
20
Figure 17. Faculty of Social Sciences. PP(top 10%) by publication period. 3-year moving average.
0 2,5 5 7,5 10 12,5 15 17,5 20 22,5 25 27,5 30 2010-2012 2011-2013 2012-2014 2013-2015 2014-2016 2015-2017 PP (t op 1 0% ) Publication period
Business Studies Economics Food Studies, Nutrition and Dietetics Government
Housing and Urban Research Informatics and Media Peace and Conflict Studies Psychology
Social and Economic Geography Sociology Statistics
21
Figure 18. Faculty of Social Sciences. MNJS by publication period. 3-year moving average.
0 0,2 0,4 0,6 0,8 1 1,2 1,4 1,6 2010-2012 2011-2013 2012-2014 2013-2015 2014-2016 2015-2017 M N JS Publication period
Business Studies Economics Food Studies, Nutrition and Dietetics Government
Housing and Urban Research Informatics and Media Peace and Conflict Studies Psychology
Social and Economic Geography Sociology Statistics
22
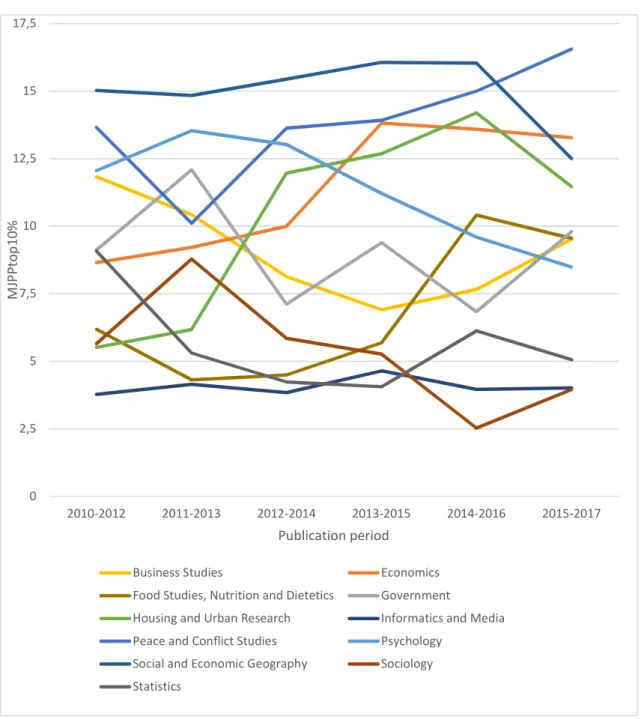
Figure 19. Faculty of Social Sciences. MJPPtop10% by publication period. 3-year moving average.
3.2.3 Collaboration
For all tables in this section, PP(int collab) and PP(industry) are given as percentages. Faculty of Arts
Table 15. Faculty of Arts. Publications (P, full counts), PP(int collab) and PP(industry) for the whole publication period 2010-2017
Department Indicator
P PP(int collab) PP(industry)
ABM 43 34,9 0,0
Archeology and Ancient History 70 68,6 1,4
Art History 9 88,9 0,0
Cultural Anthropology and Ethnology 11 18,2 0,0
Game Design 1 100,0 100,0 Gender Research 24 25,0 4,2 History 17 11,8 0,0 0 2,5 5 7,5 10 12,5 15 17,5 2010-2012 2011-2013 2012-2014 2013-2015 2014-2016 2015-2017 M JP Pt op 10 % Publication period
Business Studies Economics Food Studies, Nutrition and Dietetics Government
Housing and Urban Research Informatics and Media Peace and Conflict Studies Psychology
Social and Economic Geography Sociology Statistics
23
History of Sciences and Ideas 6 16,7 0,0
Literature 0 - -
Musicology 2 100 0,0
Philosophy 27 11,1 0,0
In Table 16, which gives values of PP(int collab) and PP(industry) by publication period, “-“ in a table cell indicates that indicator values for the corresponding department and period cannot be obtained, since the department has no WoS publications (of the type “Article” or “Review”) in the period.
Table 16. Faculty of Arts. PP(int collab) and PP(industry) (within parentheses) by publication period. 3-year moving average. Department 2010-2012 2011-2013 2012-2014 2013-2015 2014-2016 2015-2017 ABM 25,0 (0,0) 38,5 (0,0) 44,4 (0,0) 53,9 (0,0) 37,6 (0,0) 40,0 (0,0) Archeology and Ancient History 61,1 (5,6) 50,0 (5,6) 55,0 (5,0) 66,7 (0,0) 75,8 (0,0) 77,5 (0,0) Art History - - 100,0 (0,0) 100,0 (0,0) 100,0 (0,0) 87,6 (0,0) Cultural Anthropology and Ethnology 33,3 (0,0) 0,0 (0,0) 0,0 (0,0) 20,0 (0,0) 16,7 (0,0) 16,7 (0,0) Game Design - - - - 100 (100,0) 100 (100,0) Gender Research 25,0 (0,0) 0,0 (0,0) 28,6 (0,0) 25,0 (0,0) 38,5 (7,7) 21,4 (7,1) History 0 (0,0) 0 (0,0) 20,0 (0,0) 20,0 (0,0) 25,0 (0,0) 0,0 (0,0) History of Sciences and Ideas - - 0,0 (0,0) 0,0 (0,0) 0,0 (0,0) 20,0 (0,0) Literature - - - - Musicology 100 (0,0) 100 (0,0) - 100 (0,0) 100 (0,0) 100 (0,0) Philosophy 13,3 (0,0) 8,3 (0,0) 10,0 (0,0) 0,0 (0,0) 0,0 (0,0) 16,7 (0,0) Faculty of Languages
Table 17. Faculty of Languages. Publications (P, full counts), PP(int collab) and PP(industry) for the whole publication period 2010-2017.
Department Indicator
P PP(int collab) PP(industry)
English 9 11,1 0,0
Linguistics and Philology 30 60,0 6,7
Modern Languages 14 0,0 0,0
Scandinavian Languages 12 16,7 0,0
Table 18. Faculty of Languages. PP(int collab) and PP(industry) (within parentheses) by publication period. 3-year moving average.
Department 2010-2012 2011-2013 2012-2014 2013-2015 2014-2016 2015-2017 English 0,0 (0,0) 0,0 (0,0) 50,0 (0,0) 50,0 (0,0) 25,0 (0,0) 0,0 (0,0) Linguistics and Philology 60,0 (0,0) 50,0 (7,1) 50,0 (14,3) 50,0 (12,5) 66,7 (11,1) 69,2 (0,0) Modern Languages 0,0 (0,0) 0,0 (0,0) 0,0 (0,0) 0,0 (0,0) 0,0 (0,0) 0,0 (0,0) Scandinavian Languages - 50,0 (0,0) 50,0 (0,0) 33,3 (0,0) 11,1 (0,0) 0,0 (0,0)
24 Faculty of Education, Faculty of Law and Faculty of Theology
Table 19. Faculty of Education, Faculty of Law and Faculty of Theology. Publications (P, full counts), PP(int collab) and PP(industry) for the whole publication period 2010-2017.
Department Indicator
P PP(int collab) PP(industry) Faculty of Education 97 21,7 0,0
Faculty of Law 20 35,0 0,0
Faculty of Theology 23 39,1 0,0
Table 20. Faculty of Education, Faculty of Law and Faculty of Theology. PP(int collab) and PP(industry) (within parentheses) by publication period. 3-year moving average.
Department 2010-2012 2011-2013 2012-2014 2013-2015 2014-2016 2015-2017 Faculty of Education 12,0 (0,0) 8,0 (0,0) 14,8 (0,0) 18,2 (0,0) 30,6 (0,0) 27,3 (0,0) Faculty of Law 25,0 (0,0) 20,0 (0,0) 50,0 (0,0) 40,0 (0,0) 41,7 (0,0) 22,2 (0,0) Faculty of Theology 33,3 (0,0) 25,0 (0,0) 28,6 (0,0) 33,3 (0,0) 40,0 (0,0) 41,7 (0,0)
Faculty of Social Sciences
Table 21. Faculty of Social Sciences. Publications (P, full counts), PP(int collab) and PP(industry) for the whole publication period 2010-2017.
Department Indicator
P PP(int collab) PP(industry)
Business Studies 146 54,8 0,7
Russian and Eurasian Studies 30 43,3 0,0
Economic History 29 37,9 0,0
Economics 184 41,8 2,2
Food Studies, Nutrition and Dietetics 69 46,4 1,5
Government 180 33,3 1,1
Housing and Urban Research 130 50,0 1,5
Informatics and Media 49 40,8 4,1
Peace and Conflict Studies 135 38,5 0,0
Psychology 478 42,3 2,5
Social and Economic Geography 110 29,1 0,0
Sociology 94 24,5 0,0
Statistics 79 38,0 0,0
Table 22. Faculty of Social Sciences. PP(int collab) and PP(industry) (within parentheses) publication period. 3-year moving average.
Department 2010-2012 2011-2013 2012-2014 2013-2015 2014-2016 2015-2017 Business Studies 47,2 (1,9) 45,6 (1,8) 51,7 (0,0) 57,4 (0,0) 63,1 (0,0) 64,2 (0,0) Russian and Eurasian Studies 50,0 (0,0) 66,7 (0,0) 40,0 (0,0) 25,0 (0,0) 30,8 (0,0) 45,5 (0,0) Economic History 33,3 (0,0) 40,0 (0,0) 42,9 (0,0) 42,9 (0,0) 42,9 (0,0) 30,0 (0,0) Economics 41,6 (6,2) 40,9 (5,6) 44,9 (5,1) 46,2 (0,0) 47,0 (0,0) 40,3 (0,0) Food Studies, Nutrition and Dietetics 22,2 (0,0) 27,3 (0,0) 21,1 (0,0) 40,9 (0,0) 56,0 (0,0) 67,6 (2,7) Government 26,7 (0,0) 27,4 (0,0) 31,0 (1,7) 29,8 (1,5) 35,8 (2,5) 36,4 (1,1) Housing and Urban
25
Informatics and
Media 26,3 (0,0) 23,8 (0,0) 26,9 (7,7) 41,7 (8,3) 63,1 (10,5) 83,3 (0,0) Peace and Conflict
Studies 33,4 (0,0) 38,5 (0,0) 36,1 (0,0) 41,1 (0,0) 39,0 (0,0) 38,5 (0,0) Psychology 42,6 (3,1) 38,8 (2,3) 43,1 (2,9) 42,3 (2,8) 48,4 (3,2) 42,9 (2,5) Social and Economic Geography 24,3 (0,0) 24,3 (0,0) 20,0 (0,0) 30,5 (0,0) 37,5 (0,0) 37,2 (0,0) Sociology 26,1 (0,0) 18,5 (0,0) 21,6 (0,0) 19,5 (0,0) 17,1 (0,0) 26,6 (0,0) Statistics 50,0 (0,0) 40,0 (0,0) 34,6 (0,0) 25,0 (0,0) 44,1 (0,0) 40,4 (0,0) 3.2.4 Open access
For all figures in this section, proportion OA is given as percentages. OA is defined as publications belonging to any class of OA (Gold, green or hybrid). All OA measures use full counts.
Faculty of Arts
Figure 20. Faculty of Arts. Total Open Access by publication period. 3-year moving average.
0% 10% 20% 30% 40% 50% 60% 70% 80% 90% 2011-2013 2012-2014 2013-2015 2014-2016 2015-2017 2016-2018 Pr op or tio n O pe n Ac ce ss Publication period
ABM Archeology and Ancient History Art History Cultural Anthropology and Ethnology Game Design Gender Research
History History of Sciences and Ideas Literature Musicology
26 Faculty of Languages
Figure 21. Faculty of Languages. Total Open Access by publication period. 3-year moving average.
Faculty of Education, Faculty of Law and Faculty of Theology
Figure 22. Faculty of Education, Faculty of Law and Faculty of Theology. Total Open Access by publication period. 3-year moving average.
0% 5% 10% 15% 20% 25% 30% 35% 2011-2013 2012-2014 2013-2015 2014-2016 2015-2017 2016-2018 Pr op or tio n O pe n Ac ce ss Publication period
English Lingustics and Philology Modern Languages Scandinavian Languages
0% 5% 10% 15% 20% 25% 30% 2011-2013 2012-2014 2013-2015 2014-2016 2015-2017 2016-2018 Pr op or tio n O pe n Ac ce ss Publication period
27 Faculty of Social Sciences
Figure 23. Faculty of Social Sciences. Total Open Access by publication period. 3-year moving average.
3.3 MedFarm
The number of MedFarm departments included in ABM is 11. Tables 23-24 report publication volume in terms of both fractional counts and full counts (within parentheses) by department and publication type, and WoS coverage. WoS coverage concerns the number of WoS publications of the four types represented in the tables relative to all publications of these types for the department.
Table 23. Faculty of Pharmacy. Publication volume by publication type, and WoS coverage (in %). Publication period: 2010-2018. Data source: GLIS.
Department Publication type
Article Article in
anthology Monograph Conference paper Total coverage WoS Medicinal Chemistry 276,9 (663) 15,4 (18) 0,0 (0) 2,9 (5) 295,2 (686) 90,2 Pharmaceutical Biosciences 441,4 (999) 22,4 (24) 0,9 (1) 5,5 (12) 470,2 (1036) 88,4 Pharmacy 220,2 (469) 4,8 (6) 0,0 (0) 0,0 (0) 225,0 (475) 91,3 0% 5% 10% 15% 20% 25% 30% 35% 40% 45% 2011-2013 2012-2014 2013-2015 2014-2016 2015-2017 2016-2018 Pr op or tio n O pe n Ac ce ss Publication period
Business Studies Russian and Eurasian Studies Economic History Economics
Food Studies, Nutrition and Dietetics Government
Housing and Urban Research Informatics and Media Peace and Conflict Studies Psychology
Social and Economic Geography Sociology Statistics
28
Table 24. Faculty of Medicine. Publication volume by publication type, and WoS coverage (in %). Publication period: 2010-2018. Data source: GLIS.
Department Publication type
Article Article in
anthology Monograph Conference paper Total coverage WoS Immunology, Genetics and Pathology 671,9 (2500) 20,2 (31) 0,3 (1) 5,6 (19) 698,0 (2551) 90,6 Medical Biochemistry and Microbiology 382,2 (1162) 9,8 (19) 0,3 (1) 1,1 (4) 393,4 (1186) 92,8 Medical Cell Biology 245,5 (510) 7,3 (11) 0,0 (0) 3,5 (4) 256,3 (525) 92,2 Medical Sciences 1395,0 (4974) 33,5 (44) 2,9 (3) 7,2 (16) 1438,6 (5037) 86,3 Neuroscience 965,7 (2116) 31,6 (43) 6,5 (11) 11,8 (31) 1015,7 (2201) 87,6 Public Health and
Caring Sciences 850,1 (2284) 77,9 (108) 12,1 (17) 16,4 (35) 956,5 (2444) 72,5 Surgical Sciences 1212,3 (3309) 67,0 (89) 3,1 (4) 18,5 (38) 1330,9 (3440) 78,8 Women’s and
Children’s Health 853,0 (2139) 48,8 (58) 5,8 (8) 1,2 (5) 908,8 (2210) 84,4
3.3.1 Publishing volume and publishing level–The Norwegian model Faculty of Pharmacy
Figure 24. Faculty of Pharmacy. Norwegian score by publication period. 3-year moving average.
0 10 20 30 40 50 60 70 80 2011-2013 2012-2014 2013-2015 2014-2016 2015-2017 2016-2018 Sc or e Publication period
29
Table 25. Faculty of Pharmacy. Proportion (in %) publication fractions at level 2 relative to the sum of publication fractions across levels 1 and 2 (given within parentheses) by publication period. 3-year moving average. Department 2011-2013 2012-2014 2013-2015 2014-2016 2015-2017 2016-2018 Medicinal Chemistry 29,4 (80,9) 24,1 (99,4) 18,2 (106,0) 16,3 (103,3) 18,8 (99,5) 19,4 (90,9) Pharmaceutical Biosciences 19,5 (156,8) 16,8 (149,1) 16,2 (131,4) 19,0 (133,6) 20,6 (141,6) 22,2 (156,2) Pharmacy 28,6 (67,9) 29,8 (64,8) 26,9 (63,7) 28,3 (68,0) 28,1 (74,4) 31,9 (78,6) Faculty of Medicine
Figure 25. Faculty of Medicine. Norwegian score by publication period. 3-year moving average. Table 26. Faculty of Medicine. Proportion (in %) publication fractions at level 2 relative to the sum of publication fractions across levels 1 and 2 (given within parentheses) by publication period. 3-year moving average. Department 2011-2013 2012-2014 2013-2015 2014-2016 2015-2017 2016-2018 Immunology, Genetics and Pathology 20,1 (201,4) 20,8 (203,6) 21,4 (220,7) 22,2 (236,0) 23,5 (251,7) 24,5 (239,7) Medical Biochemistry and Microbiology 35,0 (102,5) 31,2 (111,5) 32,4 (118,6) 32,0 (139,0) 34,5 (159,3) 34,5 (157,5) Medical Cell Biology 19,4 (83,4) 18,3 (79,0) 19,8 (85,8) 19,3 (88,5) 18,6 (87,6) 19,0 (71,3) Medical Sciences 19,0 (455,6) 19,7 (446,6) 18,8 (448,6) 17,2 (427,2) 16,3 (437,9) 16,8 (437,3) Neuroscience 18,5 (339,0) 16,6 (350,3) 15,7 (339,2) 15,5 (324,5) 14,2 (307,3) 12,8 (298,6) Public Health and Caring Sciences 14,9 (249,1) 13,5 (257,1) 13,7 (278,3) 15,9 (290,6) 16,6 (302,9) 17,5 (295,6) Surgical Sciences 15,5 (335,4) 17,1 (348,6) 17,9 (359,2) 16,5 (387,1) 15,2 (430,7) 15,6 (464,4) 0 50 100 150 200 250 2011-2013 2012-2014 2013-2015 2014-2016 2015-2017 2016-2018 Sc or e Publication period
Immunology, Genetics and Pathology Medical Biochemistry and Microbiology Medical Cell Biology Medical Sciences
Neuroscience Public Health and Caring Sciences Surgical Sciences Women’s and Children’s Health
30
Women’s and Children’s
Health 18,1 (249,4) 15,0 (256,6) 13,6 (290,0) 12,3 (300,1) 11,6 (333,1) 12,1 (318,0)
3.3.2 Field normalized citation impact Faculty of Pharmacy
Table 27. Faculty of Pharmacy. Publication fractions (P; full counts within parentheses), MNCS, PP(top 10%), MNJS and MJPPtop10% for the whole publication period 2010-2017.
Department Indicator
P MNCS PP(top 10%) MNJS MJPPtop10%
Medicinal Chemistry 215,6 (526) 0,89 8,2 0,90 8,1
Pharmaceutical Biosciences 331,4 (781) 1,02 8,3 1,02 9,4
Pharmacy 166,9 (367) 1,20 19,0 1,34 17,5
Figure 26. Faculty of Pharmacy. MNCS by publication period. 3-year moving average.
0 0,2 0,4 0,6 0,8 1 1,2 1,4 2010-2012 2011-2013 2012-2014 2013-2015 2014-2016 2015-2017 M N CS Publication period
31
Figure 27. Faculty of Pharmacy. PP(top 10%) by publication period. 3-year moving average.
Figure 28. Faculty of Pharmacy. MNJS by publication period. 3-year moving average.
0 2,5 5 7,5 10 12,5 15 17,5 20 22,5 2010-2012 2011-2013 2012-2014 2013-2015 2014-2016 2015-2017 PP (t op 1 0% ) Publication period
Medicinal Chemistry Pharmaceutical Biosciences Pharmacy
0 0,2 0,4 0,6 0,8 1 1,2 1,4 1,6 2010-2012 2011-2013 2012-2014 2013-2015 2014-2016 2015-2017 M N JS Publication period
32
Figure 29. Faculty of Pharmacy. MJPPtop10% by publication period. 3-year moving average.
Faculty of Medicine
Table 28. Faculty of Medicine. Publication fractions (P; full counts within parentheses), MNCS, PP(top 10%), MNJS and MJPPtop10% for the whole publication period 2010-2017.
Department Indicator
P MNCS PP(top
10%)
MNJS MJPPtop10% Immunology, Genetics and Pathology 796,1 (2624) 1,33 13,9 1,31 14,1 Medical Biochemistry and
Microbiology 320,6 (924) 1,48 15,7 1,54 16,1
Medical Cell Biology 195,9 (421) 1,03 11,6 0,99 10,1
Medical Sciences 1027,1 (3892) 1,16 12,4 1,14 12,1
Neuroscience 773,2 (1853) 0,96 9,2 1,00 9,6
Public Health and Caring Sciences 492,4 (1639) 0,97 9,2 0,99 9,9
Surgical Sciences 816,7 (2398) 1,09 11,1 1,10 11,5
Women’s and Children’s Health 588,7 (1670) 0,91 8,4 0,94 8,9
0 2,5 5 7,5 10 12,5 15 17,5 20 22,5 2010-2012 2011-2013 2012-2014 2013-2015 2014-2016 2015-2017 M JP Pt op 10 % Publication period
33
Figure 30. Faculty of Medicine. MNCS by publication period. 3-year moving average.
Figure 31. Faculty of Medicine. PP(top 10%) by publication period. 3-year moving average.
0 0,2 0,4 0,6 0,8 1 1,2 1,4 1,6 1,8 2010-2012 2011-2013 2012-2014 2013-2015 2014-2016 2015-2017 M N CS Publication period
Immunology, Genetics and Pathology Medical Biochemistry and Microbiology Medical Cell Biology Medical Sciences
Neuroscience Public Health and Caring Sciences Surgical Sciences Women’s and Children’s Health
0 2 4 6 8 10 12 14 16 18 2010-2012 2011-2013 2012-2014 2013-2015 2014-2016 2015-2017 PP (t op 1 0% ) Publication period
Immunology, Genetics and Pathology Medical Biochemistry and Microbiology Medical Cell Biology Medical Sciences
Neuroscience Public Health and Caring Sciences Surgical Sciences Women’s and Children’s Health
34
Figure 32. Faculty of Medicine. MNJS by publication period. 3-year moving average.
Figure 33. Faculty of Medicine. MJPPtop10% by publication period. 3-year moving average.
3.3.3 Collaboration
For all tables in this section, PP(int collab) and PP(industry) are given as percentages.
0 0,2 0,4 0,6 0,8 1 1,2 1,4 1,6 1,8 2010-2012 2011-2013 2012-2014 2013-2015 2014-2016 2015-2017 M N JS Publication period
Immunology, Genetics and Pathology Medical Biochemistry and Microbiology Medical Cell Biology Medical Sciences
Neuroscience Public Health and Caring Sciences Surgical Sciences Women’s and Children’s Health
0 2 4 6 8 10 12 14 16 18 2010-2012 2011-2013 2012-2014 2013-2015 2014-2016 2015-2017 M JP Pt op 10 % Publication period
Immunology, Genetics and Pathology Medical Biochemistry and Microbiology Medical Cell Biology Medical Sciences
Neuroscience Public Health and Caring Sciences Surgical Sciences Women’s and Children’s Health
35 Faculty of Pharmacy
Table 29. Faculty of Pharmacy. Publications (P, full counts), PP(int collab) and PP(industry) for the whole publication period 2010-2017.
Department Indicator
P PP(int collab) PP(industry)
Medicinal Chemistry 526 46,0 20,2
Pharmaceutical Biosciences 781 59,7 26,4
Pharmacy 367 49,0 33,3
Table 30. Faculty of Pharmacy. PP(int collab) and PP(industry) (within parentheses) by publication period. 3-year moving average. Department 2010-2012 2011-2013 2012-2014 2013-2015 2014-2016 2015-2017 Medicinal Chemistry 49,7 (28,9) 50,3 (28,7) 43,3 (25,6) 43,4 (20,1) 45,8 (14,8) 50,0 (12,7) Pharmaceutical Biosciences 60,4 (30,2) 59,7 (28,2) 62,8 (27,0) 59,5 (26,9) 61,4 (24,9) 58,8 (23,3) Pharmacy 39,8 (33,4) 39,0 (25,0) 46,7 (28,5) 49,2 (27,4) 58,3 (33,1) 59,1 (35,8) Faculty of Medicine
Table 31. Faculty of Medicine. Publications (P, full counts), PP(int collab) and PP(industry) for the whole publication period 2010-2017.
Department Indicator
P PP(int collab) PP(industry) Immunology, Genetics and Pathology 2624 58,9 14,7 Medical Biochemistry and Microbiology 924 67,1 6,4
Medical Cell Biology 421 46,8 5,9
Medical Sciences 3892 54,9 15,4
Neuroscience 1853 47,3 4,3
Public Health and Caring Sciences 1639 46,4 10,7
Surgical Sciences 2398 48,2 10,2
Women’s and Children’s Health 1670 46,2 4,5
Table 32. Faculty of Medicine. PP(int collab) and PP(industry) (within parentheses) by publication period. 3-year moving average. Department 2010-2012 2011-2013 2012-2014 2013-2015 2014-2016 2015-2017 Immunology, Genetics and Pathology 57,1 (16,6) 56,5 (15,3) 57,2 (13,7) 57,6 (13,0) 60,3 (13,0) 61,5 (13,4) Medical Biochemistry and Microbiology 69,7 (7,3) 66,4 (8,1) 64,8 (7,7) 62,9 (7,1) 66,1 (6,1) 66,7 (4,7) Medical Cell Biology 52,1 (9,7) 46,1 (7,1) 45,3 (7,3) 40,2 (4,8) 44,8 (3,4) 45,6 (2,8) Medical Sciences 51,3 (13,4) 54,3 (14,4) 54,4 (15,8) 55,2 (16,5) 56,6 (17,7) 57,7 (16,0) Neuroscience 51,4 (4,9) 48,3 (5,0) 43,0 (4,3) 42,5 (4,1) 45,1 (3,1) 48,3 (3,7) Public Health and
Caring Sciences 45,2 (12,9) 44,1 (9,3) 46,7 (9,8) 46,8 (9,8) 48,2 (9,3) 46,8 (9,3) Surgical Sciences 48,7 (11,6) 46,8 (13,4) 44,4 (11,8) 45,6 (10,2) 48,4 (8,8) 51,1 (8,5) Women’s and
36 3.3.4 Open access
For both figures in this section, proportion OA is given as percentages. OA is defined as publications belonging to any class of OA (Gold, green or hybrid). All OA measures use full counts.
Faculty of Pharmacy
Figure 34. Faculty of Pharmacy. Total Open Access by publication period. 3-year moving average.
Faculty of Medicine
Figure 35. Faculty of Medicine. Total Open Access by publication period. 3-year moving average.
0% 10% 20% 30% 40% 50% 60% 2011-2013 2012-2014 2013-2015 2014-2016 2015-2017 2016-2018 Pr op or tio n O pe n Ac ce ss Publication period
Medicinal Chemistry Pharmaceutical Biosciences Pharmacy
0% 10% 20% 30% 40% 50% 60% 70% 2011-2013 2012-2014 2013-2015 2014-2016 2015-2017 2016-2018 Pr op or tio n O pe n Ac ce ss Publication period
Immunology, Genetics and Pathology Medical Biochemistry and Microbiology Medical Cell Biology Medical Sciences
Neuroscience Public Health and Caring Sciences Surgical Sciences Women’s and Children’s Health
37
3.4 TekNat
The number of TekNat departments included in ABM is 10. Table 33 reports publication volume, fractional counts and full counts (within parentheses) by department and publication type, and WoS coverage. WoS coverage concerns the number of WoS publications of the four types represented in the table relative to all publications of these types for the department.
Table 33. Faculty of Science and Technology. Publication volume by publication type, and WoS coverage (in %). Publication period: 2010-2018. Data source: GLIS.
Department Publication type
Article Article in
anthology Monograph Conference paper Total coverage WoS Cell and Molecular
Biology 438,5 (1128) 18,1 (25) 1,2 (2) 4,9 (15) (1170) 462,6 91,9 Chemistry - BMC 272,3 (730) 7,2 (14) 1,0 (1) 2,2 (6) 282,6 (751) 91,7 Chemistry - Ångström Laboratory 784,3 (1605) 27,3 (44) 5,0 (8) 9,1 (25) (1682) 825,6 90,9 Earth Sciences 883,8 (2095) 46,7 (87) 5,4 (12) 99,3 (170) 1036,0 (2364) 73,7 Ecology and Genetics 888,6 (2074) 19,8 (41) 1,8 (3) 0,4 (1) (2119) 910,6 92,4 Engineering Sciences 1567,4 (2754) 120,9(159) 20,9 (32) 576,1 (862) 2285,3 (3807) 60,9 Information Technology 578,3 (1131) 73,2 (102) 5,5 (9) 868,8 (1365) 1525,8 (2607) 56,3 Mathematics 511,5 (839) 9,2 (10) 5,0 (6) 10,9 (17) 536,5 (872) 85,2 Organismal Biology 370,8 (880) 38,7 (47) 2,2 (3) 29,5 (42) 441,1 (972) 69,6 Physics and Astronomy 2451,0 (5744) 46,3 (59) 8,2 (10) 214,5 (412) 2720,0 (6225) 85,5
38 3.4.1 Publishing volume and publishing level–The Norwegian model
Figure 36. Faculty of Science and Technology. Norwegian score by publication period. 3-year moving average.
0 100 200 300 400 500 600 2011-2013 2012-2014 2013-2015 2014-2016 2015-2017 2016-2018 Sc or e Publication period
Cell and Molecular Biology Ecology and Genetics Physics and Astronomy Earth Sciences Information Technology Chemistry - BMC Chemistry - Ångström Laboratory Organismal Biology Engineering Sciences Mathematics
39
Table 34. Faculty of Science and Technology. Proportion (in %) publication fractions at level 2 relative to the sum of publication fractions across levels 1 and 2 (given within parentheses) by publication period. 3-year moving average. Department 2011-2013 2012-2014 2013-2015 2014-2016 2015-2017 2016-2018 Cell and Molecular Biology 44,2 (125,9) 44,1 (132,1) 35,0 (133,2) 32,7 (145,0) 30,9 (148,6) 30,4 (165,2) Chemistry- BMC 36,1 (84,9) 35,9 (124,8) 35,5 (122,0) 33,5 (111,3) 31,3 (103,3) 29,9 (104,6) Chemistry - Ångström Laboratory 31,1 (181,3) 31,9 (288,8) 33,3 (327,3) 31,7 (350,2) 29,5 (352,1) 25,4 (350,9) Earth Sciences 28,0 (269,2) 29,3 (283,5) 30,4 (313,7) 31,2 (302,5) 29,3 (309,5) 27,4 (283,2) Ecology and Genetics 38,1 (309,8) 39,6 (326,0) 41,3 (305,8) 45,1 (299,5) 47,5 (297,0) 44,7 (272,2) Engineering Sciences 23,5 (450,7) 24,0 (489,0) 22,8 (530,6) 24,9 (583,1) 23,8 (585,1) 23,8 (587,6) Information Technology 18,0 (255,1) 18,6 (268,5) 17,4 (321,1) 19,1 (355,2) 16,5 (383,6) 16,9 (379,8) Mathematics 34,3 (157,9) 28,4 (154,1) 29,6 (180,7) 34,3 (183,4) 34,2 (185,1) 35,4 (165,8) Organismal Biology 22,9 (112,7) 22,8 (99,6) 23,4 (97,7) 25,0 (115,3) 24,0 (123,0) 30,1 (130,7) Physics and Astronomy 36,8 (754,9) 38,7 (769,4) 40,1 (779,1) 39,2 (807,4) 37,1 (849,0) 36,3 (880,5)
3.4.2 Field normalized citation impact
Table 35. Faculty of Science and Technology. Publication fractions (P; full counts within parentheses), MNCS, PP(top 10%), MNJS and MJPPtop10% for the whole publication period 2010-2017.
Department Indicator
P MNCS PP(top 10%) MNJS MJPPtop10% Cell and Molecular Biology 330,6 (907) 1,50 16,7 1,52 16,6
Chemistry - BMC 309,9 (818) 0,86 8,7 1,03 10,9
Chemistry - Ångström Laboratory 757,0 (1604) 1,09 11,9 1,12 11,4
Earth Sciences 553,6 (1567) 0,93 7,7 1,01 10,1
Ecology and Genetics 697,1 (1750) 1,57 17,7 1,52 17,1
Engineering Sciences 1040,9 (1931) 0,91 7,4 1,05 10,3
Information Technology 377,6 (794) 0,99 9,7 0,98 9,7
Mathematics 364,1 (647) 1,06 10,1 1,08 11,0
Organismal Biology 232,6 (637) 1,51 15,7 1,48 14,1
40
Figure 37. Faculty of Science and Technology. MNCS by publication period. 3-year moving average.
Figure 38. Faculty of Science and Technology. PP(top 10%) by publication period. 3-year moving average.
0 0,2 0,4 0,6 0,8 1 1,2 1,4 1,6 1,8 2 2,2 2010-2012 2011-2013 2012-2014 2013-2015 2014-2016 2015-2017 M N CS Publication period
Cell and Molecular Biology Chemistry - BMC Chemistry - Ångström Laboratory Earth Sciences Ecology and Genetics Engineering Sciences Information Technology Mathematics
Organismal Biology Physics and Astronomy
0 2 4 6 8 10 12 14 16 18 20 22 2010-2012 2011-2013 2012-2014 2013-2015 2014-2016 2015-2017 PP (t op 1 0% ) Publication period
Cell and Molecular Biology Chemistry - BMC Chemistry - Ångström Laboratory Earth Sciences Ecology and Genetics Engineering Sciences Information Technology Mathematics
41
Figure 39. Faculty of Science and Technology. MNJS by publication period. 3-year moving average.
Figure 40. Faculty of Science and Technology. MJPPtop10% by publication period. 3-year moving average.
0 0,2 0,4 0,6 0,8 1 1,2 1,4 1,6 1,8 2 2,2 2010-2012 2011-2013 2012-2014 2013-2015 2014-2016 2015-2017 M N JS Publication period
Cell and Molecular Biology Chemistry - BMC Chemistry - Ångström Laboratory Earth Sciences Ecology and Genetics Engineering Sciences Information Technology Mathematics
Organismal Biology Physics and Astronomy
0 2 4 6 8 10 12 14 16 18 20 2010-2012 2011-2013 2012-2014 2013-2015 2014-2016 2015-2017 M JP Pt op 10 % Publication period
Cell and Molecular Biology Chemistry - BMC Chemistry - Ångström Laboratory Earth Sciences Ecology and Genetics Engineering Sciences Information Technology Mathematics
42 3.4.3 Collaboration
For all tables in this section, PP(int collab) and PP(industry) are given as percentages.
Table 36. Faculty of Science and Technology. Publications (P, full counts), PP(int collab) and PP(industry) for the whole publication period 2010-2017.
Department Indicator
P PP(int collab) PP(industry)
Cell and Molecular Biology 907 65,8 8,0
Chemistry - BMC 1604 60,0 12,5
Chemistry - Ångström Laboratory 818 54,2 4,9
Earth Sciences 1567 81,2 5,4
Ecology and Genetics 1750 74,9 3,0
Engineering Sciences 1931 50,0 11,6
Information Technology 794 57,9 6,0
Mathematics 647 61,8 1,5
Organismal Biology 637 72,2 2,5
Physics and Astronomy 4882 86,7 3,8
Table 37. Faculty of Science and Technology. PP(int collab) and PP(industry) (within parentheses) by publication period. 3-year moving average.
Department
2010-2012 2011-2013 2012-2014 2013-2015 2014-2016 2015-2017 Cell and Molecular
Biology 62,8 (12,3) 62,6 (10,9) 63,9 (8,8) 66,7 (6,0) 67,6 (5,3) 68,1 (4,6) Chemistry - BMC 55,8 (17,7) 56,6 (12,9) 51,5(10,4) 48,8 (7,2) 52,4 (10,0) 56,3 (9,9) Chemistry - Ångström Laboratory 59,2 (5,5) 60,5 (5,0) 59,6 (5,7) 58,8 (4,2) 60,2 (4,4) 60,9 (4,6) Earth Sciences 83,2 (6,0) 83,1 (5,1) 80,9 (5,3) 79,4 (4,9) 80,3 (5,5) 81,0 (5,1) Ecology and Genetics 71,5 (2,9) 72,4 (1,9) 73,4 (2,5) 75,3 (2,8) 77,6 (3,9) 78,9 (3,3) Engineering Sciences 45,8 (14,3) 45,2 (12,6) 46,0 (11,1) 48,4 (10,8) 51,1 (10,9) 54,0 (10,5) Information Technology 51,3 (6,6) 52,5 (5,5) 56,9 (3,8) 61,5 (4,8) 60,7 (5,5) 59,8 (7,5) Mathematics 57,8 (1,5) 63,1 (0,9) 65,1 (0,9) 62,7 (1,5) 60,1 (2,2) 63,9 (2,1) Organismal Biology 65,4 (3,2) 67,0 (1,6) 71,9 (0,5) 69,2 (0,9) 73,5 (1,5) 78,1 (2,8) Physics and Astronomy 85,5 (3,3) 86,5 (3,1) 87,3 (3,5) 88,0 (4,1) 87,9 (4,6) 87,1 (4,3) 3.4.4 Open access
For Figure 41, proportion OA is given as percentages. OA is defined as publications belonging to any class of OA (Gold, green or hybrid). All OA measures use full counts.
43
Figure 41. Faculty of Science and Technology. Total Open Access by publication period. 3-year moving average.
4 Brief discussion of the results
HumSam
One interesting trend is the increase in WoS coverage noticed for some departments in the Faculty of Arts. This result is further examined in Appendix 1.
Regarding the Norwegian model, the increase in proportion of publication fractions at level 2 for some departments in the Faculty of Arts is noteworthy (Table 7). Archeology and Ancient History, History and Philosophy all have an increase in the interval 18-20 percentage units from the publication period 2011-2013 to the period 2016-2018. This is also the case for English in the Faculty of Languages (Table 8). In addition, Faculty of Education and Faculty of Theology show an increase in the proportion of publication fractions at level 2 (of about 17 and 15 percentage units, respectively) (Table 9). In the Faculty of Social Sciences, the increase is most noteworthy for Economic History (25 percentage units), Economics (18 percentage units), Peace and Conflict Studies (16 percentage units) and Social and Economic Geography (14 percentage units) (Table 10).
When it comes to citation indicators, Peace and Conflict Studies is worth mentioning, since the department has very high figures for all four indicators with respect to the whole publication period (Table 14). Moreover, the proportion of author fractions at level 2 is also high for this department, especially for the period 2016-2018 (about 58%; Table 10). Thus, there is, for this department, an agreement between the citation impact performance and the Norwegian model performance.
The extreme OA trend for Game Design under the Faculty of Arts is mostly explained by a two-year period with approximately 50 book chapters made freely available. The faculty overall has an increasing trend in OA, apart from Game Design (Figure 20). Further, the Faculty of Education has a remarkably increasing development (Figure 22).
0% 10% 20% 30% 40% 50% 60% 70% 2011-2013 2012-2014 2013-2015 2014-2016 2015-2017 2016-2018 Pr op or tio n O pe n Ac ce ss Publication period
Cell and Molecular Biology Chemistry - BMC Chemistry - Ångström Laboratory Earth Sciences Ecology and Genetics Engineering Sciences Information Technology Mathematics