1
Uppsala University Annual Bibliometric Monitoring 2020
Per Ahlgren1, Louise Kennerberg1, and Erik Åkesson Kågedal2 1 Planning Division, Uppsala University
2 Uppsala University Library
Abstract
Uppsala University Annual Bibliometric Monitoring produces statistics on publication volume, publishing level, citation impact, collaboration (in terms of co-publishing) and open access. The aggregation level is primarily department, which means that it is primarily the departments of Uppsala University that are the units of analysis in the monitoring. Two main data sources are used: the local publication database of Uppsala University, DiVA, and the in-house version of the Web of Science database available at the Centre for Science and Technology Studies at Leiden University, the Netherlands. The considered publication period is 2011-2019. The results are presented in graphs or in tables, and in the next to last section, the results are briefly summarized. Regarding the domain Humanities and Social Sciences, the indicator proportion of publication fractions at level 2 (in the Norwegian model), the departments Economics and Peace and Conflict Studies have the highest values for the last three considered publication years. The highest values on the citation indicators, with respect to the domain Medicine and Pharmacy and the whole publication period, are observed for the three departments Medical Biochemistry and Microbiology, Immunology, Genetics and Pathology and Pharmacy. For the domain Science and Technology, the three biology departments, Cell and Molecular Biology, Ecology and Genetics and Organismal Biology, all have high values on the citation indicators with respect to the whole publication period.
1 Introduction
Uppsala University (UU) Annual Bibliometric Monitoring (ABM) produces statistics on publication volume, publishing level, citation impact, collaboration (in terms of co-publishing) and open access (OA). The aggregation level is primarily department, which means that it is primarily the departments of UU that are the units of analysis in ABM. However, the first subsection of the results section below reports outcomes for UU as a whole.
Values of several bibliometric indicators are obtained for the departments included in ABM. Indicator values are obtained by publication year. However, 3-year moving averages are generally applied. In “Quality and Renewal 2017” (“Kvalitet och förnyelse 2017”) (Malmberg et al., 2017), the peer assessments were complemented with a bibliometric report. One conclusion of the exercise was that an annual bibliometric report was desirable. The ABMs are a response to this conclusion and present extensive bibliometric statistics with regard to the UU departments.
UU has six development goals to renew education and research.1 For goal 2, “Develop research
excellence”, the citation impact indicator proportion of frequently cited publications (top 10%), an indicator described in Section 2.2, is particularly relevant among the indicators included in ABM. The two collaboration indicators of ABM (Section 2.3)–proportion of international collaborative publications and proportion of publications with industry–are both relevant for goals 3 and 6, “Strengthen transdisciplinary and challenge-driven research” and “Develop collaboration”, respectively.
2 The remainder of this report is structured as follows. Section 2 treats the data and methods of ABM. The results of ABM are reported in Section 3, whereas the results are briefly summarized in Section 4. Concluding remarks are given in Section 5.
2 Data and methods
Two main data sources are used in ABM: the local publication database of UU, DiVA, and the in-house version of the Web of Science (WoS) database available at the Centre for Science and Technology Studies (CWTS) at Leiden University, the Netherlands. The latter database is accessed via CWTS Monitor, a tool for bibliometric analysis of WoS publications and provided by CWTS. We used version 2020/2 in ABM 2020. DiVA data, or more precisely DiVA data as it appear in GLIS (Generellt Lednings Informations System), are used for the analysis according to the Norwegian model, and for obtaining the publication volume tables of the results section, whereas CWTS Monitor is used for the analysis of citation impact and collaboration. For the OA analysis, we use the same DiVA/GLIS data used for the Norwegian model analysis, combined with OA data from Unpaywall, DOAJ, OpenAPC and Sherpa Romeo.
In the Norwegian model, as well as in the citation analyses in ABM, author fractionalization is used. An author of a publication is assigned 1/n of the publication, where n is the number of authors of the publication. The fraction of the publication assigned to a given UU department is the sum of the author fractions with regard to the authors affiliated to the department. Note, though, that if an author is affiliated to m (m ≥ 2) UU departments in a publication, the author contributes with 1/(n × m) author fraction to all m departments (the author fraction an UU department has of a publication is more formally defined in Appendix 1).
In the citation analyses and in the collaboration analyses of ABM, only the WoS publication types “Article” and “Review” are taken into account. Further, in these two types of analyses, only core publications are used. Core publications are publications in international scientific journals in fields that are suitable for citation analysis.2 In the citation analyses, author self-citations are excluded. A citation
is counted as an author self-citation if the citing and the cited publication have at least one common author name.
For OA, we use full counts at the department level: each affiliated department is assigned the publication. OA is measured by defining the open access status for each publication and counting the number of publications affiliated to each department.
We use the following condition for department inclusion in the Norwegian model, the collaboration and the OA analyses:
(a) The researchers of the department have not their main affiliation to another unit.
Information on (a) was obtained from the offices for the three scientific domains of UU. These three domains are Humanities and Social Sciences (HumSam), Medicine and Pharmacy (MedFarm), and Science and Technology (TekNat).
With regard to the citation analyses of ABM, the following two inclusion conditions are applied: (a) the researchers of the department have not their main affiliation to another unit, and
(b) the department has at least 40 (core) publications (of the types “Article” and “Review”) in the period 2011-2018.
For each table below that reports citation analysis results, the expression “null” in a cell indicates that condition (a), but not condition (b), is satisfied by the department corresponding to the row of the cell.
2 For more on core journals, see the CWTS Leiden Ranking page https://www.leidenranking.com/information/indicators.
3
2.1 The Norwegian model
The Norwegian model considers publishing volume and publishing level. For level, the model does not use citations. Instead, the model takes into account the extent to which publications from a unit of analysis are published in publishing channels with large prestige. The channels that are considered in the model are journals, publishers and series. A large number of channels have been assessed in Norway by subject experts and assigned to one of three levels: level 0 (non-scientific channel), level 1 (scientific channel), and level 2 (scientific channel with extra-large prestige).
The Norwegian model comprises three publication types: article in journal or series, article in anthology and monograph. Conference papers are taken into account. If the host publication of a conference paper belongs to a series, the paper is classified as article in journal or series, otherwise the paper is classified as article in anthology. The weight of a publication is determined by its type and by the level of its channel. How publications are weighted is reported in Table 1.
Table 1. The weights of the Norwegian model as a function of publication type and publishing level. Publication type Level 1 Level 2
Article in journal or series 1 3
Article in anthology 0,7 1
Monograph 5 8
The publishing channels at level 2 in a given research field should publish a certain proportion (20%) of the publications of the field. By this rule, comparisons across fields are fairer, compared to if a certain number of channels, constant across fields, had been stipulated for level 2. The reason for this is that the access to level 2 channels becomes more equal across fields. Note that the proportion publications at level 2 for a given unit of analysis can be seen as a quality indicator (Schneider, 2009).
Some publications are excluded in analyses according to the Norwegian model, for instance: Letter to the editor
Working reports
Publications where the author has editorship Popular scientific publications
Each unit of analysis is assigned a publication score, a weighted expression for publishing volume and publishing level. The scores are obtained by multiplying author fractions by weights. For example, the publication score for a department, for a given publication year, with respect to articles published in level 2 journals is equal to the sum of the department author fractions over the articles (published in the year) multiplied by 3, the weight for a an article published in a level 2 journal (Table 1).
In ABM, each considered UU department is assigned a publication score for each considered publication year. In the application of the Norwegian model, the publication period is 2012-2019.
2.2 Field normalized citation impact
An important principle in evaluative bibliometrics is to compare like with like. It is a fact that citation volumes are not equal across research fields. For instance, the volumes are considerably larger in biomedicine than in pure mathematics. This is due to different citation practices in the two fields. If publications from fields as these two should be compared with regard to citation impact, some form of normalization of raw citations scores should be performed. In ABM, all used citation impact indicators are field normalized.
The publication period used for the citation analyses is 2011-2018. The end publication year in the version of CWTS Monitor used is 2018. Further, a later end year than 2018 would not be proper due to an inappropriately short citation window.
4 ABM makes use of two kinds of field normalized citation indicators: publication-level indicators and journal-level indicators. In the next section, we treat the former ones, whereas the latter ones are treated in the section after the next section.
Publication-level indicators
Two publication-level indicators are used, namely mean normalized number of citations per publication (MNCS) and proportion of frequently cited publications (top 10%) (PP(top 10%)). These two indicators, which complements each other, are used, for instance, in the CWTS Leiden Ranking 2020.3 For both
MNCS and PP(top 10%), and for the two journal-level indicators described below, a subject classification of publications is used for normalization purposes. The classification is generated by application of an advanced clustering methodology, in which a publication-publication relatedness measure based on direct citations between publications is utilized (Waltman & van Eck, 2012). The classification, which contains about 4,000 classes, is such that each publication belongs to exactly one class.4
Regarding MNCS, and for each publication from a given department, the citation score of the publication is divided by the mean citation score across the publications, published in the same year as the publication, in the class to which the publication belongs. The resulting value is a (field) normalized citation score (NCS) for the publication. The MNCS for the department is then obtained by dividing the weighted sum of NCS values over the publications from the department–where the weight of a publication consists of the author fraction the department has of the publication–by the sum of the department author fractions over the publications. If the department has a MNCS of, say, 1.2, the department performs 20% above world average (= 1).
For PP(top 10%), and publication i from the department, the same class in the classification is used as in the calculation of the NCS for i. The citation score distribution for the class, with respect to publications published the same year as i, is obtained, and the extent to which i belongs to the 10% most frequently cited publications is determined. The result for i is a value in the interval [0, 1], say (top 10%)i.5 PP(top 10%) for the department is then obtained by dividing the weighted sum of (top 10%)
values over the publications from the department–where the weight of a publication consists of the author fraction the department has of the publication–by the sum of the department author fractions over the publications (cf. the calculation of MNCS). If the department has a PP(top 10%) value of, say, 8, the department performs 20% below the world average (= 10).
Journal-level indicators
The two publication-level citation indicators are complemented by two corresponding journal-level citation indicators, namely mean normalized journal impact score per publication (MNJS) and mean journal proportion of top 10% publications (MJPP(top 10%)).
For MNJS, each journal is first assigned an impact score, NJS, for each of the considered publication years. NJS, for given year, is equal to the mean across the NCSs of the publications in the journal published that year. Thus, NJS is a field normalized variant of the well-known Journal Impact Factor, values of which is available in Journal Citation Reports (provided by Clarivate Analytics). The latter indicator is not field normalized, however. Now, for a department and each publication from the department, the department author fraction of the publication is multiplied by the NJS of the journal of
3 http://www.leidenranking.com/
4 The traditional approach to field normalization typically uses the journal subject categories in WoS. However, one problem with the traditional approach is that the subfields of a certain field, where the fields are defined at a given level of granularity, might differ substantially from each other in terms of citation volume (e.g., van Eck et al., 2013). Moreover, it is clearly more reasonable to group the publications themselves into subject classes than to group the publications into such classes based on subject class membership of their journals.
5 The approach to assign fractions of publications to the (for instance) 10% most frequently cited publications is described and discussed by Waltman and Schreiber (2013). The approach has the property to produce exactly 10% top 10% publications. In Appendix 1, we show how the extent to which publication i belongs to the 10% most frequently cited publications is calculated.
5 the publication with respect to the publication year of the publication. These operations yield a weighted sum over the publications from the department, and this sum is divided by the sum of the department author fractions over the publications. The result of the division is the MNJS for the department. Like MNCS, the world average for its journal-level counterpart, MNJS, is equal to 1.
The MJPP(top 10%) indicator is calculated as follows. For each combination of a journal, a class, and a publication year, the proportion of the publications in that journal, class, and year that belong (to a degree in the interval [0, 1]) to the 10% most frequently cited publications in that class and year is determined. This yields a PP(top 10%) value for each combination of a journal, a class, and a year. This value is assigned to all publications in that journal, class, and year. In this way, each publication obtains a JPP(top 10%) value. The MJPP(top 10%) value of a department is obtained dividing the weighted sum of JPP(top 10%) values over the publications from the department–where the weight of a publication consists of the author fraction the department has of the publication–by the sum of the department author fractions over the publications.
2.3 Collaboration
ABM uses two collaboration indicators: proportion of international collaborative publications (PP(int collab)) and proportion of publications with industry (PP(industry)). PP(int collab) for a department is the proportion of its publications that have been co-authored with two or more countries, whereas PP(industry) for a department is the proportion of its publications that have been co-authored with one or more industrial organizations. All private sector for profit business enterprises, covering all manufacturing and services sectors, are regarded as industrial organizations.
Here, and normally, full counts (and not fractional counts) are used for collaboration analysis. This means, taken international collaboration as an example, that if an UU department publication has at least one foreign address, relative to Sweden, the department is assigned one international collaborative publication, regardless of the author fraction the department has of the publication. If fractional counts are used, collaboration might be underestimated. However, publications with many organizations, like some of the publications in certain subfields of physics, do not indicate, to any larger extent, collaboration between the involved organizations. Such publications are included in the analysis. For the collaboration part of ABM, the publication period is 2011-2018.
2.4 Open access
Explained in a simple way, OA is the concept of publications distributed online, free of cost or other access barriers to the reader. In the research policy bill “Forskning, frihet, framtid” (Prop. 2020/21:60), the Government’s national direction towards open science states that scientific publications, which are the result of research financed with public funds, should be published using immediate OA, with effect from year 2021. It is a shared responsibility for all actors in the research system that the direction towards immediate OA is followed and achieved. Large national and international funders, such as the Swedish Research Council and Horizon 2020 (European Commission), also mandate OA publishing. This makes it relevant to measure the trend of OA publishing at UU.
How far the shift to OA publishing has come and the possibility and simplicity to achieve OA differs greatly between fields and publication patterns (Piwowar et al., 2018). It should be kept in mind that the results for OA presented in ABM are not field normalized, so direct comparisons between different fields or departments should be avoided.
There are different ways for a researcher to achieve OA and different ways to define a source of a publication as being OA. In ABM, we use the following definitions with respect to OA types of publications:
Gold OA: Articles published in an OA journal, in which all articles are accessible directly and freely on the journal or publisher website; books and book chapters accessible directly and freely on the publisher website. Gold OA may or may not involve publication fees (APC).
6 Hybrid OA: Articles published in a subscription journal but that are immediately free to read under an open license, in exchange for publication fees (APC).
Green OA: Accepted author manuscript versions or versions of record of articles published in a journal, but self-archived in open institutional or subject specific repositories, usually after an embargo period; self-archived books and book chapters. Green OA publications that also satisfies the definition for Gold or Hybrid OA are only assigned to these latter types and are thereby not counted as Green OA in ABM. Bronze OA: Publications free to read on the journal or publisher website, but lack a clearly identifiable license or other open access-information. Bronze OA is not included in ABM.
In ABM, we use DiVA, DOAJ, OpenAPC and Unpaywall as primary sources to determine if a publication is OA, and, if this is the case, to determine the OA type of the publication. A publication P is considered to be OA in ABM if at least one of the following five conditions is satisfied:
1) P is classified as ”gold”, “hybrid” or ”green” OA in Unpaywall (preprints excluded from “green”).
2) P is classified as ”gold” or “hybrid” in OpenAPC. 3) The full text of P is published OA in DiVA.
4) P is included in a journal classified as OA journal in DiVA. 5) P is included in a journal classified as OA in DOAJ.
Some publications are reclassified as “hybrid” from “green” if data in both DiVA and Sherpa Romeo supports the reclassification.
For the OA part of ABM, the publication period is 2012-2019. The publication types taken into account are the same that are used in the Norwegian model analysis, i.e. article in journal or series, article in anthology and monograph.
3 Results
In this section, we report the results of ABM. We first give, as a background, some results for UU as a whole. We then report the results for the UU departments, grouped by scientific domain.
Each of the sections 3.2-3.4, which corresponds to scientific domains, initially puts forward tables, which correspond to faculties and which report publication volumes (absolute and relative) and WoS coverage by department and publication type. Regarding WoS coverage, the validity of bibliometric indicators are in general higher if the coverage is high compared to low. Within a given section corresponding to a scientific domain, like Section 3.2, the other results are grouped based on what is analyzed: publishing volume and publishing level (the Norwegian model), field normalized citation impact, collaboration, and OA. Within a group of the indicated kind, the results are grouped by faculty.
3.1 UU as a whole
In Figure 1, an overview of the subject profile of UU is given.6 In the map of the figure, all WoS subject
categories in which UU has at least one publication of the types “Article” or “Review” and published in the period 2009-2018 are represented (239 categories). The size of a node indicates the publication output of UU in the corresponding category, whereas the color of a node indicates citation impact, measured by the indicator MNCS. Note that the MNCS is determined only by the locally relevant scientific neighborhoods of the publications, i.e. by the classes of the publications (cf. Section 2.2), instead of the subject categories at large. The color coding is as follows:
Blue: The MNCS, determined as indicated above, of the UU publications selected based on the subject category is far below world average
6 The subject profile overview was inspired by the CWTS web page at the following address: https://www.vosviewer.com/university-profile-maps.
7 Green: The MNCS, determined as indicated above, of the UU publications selected based on
the subject category is around world average.
Red: The MNCS, determined as indicated above, of the UU publications selected based on the subject category is far above world average.
Observe that the number of publications in some subject categories is very low. In such cases, the color of the category should be interpreted with caution.
Figure 1. Subject profile map for UU. Publication period: 2009-2018.
In Figure 2, UUs proportion (in %) of the total number of publication fractions (P) for UU in
combination with 10 benchmarking universities (see Table 2) is shown by publication year. The figure also shows UUs proportion of the total number of publication fractions belonging to the top 10% most frequently cited (P(top 10%)) for the same combination, where class (and thereby subject) and
publication year of the publications are taken into account. The figure can be interpreted as the research production of UU over time, relative to a comparable set of universities.
8
Figure 2. UUs proportion of publication fractions and of publication fractions belonging to the top 10% most frequently cited, by publication year and with regard to UU in combination with 10 benchmarking universities. Publication period: 2009-2018.
In Table 2, the 10 benchmarking universities are listed, together with a brief motivation for their inclusion.
Table 2. The 10 benchmarking universities.
Benchmark university Brief motivation for inclusion
Durham University European reference, belonging to the Matariki7 network
Eberhard Karls University Tübingen European reference, belonging to the Matariki and Guild8 networks Ghent University European reference, belonging to U4Society9 and Guild
Lund University Swedish reference, belonging to the SLUG10 network Stockholm University Swedish reference, belonging to the SLUG network University of Copenhagen Nordic reference
University of Gothenburg Swedish reference, belonging to the SLUG network University of Groningen European reference, belonging to U4Society and Guild University of Helsinki Nordic reference
University of Oslo Nordic reference
In Figure 3, UUs proportion of OA publications, and UUs proportion by OA type, relative to the total publication output are shown (the proportions are given as percentages). For UU as a whole, the proportion of OA publications is increasing during the considered publication period (the uppermost curve). Note that, for a given publication period, the proportion Total OA is equal to the sum of the proportions across the three OA types.
7 The Matariki network is an international group of seven universities. 8 The Guild is a network of 21 European universities.
9 U4Society is a collaboration between five European universities.
10 SLUG is a Swedish network of the Stockholm, Lund, Uppsala and Gothenburg universities.
7 7,5 8 8,5 9 9,5 10 2009 2010 2011 2012 2013 2014 2015 2016 2017 2018 Pr op or tio n Publication year P P(top 10%)
9
Figure 3. UUs proportion of OA publications, and UUs proportion by OA type, relative to the total publication output. Publication period: 2012-2019. 3-year moving average.
3.2 HumSam
The number of HumSam units of analysis included in ABM is 31: 28 departments and three faculties. For the latter, Faculty of Law and Faculty of Theology consists of only one large department each, responsible for all publications, and nearly all the publications of the Faculty of Education belong to the Department of Education.
Tables 3-6 report publication volume in terms of both fractional counts and full counts (within parentheses) by department (by faculty for Table 4) and publication type, and WoS coverage. WoS coverage concerns the number of WoS publications of the four types represented in the tables relative to all publications of these types for the department.
Table 3. Faculty of Arts. Publication volume by publication type, and WoS coverage (in %). Publication period: 2011-2019.
Department Publication type
Article Article in anthology Monograph Conference paper Total WoS coverage ALM 95,9 (131) 57,3 (72) 7,3 (9) 18,9 (30) 179,4 (242) 27,0 Archeology and Ancient History 223,6 (332) 232,3 (257) 17,9 (23) 30,1 (38) 503,9 (650) 18,3 Art History 80,5 (101) 91,7 (98) 9,8 (11) 21,7 (35) 203,7 (245) 16,1 Cultural Anthropology and Ethnology 129,2 (150) 129,0 (146) 28,7 (37) 4,3 (5) 291,3 (338) 9,0 Game Design 13,2 (21) 0,25 (1) 50,0 (50) 14,8 (25) 78,3 (97) 7,5 Gender Research 132,9 (182) 117,9 (147) 10,9 (15) 13,6 (18) 275,3 (362) 17,4 History 183,6 (204) 268,3 (291) 32,7 (38) 25,6 (27) 510,2 (560) 15,6 History of Sciences and Ideas 157,8 (174) 137,7 (152) 10,8 (15) 1,25 (2) 307,6 (343) 13,2 Literature 169,7 (185) 271,2 (292) 67,3 (71) 7,1 (9) 515,3 (557) 2,8 Musicology 123,5 (129) 66,0 (68) 10,0 (10) 1,0 (1) 200,5 (208) 11,3 Philosophy 171,1 (183) 143,3 (154) 12,8 (15) 10,5 (11) 337,8 (363) 21,9 0 10 20 30 40 50 60 2012-2014 2013-2015 2014-2016 2015-2017 2016-2018 2017-2019 Pr op or tio n O pe n Ac ce ss Publication period
10
Table 4. Faculty of Education, Faculty of Law and Faculty of Theology. Publication volume by publication type, and WoS coverage (in %). Publication period: 2011-2019.
Faculty Publication type
Article Article in
anthology Monograph Conference paper Total coverage WoS Faculty of
Education 340,5 (487) 317,5 (404) 47,8 (69) 56,8 (77) 762,7 (1037) 16,6 Faculty of Law 545,4 (606) 544,5 (573) 115,4 (136) 10,1 (12) 1215,3 (1327) 4,0 Faculty of
Theology 335,4 (378) 426,4 (456) 75,3 (88) 15,4 (18) 852,4 (940) 11,7 Table 5. Faculty of Languages. Publication volume by publication type, and WoS coverage (in %). Publication period: 2011-2019.
Department Publication type
Article Article in anthology Monograph Conference paper Total WoS coverage English 119,4 (129) 99,1 (108) 16,2 (17) 5,5 (6) 240,2 (260) 23,7 Linguistics and Philology 320,2 (379) 282,7 (315) 60,1 (71) 129,2 (192) 792,2 (957) 9,3 Modern Languages 238,5 (260) 224,4 (239) 19,0 (25) 34,7 (39) 516,5 (563) 8,1 Scandinavian Languages 390,1 (424) 179,9 (197) 21,7 (28) 57,8 (65) 649,5 (714) 3,0 Table 6. Faculty of Social Sciences. Publication volume by publication type, and WoS coverage (in %). Publication period: 2011-2019.
Department Publication type
Article Article in
anthology Monograph Conference paper Total coverage WoS Business Studies 302,1 (429) 260,1 (339) 51,6 (74) 131,1 (172) 745,0 (1014) 20,7 Economic History 131,5 (171) 222,5 (253) 32,5 (40) 30,3 (37) 416,9 (501) 14,0 Economics 160,9 (287) 10,0 (14) 4,6 (7) 0,0 (0) 175,6 (308) 75,6 Food Studies, Nutrition and Dietetics 72,7 (152) 59,1 (67) 1,8 (3) 3,3 (7) 136,9 (229) 36,1 Government 336,9 (469) 239,0 (283) 32,8 (40) 30,5 (34) 639,2 (826) 31,8 Housing and Urban
Research 171,4 (290) 152,2 (197) 18,7 (26) 52,7 (64) 395,0 (577) 20,4 Informatics and
Media 121,4 (177) 112,7 (141) 14,9 (18) 99,2 (145) 348,3 (481) 19,9 Peace and Conflict
Studies 254,2 (314) 173,3 (201) 25,1 (32) 16,5 (20) 469,1 (567) 36,5 Psychology 348,5 (701) 31,3 (39) 6,0 (8) 16,0 (23) 401,8 (771) 75,1 Russian and Eurasian Studies 249,7 (290) 151,2 (165) 21,9 (25) 11,8 (13) 434,7 (493) 17,6 Social and Economic Geography 146,4 (206) 57,7 (70) 6,7 (9) 9,0 (11) 219,7 (296) 50,4 Sociology 236,5 (332) 158,8 (206) 25,1 (37) 37,2 (49) 457,5 (624) 26,8 Statistics 67,2 (142) 1,0 (1) 1,0 (2) 2,5 (9) 71,6 (154) 89,1
11
3.2.1 Publishing volume and publishing level–The Norwegian model
Faculty of Arts
Figure 4. Faculty of Arts. Norwegian score by publication period. 3-year moving average.
Table 7. Faculty of Arts. Proportion (in %) publication fractions at level 2 relative to the sum of publication fractions across levels 1 and 2 (given within parentheses) by publication period. 3-year moving average.
Department 2012-2014 2013-2015 2014-2016 2015-2017 2016-2018 2017-2019 ALM 26,8 (19,9) 42,9 (24,7) 32,7 (29,3) 38,0 (32,1) 33,2 (32,4) 48,0 (40,2) Archeology and Ancient History 32,3 (73,6) 30,6 (94,9) 34,4 (91,6) 38,6 (97,3) 48,0 (89,2) 45,8 (86,1) Art History 7,8 (21,9) 6,7 (23,4) 7,4 (21,3) 3,2 (24,2) 11,9 (21,7) 17,2 (26,1) Cultural Anthropology and Ethnology 33,0 (31,8) 36,9 (39,3) 37,0 (41,0) 38,1 (45,1) 28,2 (46,1) 20,1 (48,7) Game Design 0,0 (3,0) 0,0 (4,0) 0,0 (2,1) 0,0 (1,8) 0,0 (1,1) 7,3 (4,6) Gender Research 30,4 (60,9) 22,5 (59,5) 19,6 (65,0) 27,3 (58,9) 27,9 (71,9) 32,4 (60,3) History 19,0 (105,0) 23,3 (104,6) 31,6 (94,9) 36,7 (96,6) 41,5 (99,2) 37,5 (90,6) History of Sciences and Ideas 28,2 (59,7) 30,7 (66,7) 30,1 (73,1) 28,5 (66,1) 21,3 (69,5) 31,2 (64,0) Literature 11,5 (95,8) 12,8 (94,0) 10,2 (83,0) 5,9 (67,3) 11,0 (54,5) 13,0 (46,2) Musicology 19,4 (31,0) 18,8 (37,2) 15,5 (32,2) 23,2 (30,2) 31,7 (30,0) 27,9 (34,0) Philosophy 39,7 (91,8) 36,5 (77,7) 46,1 (77,7) 49,4 (59,3) 49,3 (72,0) 47,2 (80,5) 0 10 20 30 40 50 60 70 2012-2014 2013-2015 2014-2016 2015-2017 2016-2018 2017-2019 Sc or e Publication period
ALM Archeology and Ancient History Art History Cultural Anthropology and Ethnology Game Design Gender Research
History History of Sciences and Ideas
Literature Musicology
12 Faculty of Education, Faculty of Law and Faculty of Theology
Figure 5. Faculty of Education, Faculty of Law and Faculty of Theology. Norwegian score by publication period. 3-year moving average.
Table 8. Faculty of Education, Faculty of Law and Faculty of Theology. Proportion (in %) publication fractions at level 2 relative to the sum of publication fractions across levels 1 and 2 (given within parentheses) by publication period. 3-year moving average.
Department 2012-2014 2013-2015 2014-2016 2015-2017 2016-2018 2017-2019 Faculty of Education 11,2 (144,6) 15,6 (149,3) 18,5 (170,0) 25,7 (164,5) 26,9 (149,7) 29,5 (159,1) Faculty of Law 13,3 (280,6) 19,7 (288,8) 25,0 (303,9) 24,4 (277,0) 21,7 (267,2) 18,4 (236,9) Faculty of Theology 34,1 (157,8) 36,1 (151,1) 34,0 (141,2) 31,1 (158,4) 37,8 (151,7) 35,4 (159,2) Faculty of Languages
Figure 6. Faculty of Languages. Norwegian score by publication period. 3-year moving average.
0 20 40 60 80 100 120 140 160 2012-2014 2013-2015 2014-2016 2015-2017 2016-2018 2017-2019 Sc or e Publication period
Faculty of Education Faculty of Law Faculty of Theology
0 10 20 30 40 50 60 70 80 2012-2014 2013-2015 2014-2016 2015-2017 2016-2018 2017-2019 Sc or e Publication period
English Linguistics and Philology Modern Languages Scandinavian Languages
13
Table 9. Faculty of Languages. Proportion (in %) publication fractions at level 2 relative to the sum of publication fractions across levels 1 and 2 (given within parentheses) by publication period. 3-year moving average.
Department 2012-2014 2013-2015 2014-2016 2015-2017 2016-2018 2017-2019 English 25,6 (53,8) 33,2 (59,5) 40,3 (59,0) 42,3 (66,3) 40,2 (64,3) 44,7 (56,7) Linguistics and Philology 51,9 (133,0) 51,2 (128,9) 54,5 (113,7) 48,7 (106,2) 54,7 (111,0) 46,7 (107,0) Modern Languages 15,8 (100,3) 16,2 (97,8) 15,1 (93,0) 18,1 (81,8) 13,0 (84,8) 18,2 (71,3) Scandinavian Languages 30,9 (119,9) 28,9 (134,9) 25,1 (109,6) 18,0 (107,2) 12,6 (73,8) 12,0 (70,4)
Faculty of Social Sciences
Figure 7. Faculty of Social Sciences. Norwegian score by publication period. 3-year moving average.
0 20 40 60 80 100 120 2012-2014 2013-2015 2014-2016 2015-2017 2016-2018 2017-2019 Sc or e Publication period
Business Studies Economic History
Economics Food Studies, Nutrition and Dietetics Government Housing and Urban Research Informatics and Media Peace and Conflict Studies Psychology Russian and Eurasian Studies Social and Economic Geography Sociology
14
Table 10. Faculty of Social Sciences. Proportion (in %) publication fractions at level 2 relative to the sum of publication fractions across levels 1 and 2 (given within parentheses) by publication period. 3-year moving average. Department 2012-2014 2013-2015 2014-2016 2015-2017 2016-2018 2017-2019 Business Studies 33,6 (134,7) 31,2 (145,2) 33,7 (168,9) 37,7 (163,3) 38,6 (158,2) 36,7 (118,6) Economic History 20,6 (92,1) 26,3 (81,6) 30,7 (66,7) 31,3 (61,7) 37,6 (62,3) 43,2 (52,2) Economics 38,3 (74,2) 44,3 (57,4) 45,7 (54,2) 50,3 (49,6) 50,6 (44,5) 57,6 (41,3) Food Studies, Nutrition and Dietetics 8,0 (25,0) 10,1 (24,7) 14,0 (16,1) 12,9 (16,1) 7,9 (26,4) 11,4 (42,5) Government 45,1 (148,9) 43,7 (154,0) 39,4 (169,8) 43,6 (171,1) 43,7 (182,3) 43,3 (153,9) Housing and Urban Research 37,4 (81,2) 33,4 (106,4) 31,0 (101,5) 30,6 (93,9) 32,3 (75,3) 38,0 (65,6) Informatics and Media 37,0 (70,9) 33,8 (60,4) 34,3 (51,0) 21,8 (50,3) 31,2 (51,0) 29,3 (59,2) Peace and Conflict Studies 46,6 (144,5) 51,3 (125,6) 56,9 (141,8) 53,2 (134,2) 56,1 (130,7) 52,6 (111,6) Psychology 21,8 (114,7) 21,4 (116,3) 25,0 (117,6) 26,2 (127,0) 29,1 (125,5) 32,4 (122,9) Russian and Eurasian Studies 21,8 (69,0) 32,9 (85,1) 31,4 (109,7) 33,6 (100,6) 28,4 (78,8) 36,2 (66,1) Social and Economic Geography 38,4 (46,6) 41,6 (58,1) 47,8 (58,0) 44,2 (59,9) 45,5 (68,9) 38,1 (72,0) Sociology 26,4 (100,9) 27,2 (106,1) 23,5 (103,2) 26,2 (111,9) 31,7 (118,1) 40,8 (122,3) Statistics 28,5 (17,2) 18,7 (15,6) 19,8 (21,0) 30,4 (29,6) 34,9 (32,6) 31,6 (31,8)
3.2.2 Field normalized citation impact
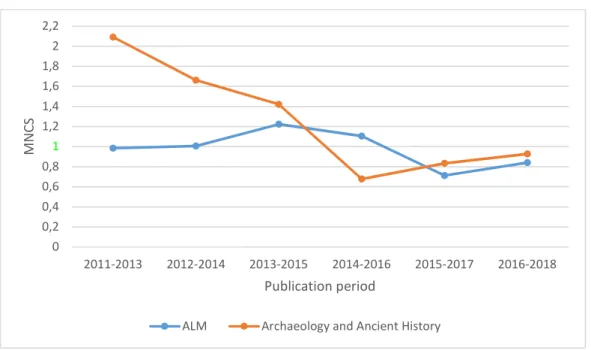
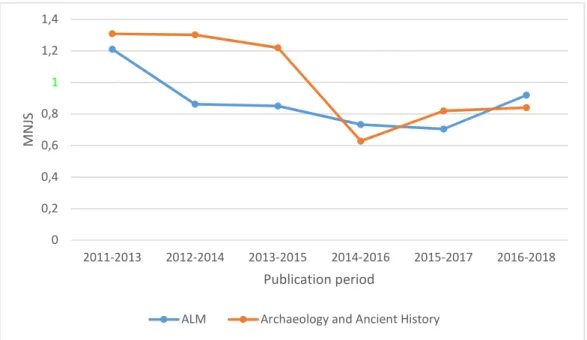
In each graph in this section, the label of the vertical axis that corresponds to the world average for the citation indicator of the graph is in green color.
Faculty of Arts
Table 11. Faculty of Arts. Publication fractions (P; full counts within parentheses), MNCS, PP(top 10%), MNJS and MJPPtop10% for the whole publication period 2011-2018.
Department Indicator
P MNCS PP(top 10%) MNJS MJPPtop10%
ALM 30,7 (47) 1,01 8,9 0,98 10,4
Archeology and Ancient History 33,4 (87) 1,19 10,5 0,92 9,2
Art History 3,3 (10) null null null null
Cultural Anthropology and Ethnology 7,8 (11) null null null null
Game Design 0,1 (2) null null null null
Gender Research 17,8 (34) null null null null
History 15,4 (21) null null null null
History of Sciences and Ideas 4,4 (7) null null null null
Literature 0,0 (0) null null null null
Musicology 0,7 (2) null null null null
15
Figure 8. Faculty of Arts. MNCS by publication period. 3-year moving average.
Figure 9. Faculty of Arts. PP(top 10%) by publication period. 3-year moving average.
0 0,2 0,4 0,6 0,8 1 1,2 1,4 1,6 1,8 2 2,2 2011-2013 2012-2014 2013-2015 2014-2016 2015-2017 2016-2018 M N CS Publication period
ALM Archaeology and Ancient History
0 2 4 6 8 10 12 14 16 18 20 22 24 26 28 30 32 34 36 38 2011-2013 2012-2014 2013-2015 2014-2016 2015-2017 2016-2018 PP (t op 1 0% ) Publication period
16
Figure 10. Faculty of Arts. MNJS by publication period. 3-year moving average.
Figure 11. Faculty of Arts. MJPPtop10% by publication period. 3-year moving average.
Faculty of Education, Faculty of Law and Faculty of Theology
Table 12. Faculty of Education, Faculty of Law and Faculty of Theology. Publication fractions (P; full counts within parentheses), MNCS, PP(top 10%), MNJS and MJPPtop10% by department and for the whole publication period 2011-2018.
Department Indicator
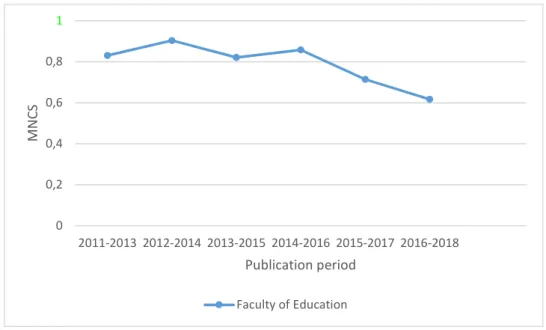
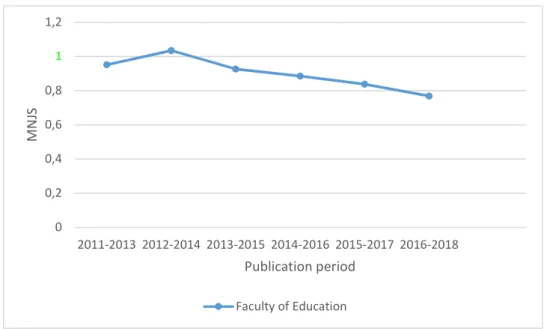
P MNCS PP(top 10%) MNJS MJPPtop10% Faculty of Education 66,0 (119) 0,74 7,0 0,85 8,2
Faculty of Law 20,5 (32) null null null null
Faculty of Theology 12,9 (25) null null null null
0 0,2 0,4 0,6 0,8 1 1,2 1,4 2011-2013 2012-2014 2013-2015 2014-2016 2015-2017 2016-2018 M N JS Publication period
ALM Archaeology and Ancient History
0 2 4 6 8 10 12 14 16 18 20 2011-2013 2012-2014 2013-2015 2014-2016 2015-2017 2016-2018 M JP Pt op 10 % Publication period
17
Figure 12. Faculty of Education. MNCS by publication period. 3-year moving average.
Figure 13. Faculty of Education. PP(top 10%) by publication period. 3-year moving average.
0 0,2 0,4 0,6 0,8 1 2011-2013 2012-2014 2013-2015 2014-2016 2015-2017 2016-2018 M N CS Publication period Faculty of Education 0 2 4 6 8 10 12 2011-2013 2012-2014 2013-2015 2014-2016 2015-2017 2016-2018 PP (t op 1 0% ) Publication period Faculty of Education
18
Figure 14. Faculty of Education. MNJS by publication period. 3-year moving average.
Figure 15. Faculty of Education. MJPPtop10% by publication period. 3-year moving average.
Faculty of Languages
Each of the four departments of the faculty has less than 40 publications for the publication period 2011-2018. This yields that the four departments are excluded from the citation analysis of ABM.
Table 13. Faculty of Languages. Publication fractions (P; full counts within parentheses), MNCS, PP(top 10%), MNJS and MJPPtop10% for the whole publication period 2011-2018.
Department Indicator
P MNCS PP(top 10%) MNJS MJPPtop10%
English 10,0 (11) null null null null
Linguistics and Philology 17,5 (33) null null null null
Modern Languages 5,3 (8) null null null null
Scandinavian Languages 6,9 (14) null null null null
0 0,2 0,4 0,6 0,8 1 1,2 2011-2013 2012-2014 2013-2015 2014-2016 2015-2017 2016-2018 M N JS Publication period Faculty of Education 0 2 4 6 8 10 12 14 16 2011-2013 2012-2014 2013-2015 2014-2016 2015-2017 2016-2018 M JP Pt op 10 % Publication period Faculty of Education
19 Faculty of Social Sciences
Table 14. Faculty of Social Sciences. Publication fractions (P; full counts within parentheses), MNCS, PP(top 10%), MNJS and MJPPtop10% by department and for the whole publication period 2011-2018.
Department Indicator
P MNCS PP(top 10%) MNJS MJPPtop10%
Business Studies 92,1 (167) 0,97 10,1 1,01 10,1
Economic History 21,0 (33) null null null null
Economics 86,7 (188) 1,12 14,4 1,22 13,5
Food Studies, Nutrition and Dietetics 35,7 (93) 0,61 2,3 0,76 6,4
Government 125,8 (207) 0,83 5,8 0,95 8,6
Housing and Urban Research 61,0 (128) 1,65 15,3 1,49 14,9
Informatics and Media 27,4 (48) 0,86 6,0 0,76 7,4
Peace and Conflict Studies 109,7 (157) 1,99 19,7 1,26 13,0
Psychology 235,2 (503) 1,13 9,9 1,13 10,3
Russian and Eurasian Studies 17,3 (32) null null null null
Social and Economic Geography 79,8 (126) 1,09 12,7 1,16 12,9
Sociology 64,1 (103) 0,65 2,1 0,76 5,1
Statistics 40,3 (93) 0,47 2,8 0,62 4,6
Figure 16.Faculty of Social Sciences. MNCS by publication period. 3-year moving average.
0 0,2 0,4 0,6 0,8 1 1,2 1,4 1,6 1,82 2,2 2,4 2,6 2,8 2011-2013 2012-2014 2013-2015 2014-2016 2015-2017 2016-2018 M N CS Publication period
Business Studies Economics Food studies, Nutrition and Dietetics Government
Housing and Urban Research Informatics and Media Peace and Conflict Research Psychology
Social and Economic Geography Sociology Statistics
20
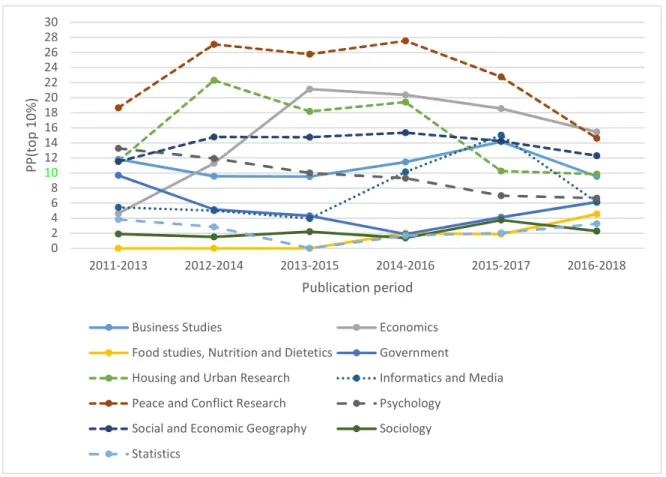
Figure 17. Faculty of Social Sciences. PP(top 10%) by publication period. 3-year moving average.
Figure 18. Faculty of Social Sciences. MNJS by publication period. 3-year moving average.
0 2 4 6 8 10 12 14 16 18 20 22 24 26 28 30 2011-2013 2012-2014 2013-2015 2014-2016 2015-2017 2016-2018 PP (t op 1 0% ) Publication period
Business Studies Economics Food studies, Nutrition and Dietetics Government
Housing and Urban Research Informatics and Media Peace and Conflict Research Psychology
Social and Economic Geography Sociology Statistics 0 0,2 0,4 0,6 0,8 1 1,2 1,4 1,6 1,8 2 2011-2013 2012-2014 2013-2015 2014-2016 2015-2017 2016-2018 Total M N JS Publication period
Business Studies Economics Food studies, Nutrition and Dietetics Government
Housing and Urban Research Informatics and Media Peace and Conflict Research Psychology
Social and Economic Geography Sociology Statistics
21
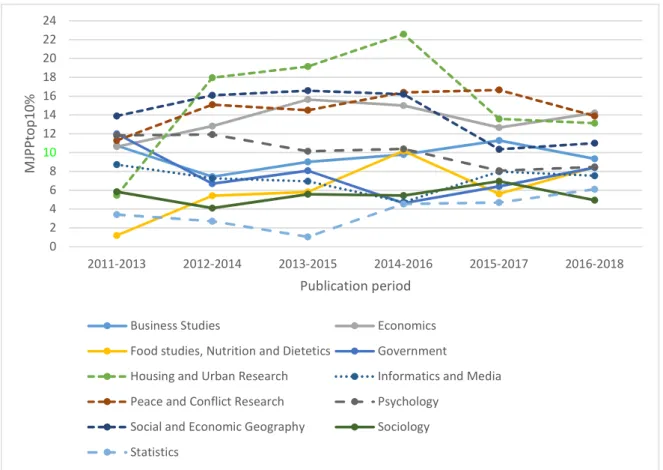
Figure 19. Faculty of Social Sciences. MJPPtop10% by publication period. 3-year moving average.
3.2.3 Collaboration
For all tables in this section, PP(int collab) and PP(industry) are given as percentages. Faculty of Arts
Table 15. Faculty of Arts. Publications (P, full counts), PP(int collab) and PP(industry) for the whole publication period 2011-2018.
Department Indicator
P PP(int collab) PP(industry)
ALM 47 38,3 0,0
Archeology and Ancient History 87 72,4 3,5
Art History 10 90,0 0,0
Cultural Anthropology and Ethnology 11 9,1 0,0
Game Design 2 100,0 50,0
Gender Research 34 23,5 2,9
History 21 23,8 0,0
History of Sciences and Ideas 7 14,3 0,0
Literature 0 - -
Musicology 2 100 0,0
Philosophy 25 8,0 0,0
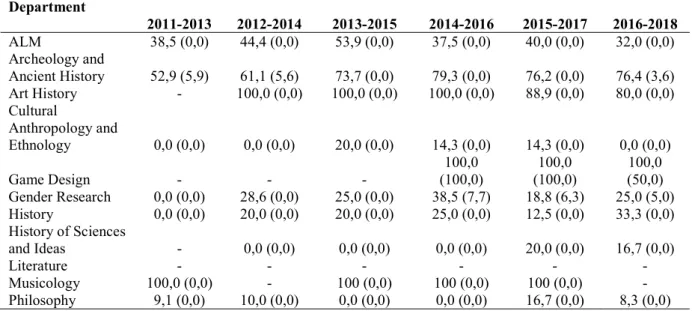
In Table 16, which gives values of PP(int collab) and PP(industry) by publication period, “-“ in a table cell indicates that indicator values for the corresponding department and period cannot be obtained, since the department has no WoS publications (of the type “Article” or “Review”) in the period.
0 2 4 6 8 10 12 14 16 18 20 22 24 2011-2013 2012-2014 2013-2015 2014-2016 2015-2017 2016-2018 M JP Pt op 10 % Publication period
Business Studies Economics Food studies, Nutrition and Dietetics Government
Housing and Urban Research Informatics and Media Peace and Conflict Research Psychology
Social and Economic Geography Sociology Statistics
22
Table 16. Faculty of Arts. PP(int collab) and PP(industry) (within parentheses) by publication period. 3-year moving average. Department 2011-2013 2012-2014 2013-2015 2014-2016 2015-2017 2016-2018 ALM 38,5 (0,0) 44,4 (0,0) 53,9 (0,0) 37,5 (0,0) 40,0 (0,0) 32,0 (0,0) Archeology and Ancient History 52,9 (5,9) 61,1 (5,6) 73,7 (0,0) 79,3 (0,0) 76,2 (0,0) 76,4 (3,6) Art History - 100,0 (0,0) 100,0 (0,0) 100,0 (0,0) 88,9 (0,0) 80,0 (0,0) Cultural Anthropology and Ethnology 0,0 (0,0) 0,0 (0,0) 20,0 (0,0) 14,3 (0,0) 14,3 (0,0) 0,0 (0,0) Game Design - - - (100,0) 100,0 (100,0) 100,0 (50,0) 100,0 Gender Research 0,0 (0,0) 28,6 (0,0) 25,0 (0,0) 38,5 (7,7) 18,8 (6,3) 25,0 (5,0) History 0,0 (0,0) 20,0 (0,0) 20,0 (0,0) 25,0 (0,0) 12,5 (0,0) 33,3 (0,0) History of Sciences and Ideas - 0,0 (0,0) 0,0 (0,0) 0,0 (0,0) 20,0 (0,0) 16,7 (0,0) Literature - - - - Musicology 100,0 (0,0) - 100 (0,0) 100 (0,0) 100 (0,0) - Philosophy 9,1 (0,0) 10,0 (0,0) 0,0 (0,0) 0,0 (0,0) 16,7 (0,0) 8,3 (0,0)
Faculty of Education, Faculty of Law and Faculty of Theology
Table 17. Faculty of Education, Faculty of Law and Faculty of Theology. Publications (P, full counts), PP(int collab) and PP(industry) for the whole publication period 2011-2018.
Department Indicator
P PP(int collab) PP(industry) Faculty of Education 119 29,4 0,0
Faculty of Law 32 25,0 0,0
Faculty of Theology 25 40,0 0,0
Table 18. Faculty of Education, Faculty of Law and Faculty of Theology. PP(int collab) and PP(industry) (within parentheses) by publication period. 3-year moving average.
Department 2011-2013 2012-2014 2013-2015 2014-2016 2015-2017 2016-2018 Faculty of Education 8,0 (0,0) 14,8 (0,0) 18,2 (0,0) 30,6 (0,0) 27,1 (0,0) 38,6 (0,0) Faculty of Law 20,0 (0,0) 37,5 (0,0) 30,0 (0,0) 28,6 (0,0) 16,7 (0,0) 22,2 (0,0) Faculty of Theology 25,0 (0,0) 28,6 (0,0) 33,3 (0,0) 40,0 (0,0) 41,7 (0,0) 54,6 (0,0) Faculty of Languages
Table 19. Faculty of Languages. Publications (P, full counts), PP(int collab) and PP(industry) for the whole publication period 2011-2018.
Department Indicator
P PP(int collab) PP(industry)
English 11 18,2 0,0
Linguistics and Philology 33 60,6 6,1
Modern Languages 8 0,0 0,0
23
Table 20. Faculty of Languages. PP(int collab) and PP(industry) (within parentheses) by publication period. 3-year moving average.
Department 2011-2013 2012-2014 2013-2015 2014-2016 2015-2017 2016-2018 English 0,0 (0,0) 50,0 (0,0) 50,0 (0,0) 25,0 (0,0) 0,0 (0,0) 12,5 (0,0) Linguistics and Philology 42,9 (7,1) 50,0 (14,3) 50,0 (12,5) 66,7 (11,1) 69,2 (0,0) 76,9 (0,0) Modern Languages 0,0 (0,0) 0,0 (0,0) 0,0 (0,0) 0,0 (0,0) 0,0 (0,0) - Scandinavian Languages 50,0 (0,0) 50,0 (0,0) 33,3 (0,0) 11,1 (0,0) 0,0 (0,0) 0,0 (0,0)
Faculty of Social Sciences
Table 21. Faculty of Social Sciences. Publications (P, full counts), PP(int collab) and PP(industry) for the whole publication period 2011-2018.
Department Indicator
P PP(int collab) PP(industry)
Business Studies 167 55,1 1,2
Economic History 33 39,4 0,0
Economics 188 44,1 1,6
Food Studies, Nutrition and Dietetics 93 54,8 2,1
Government 207 35,7 1,9
Housing and Urban Research 128 51,6 1,6
Informatics and Media 48 43,7 4,2
Peace and Conflict Studies 157 39,5 0,0
Psychology 503 41,6 2,6
Russian and Eurasian Studies 32 50,0 0,0
Social and Economic Geography 126 33,3 0,8
Sociology 103 21,4 0,0
Statistics 93 39,8 1,1
Table 22. Faculty of Social Sciences. PP(int collab) and PP(industry) (within parentheses) publication period. 3-year moving average.
Department 2011-2013 2012-2014 2013-2015 2014-2016 2015-2017 2016-2018 Business Studies 44,7 (1,8) 50,9 (0,0) 55,6 (0,0) 62,3 (0,0) 62,7 (0,0) 60,6 (1,4) Economic History 40,0 (0,0) 42,9 (0,0) 42,9 (0,0) 42,9 (0,0) 30,0 (0,0) 35,7 (0,0) Economics 39,4 (4,2) 43,6 (3,9) 46,2 (0,0) 47,0 (0,0) 40,3 (0,0) 46,0 (0,0) Food Studies, Nutrition and Dietetics 27,3 (0,0) 21,1 (0,0) 39,1 (0,0) 53,8 (0,0) 65,8 (5,3) 69,6 (3,6) Government 25,5 (0,0) 31,0 (1,7) 29,8 (1,5) 35,3 (2,4) 35,5 (1,1) 41,4 (2,7) Housing and Urban
Research 47,4 (5,3) 41,2 (3,9) 43,9 (1,8) 50,0 (0,0) 52,9 (0,0) 62,5 (0,0) Informatics and
Media 23,8 (0,0) 26,9 (7,7) 41,7 (8,3) 63,1 (10,5) 83,3 (0,0) 63,6 (0,0) Peace and Conflict
Studies 38,5 (0,0) 36,1 (0,0) 41,1 (0,0) 39,0 (0,0) 39,6 (0,0) 41,2 (0,0) Psychology 39,0 (2,3) 42,7 (2,9) 41,7 (2,8) 48,1 (3,7) 43,2 (2,9) 40,5 (1,9) Russian and Eurasian Studies 55,5 (0,0) 33,3 (0,0) 25,0 (0,0) 30,8 (0,0) 45,5 (0,0) 76,9 (0,0) Social and Economic Geography 24,3 (0,0) 20,0 (0,0) 28,3 (0,0) 35,0 (0,0) 34,9 (0,0) 39,7 (1,7) Sociology 14,8 (0,0) 18,9 (0,0) 19,5 (0,0) 17,1 (0,0) 26,6 (0,0) 25,5 (0,0) Statistics 40,0 (0,0) 34,6 (0,0) 25,0 (0,0) 44,1 (0,0) 40,4 (0,0) 42,1 (1,8)
24
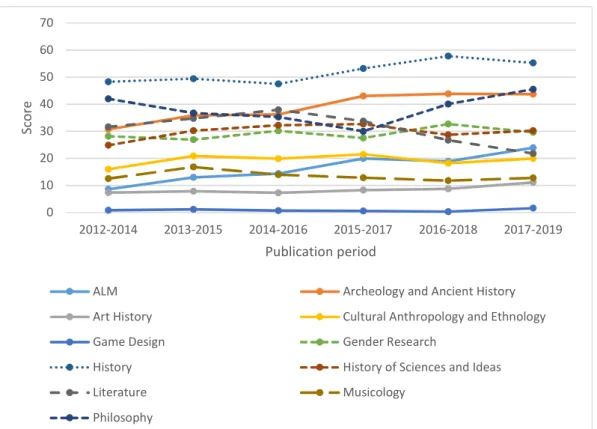
3.2.4 Open access
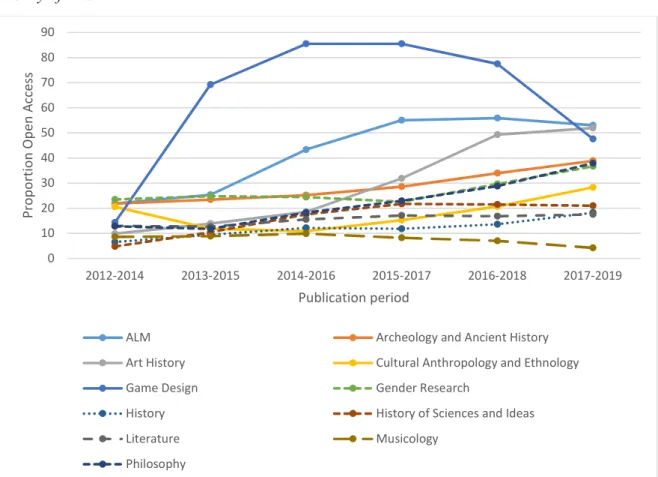
For all figures in this section, proportion OA publications is given as a percentage. Total OA is defined as publications belonging to any type of OA (gold, hybrid or green).
Faculty of Arts
Figure 20. Faculty of Arts. Total OA by publication period. 3-year moving average.
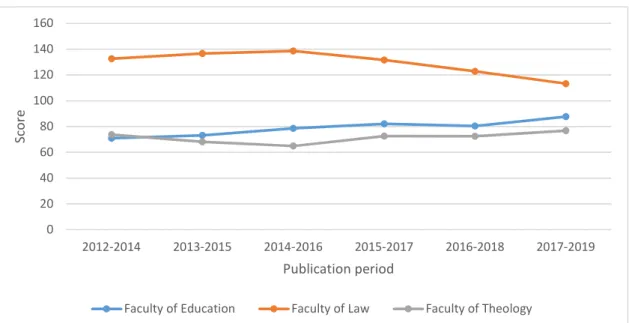
Faculty of Education, Faculty of Law and Faculty of Theology
Figure 21. Faculty of Education, Faculty of Law and Faculty of Theology. Total OA by publication period. 3-year moving average. 0 10 20 30 40 50 60 70 80 90 2012-2014 2013-2015 2014-2016 2015-2017 2016-2018 2017-2019 Pr op or tio n O pe n Ac ce ss Publication period
ALM Archeology and Ancient History Art History Cultural Anthropology and Ethnology Game Design Gender Research
History History of Sciences and Ideas
Literature Musicology Philosophy 0 5 10 15 20 25 30 35 2012-2014 2013-2015 2014-2016 2015-2017 2016-2018 2017-2019 Pr op or tio n O pe n Ac ce ss Publication period
25 Faculty of Languages
Figure 22. Faculty of Languages. Total OA Access by publication period. 3-year moving average.
Faculty of Social Sciences
Figure 23. Faculty of Social Sciences. Total OA by publication period. 3-year moving average.
0 5 10 15 20 25 30 35 2012-2014 2013-2015 2014-2016 2015-2017 2016-2018 2017-2019 Pr op or tio n O pe n Ac ce ss Publication period
English Linguistics and Philology Modern Languages Scandinavian Languages
0 10 20 30 40 50 60 2012-2014 2013-2015 2014-2016 2015-2017 2016-2018 2017-2019 Pr op or tio n O pe n Ac ce ss Publication period
Business Studies Economic History
Economics Food Studies, Nutrition and Dietetics Government Housing and Urban Research Informatics and Media Peace and Conflict Studies Psychology Russian and Eurasian Studies Social and Economic Geography Sociology
26
3.3 MedFarm
The number of MedFarm departments included in ABM is 11. Tables 23-24 report publication volume in terms of both fractional counts and full counts (within parentheses) by department and publication type, and WoS coverage. WoS coverage concerns the number of WoS publications of the four types represented in the tables relative to all publications of these types for the department.
Table 23. Faculty of Medicine. Publication volume by publication type, and WoS coverage (in %). Publication period: 2011-2019.
Department Publication type
Article Article in
anthology Monograph Conference paper Total coverage WoS Immunology, Genetics and Pathology 879,3 (2887) 22,8 (35) 0,0 (0) 7,7 (23) 909,8 (2945) 92,2 Medical Biochemistry and Microbiology 456,3 (1259) 10,5 (21) 0,3 (1) 1,5 (4) 468,6 (1285) 93,1 Medical Cell Biology 260,7 (541) 4,3 (7) 0,0 (0) 2,5 (3) 267,5 (551) 94,2 Medical Sciences 1424,9 (5204) 26,7 (35) 2,0 (2) 6,5 (15) 1460,2 (5256) 87,9 Neuroscience 972,6 (2170) 29,3 (41) 5,6 (9) 11,4 (31) 1018,9 (2251) 87,8 Public Health and
Caring Sciences 843,4 (2328) 76,2 (109) 13,3 (16) 10,0 (25) 943,0 (2478) 74,9 Surgical Sciences 1413,6 (3916) 67,1 (95) 3,1 (4) 16,6 (37) 1500,3 (4052) 80,7 Women’s and
Children’s Health 892,6 (2297) 45,0 (57) 5,3 (7) 2,4 (8) 945,3 (2369) 85,5 Table 24. Faculty of Pharmacy. Publication volume by publication type, and WoS coverage (in %). Publication period: 2011-2019.
Department Publication type
Article Article in
anthology Monograph Conference paper Total coverage WoS Medicinal
Chemistry 301,9 (744) 13,4 (16) 0,0 (0) 0,0 (0) 315,2 (760) 90,5 Pharmaceutical
Biosciences 442,4 (1013) 21,0 (23) 0,9 (1) 6,1 (13) 469,5 (1049) 88,6
27
3.3.1 Publishing volume and publishing level–The Norwegian model
Faculty of Medicine
Figure 24. Faculty of Medicine. Norwegian score by publication period. 3-year moving average. Table 25. Faculty of Medicine. Proportion (in %) publication fractions at level 2 relative to the sum of publication fractions across levels 1 and 2 (given within parentheses) by publication period. 3-year moving average. Department 2012-2014 2013-2015 2014-2016 2015-2017 2016-2018 2017-2019 Immunology, Genetics and Pathology 21,2 (296,7) 21,5 (305,1) 22,3 (300,8) 24,1 (307,7) 25,3 (288,8) 25,7 (274,2) Medical Biochemistry and Microbiology 31,2 (127,3) 32,8 (134,0) 32,4 (155,7) 34,9 (177,1) 33,8 (181,8) 32,4 (184,4) Medical Cell Biology 18,4 (80,1) 19,5 (89,0) 18,7 (92,2) 17,9 (91,9) 18,2 (74,4) 24,0 (75,5) Medical Sciences 20,0 (460,9) 19,2 (469,5) 17,8 (450,2) 16,9 (459,5) 17,1 (459,9) 18,3 (450,7) Neuroscience 16,6 (352,5) 15,8 (341,2) 15,6 (326,1) 14,4 (305,5) 13,1 (296,9) 14,1 (286,5) Public Health and Caring Sciences 13,6 (257,8) 13,7 (279,1) 15,9 (291,6) 16,6 (302,3) 17,8 (297,9) 18,4 (297,6) Surgical Sciences 17,5 (445,5) 18,6 (441,7) 18,6 (450,3) 17,2 (466,1) 16,9 (486,8) 15,2 (496,2) Women’s and Children’s Health 15,0 (257,2) 13,6 (291,9) 12,4 (302,4) 11,7 (332,9) 12,3 (314,8) 12,2 (320,6) 0 20 40 60 80 100 120 140 160 180 200 220 240 2012-2014 2013-2015 2014-2016 2015-2017 2016-2018 2017-2019 Sc or e Publication period
Immunology, Genetics and Pathology Medical Biochemistry and Microbiology Medical Cell Biology Medical Sciences
Neuroscience Public Health and Caring Sciences Surgical Sciences Women’s and Children’s Health
28 Faculty of Pharmacy
Figure 25 Faculty of Pharmacy. Norwegian score by publication period. 3-year moving average. Table 26. Faculty of Pharmacy. Proportion (in %) publication fractions at level 2 relative to the sum of publication fractions across levels 1 and 2 (given within parentheses) by publication period. 3-year moving average. Department 2012-2014 2013-2015 2014-2016 2015-2017 2016-2018 2017-2019 Medicinal Chemistry 23,9 (103,3) 18,4 (110,8) 16,6 (107,7) 18,8 (103,8) 19,2 (95,5) 18,2 (96,5) Pharmaceutical Biosciences 16,9 (149,6) 16,4 (132,2) 18,9 (135,4) 20,2 (144,6) 22,7 (162,0) 23,1 (147,9) Pharmacy 30,8 (65,7) 28,2 (65,3) 29,4 (69,9) 29,1 (77,4) 32,3 (81,8) 31,8 (82,2)
3.3.2 Field normalized citation impact
In each graph in this section, the label of the vertical axis that corresponds to the world average for the citation indicator of the graph is in green color.
Faculty of Medicine
Table 27. Faculty of Medicine. Publication fractions (P; full counts within parentheses), MNCS, PP(top 10%), MNJS and MJPPtop10% for the whole publication period 2011-2018.
Department Indicator
P MNCS PP(top
10%) MNJS MJPPtop10%
Immunology, Genetics and Pathology 776,2 (2623) 1,31 13,0 1,29 13,1 Medical Biochemistry and
Microbiology 347,9 (999) 1,52 16,5 1,55 17,1
Medical Cell Biology 196,3 (428) 1,05 11,1 1,07 10,9
Medical Sciences 1017,2 (4042) 1,19 12,0 1,18 12,1
Neuroscience 741,8 (1737) 0,94 8,8 0,99 10,1
Public Health and Caring Sciences 496,1 (1709) 0,94 8,6 0,98 9,3
Surgical Sciences 849,2 (2564) 1,04 10,4 1,11 11,4
Women’s and Children’s Health 613,4 (1770) 0,87 7,6 0,93 8,5
0 10 20 30 40 50 60 70 80 90 2012-2014 2013-2015 2014-2016 2015-2017 2016-2018 2017-2019 Sc or e Publication period
29
Figure 26. Faculty of Medicine. MNCS by publication period. 3-year moving average.
Figure 27. Faculty of Medicine. PP(top 10%) by publication period. 3-year moving average.
0 0,2 0,4 0,6 0,8 1 1,2 1,4 1,6 1,8 2011-2013 2012-2014 2013-2015 2014-2016 2015-2017 2016-2018 M N CS Publication period
Immunology, Genetics and Pathology Medical Biochemistry and Microbiology Medical Cell Biology Medical Sciences
Neuroscience Public Health and Caring Sciences Surgical Sciences Women’s and Children’s Health
0 2 4 6 8 10 12 14 16 18 20 2011-2013 2012-2014 2013-2015 2014-2016 2015-2017 2016-2018 PP (t op 1 0% ) Publication period
Immunology, Genetics and Pathology Medical Biochemistry and Microbiology Medical Cell Biology Medical Sciences
Neuroscience Public Health and Caring Sciences Surgical Sciences Women’s and Children’s Health
30
Figure 28. Faculty of Medicine. MNJS by publication period. 3-year moving average.
Figure 29. Faculty of Medicine. MJPPtop10% by publication period. 3-year moving average.
0 0,2 0,4 0,6 0,8 1 1,2 1,4 1,6 1,8 2011-2013 2012-2014 2013-2015 2014-2016 2015-2017 2016-2018 M N JS Publication period
Immunology, Genetics and Pathology Medical Biochemistry and Microbiology Medical Cell Biology Medical Sciences
Neuroscience Public Health and Caring Sciences Surgical Sciences Women’s and Children’s Health
0 2 4 6 8 10 12 14 16 18 20 2011-2013 2012-2014 2013-2015 2014-2016 2015-2017 2016-2018 M JP Pt op 10 % Publication period
Immunology, Genetics and Pathology Medical Biochemistry and Microbiology Medical Cell Biology Medical Sciences
Neuroscience Public Health and Caring Sciences Surgical Sciences Women’s and Children’s Health
31 Faculty of Pharmacy
Table 28. Faculty of Pharmacy. Publication fractions (P; full counts within parentheses), MNCS, PP(top 10%), MNJS and MJPPtop10% for the whole publication period 2011-2018.
Department Indicator
P MNCS PP(top 10%) MNJS MJPPtop10%
Medicinal Chemistry 217,9 (576) 0,94 8,7 0,93 8,3
Pharmaceutical Biosciences 338,2 (819) 0,93 6,5 0,99 9,2
Pharmacy 167,6 (376) 1,20 16,2 1,34 16,5
Figure 30. Faculty of Pharmacy. MNCS by publication period. 3-year moving average.
Figure 31. Faculty of Pharmacy. PP(top 10%) by publication period. 3-year moving average.
0 0,2 0,4 0,6 0,8 1 1,2 1,4 1,6 2011-2013 2012-2014 2013-2015 2014-2016 2015-2017 2016-2018 M N CS Publication period
Medicinal Chemistry Pharmaceutical Biosciences Pharmacy
0 2 4 6 8 10 12 14 16 18 20 22 2011-2013 2012-2014 2013-2015 2014-2016 2015-2017 2016-2018 PP (t op 1 0% ) Publication period
32
Figure 32. Faculty of Pharmacy. MNJS by publication period. 3-year moving average.
Figure 33. Faculty of Pharmacy. MJPPtop10% by publication period. 3-year moving average.
0 0,2 0,4 0,6 0,8 1 1,2 1,4 1,6 2011-2013 2012-2014 2013-2015 2014-2016 2015-2017 2016-2018 M N JS Publication period
Medicinal Chemistry Pharmaceutical Biosciences Pharmacy
0 2 4 6 8 10 12 14 16 18 20 2011-2013 2012-2014 2013-2015 2014-2016 2015-2017 2016-2018 M JP Pt op 10 % Publication period
33
3.3.3 Collaboration
For all tables in this section, PP(int collab) and PP(industry) are given as percentages. Faculty of Medicine
Table 29. Faculty of Medicine. Publications (P, full counts), PP(int collab) and PP(industry) for the whole publication period 2011-2018.
Department Indicator
P PP(int collab) PP(industry) Immunology, Genetics and Pathology 2623 59,3 14,0 Medical Biochemistry and Microbiology 999 66,9 6,1
Medical Cell Biology 428 47,8 4,5
Medical Sciences 4042 56,9 16,1
Neuroscience 1737 46,0 4,3
Public Health and Caring Sciences 1709 47,8 9,9
Surgical Sciences 2564 48,8 10,5
Women’s and Children’s Health 1770 46,0 6,3
Table 30. Faculty of Medicine. PP(int collab) and PP(industry) (within parentheses) by publication period. 3-year moving average. Department 2011-2013 2012-2014 2013-2015 2014-2016 2015-2017 2016-2018 Immunology, Genetics and Pathology 56,2 (15,3) 57,0 (14,0) 57,5 (13,2) 60,4 (13,1) 61,7 (13,4) 63,1 (14,0) Medical Biochemistry and Microbiology 65,7 (7,8) 64,6 (7,7) 63,2 (7,0) 66,1 (6,5) 66,2 (5,1) 68,9 (5,1) Medical Cell Biology 42,3 (3,8) 43,7 (4,6) 46,6 (5,8) 48,1 (6,1) 50,3 (5,2) 52,0 (3,8) Medical Sciences 54,2 (14,3) 54,3 (15,8) 55,1 (16,5) 56,6 (17,8) 57,9 (16,3) 60,0 (16,7) Neuroscience 45,8 (4,7) 40,8 (4,0) 39,9 (3,9) 43,0 (3,0) 47,3 (3,6) 49,9 (4,8) Public Health and
Caring Sciences 44,0 (9,3) 46,6 (10,0) 46,8 (9,9) 48,4 (9,5) 47,0 (9,3) 50,3 (10,3) Surgical Sciences 46,7 (13,4) 44,2 (11,9) 45,6 (10,3) 48,5 (9,1) 51,4 (9,0) 51,4 (8,9) Women’s and
Children’s Health 46,1 (7,1) 45,3 (7,3) 40,2 (4,8) 44,8 (3,4) 45,6 (4,4) 49,3 (7,0)
Faculty of Pharmacy
Table 31. Faculty of Pharmacy. Publications (P, full counts), PP(int collab) and PP(industry) for the whole publication period 2011-2018.
Department Indicator
P PP(int collab) PP(industry)
Medicinal Chemistry 576 49,6 18,9
Pharmaceutical Biosciences 819 60,3 26,4
34
Table 32. Faculty of Pharmacy. PP(int collab) and PP(industry) (within parentheses) by publication period. 3-year moving average. Department 2011-2013 2012-2014 2013-2015 2014-2016 2015-2017 2016-2018 Medicinal Chemistry 50,6 (28,5) 43,6 (25,0) 43,6 (19,5) 46,1 (14,3) 50,4 (13,0) 52,0 (14,3) Pharmaceutical Biosciences 58,9 (28,4) 62,0 (27,6) 59,3 (28,3) 61,4 (26,4) 59,0 (25,1) 61,0 (23,7) Pharmacy 38,3 (25,0) 46,0 (28,5) 49,2 (27,4) 58,3 (33,1) 59,1 (35,8) 62,3 (38,3)
3.3.4 Open access
For all figures in this section, proportion OA publications is given as a percentage. Total OA is defined as publications belonging to any type of OA (gold, hybrid or green).
Faculty of Medicine
Figure 34. Faculty of Medicine. Total OA by publication period. 3-year moving average.
0 10 20 30 40 50 60 70 80 2012-2014 2013-2015 2014-2016 2015-2017 2016-2018 2017-2019 Pr op or tio n O pe n Ac ce ss Publication period
Immunology, Genetics and Pathology Medical Biochemistry and Microbiology Medical Cell Biology Medical Sciences
Neuroscience Public Health and Caring Sciences Surgical Sciences Women’s and Children’s Health
35 Faculty of Pharmacy
Figure 35. Faculty of Pharmacy. Total OA by publication period. 3-year moving average.
3.4 TekNat
The number of TekNat departments included in ABM is 12. Table 33 reports publication volume, fractional counts and full counts (within parentheses) by department and publication type, and WoS coverage. WoS coverage concerns the number of WoS publications of the four types represented in the table relative to all publications of these types for the department.
Table 33. Faculty of Science and Technology. Publication volume by publication type, and WoS coverage (in %). Publication period: 2011-2019.
Department Publication type
Article Article in
anthology Monograph Conference paper Total coverage WoS Cell and Molecular
Biology 489,9 (1139) 14,0 (19) 1,2 (2) 5,4 (15) (1175) 510,4 94,0 Chemistry - BMC 363,2 (927) 9,8 (18) 1,0 (1) 3,9 (10) 377,9 (956) 91,8 Chemistry - Ångström Laboratory 1011,3 (2073) 34,7 (58) 4,2 (8) 15,6 (40) 1065,7 (2179) 92,0 Civil and Industrial
Engineering 69,3 (123) 30,9 (44) 13,5 (16) 64,9 (88) 178,7 (271) 25,6 Earth Sciences 887,6 (2143) 54,7 (100) 6,3 (12) 84,4 (145) 1033,1 (2400) 76,0 Ecology and Genetics 863,7 (2048) 15,4 (33) 2,8 (4) 0,4 (1) (2086) 882,3 93,3 Electrical Engineering 553,3 (994) 13,7 (25) 1,8 (3) 204,6 (345) 773,4 (1367) 71,0 Information Technology 598,4 (1186) 68,9 (97) 5,8 (10) 844,9 (1333) 1518,0 (2626) 60,1 Materials Science and Engineering 969,7 (1907) 39,0 (54) 6,0 (12) 195,7 (303) 1210,5 (2276) 73,6 Mathematics 513,3 (851) 8,7 (9) 3,5 (4) 8,6 (15) 534,0 (879) 88,1 Organismal Biology 383,0 (942) 34,9 (42) 2,2 (3) 26,7 (39) (1026) 446,8 72,5 Physics and Astronomy 2861,8 (6311) 38,6 (51) 7,2 (9) 197,3 (396) 3104,8 (6767) 89,4 0 10 20 30 40 50 60 70 80 2012-2014 2013-2015 2014-2016 2015-2017 2016-2018 2017-2019 Pr op or tio n O pe n Ac ce ss Publication period
36
3.4.1 Publishing volume and publishing level–The Norwegian model
Figure 36. Faculty of Science and Technology. Norwegian score by publication period. 3-year moving average.
0 50 100 150 200 250 300 350 400 450 500 550 600 650 2012-2014 2013-2015 2014-2016 2015-2017 2016-2018 2017-2019 Sc or e Publication period
Cell and Molecular Biology Chemistry - BMC
Chemistry - Ångström Laboratory Civil and Industrial Engineering Earth Sciences Ecology and Genetics
Electrical Engineering Information Technology Materials Science and Engineering Mathematics
37
Table 34. Faculty of Science and Technology. Proportion (in %) publication fractions at level 2 relative to the sum of publication fractions across levels 1 and 2 (given within parentheses) by publication period. 3-year moving average. Department 2012-2014 2013-2015 2014-2016 2015-2017 2016-2018 2017-2019 Cell and Molecular Biology 42,9 (149,1) 34,5 (152,1) 32,6 (161,9) 32,3 (169,2) 31,6 (187,3) 30,5 (185,2) Chemistry- BMC 34,6 (134,6) 34,6 (128,6) 32,5 (118,4) 30,7 (109,7) 29,3 (111,1) 27,0 (99,9) Chemistry - Ångström Laboratory 31,9 (298,9) 33,0 (334,3) 31,6 (356,6) 29,6 (355,0) 25,6 (350,3) 21,7 (354,3) Civil and Industrial Engineering 29,3 (17,1) 14,6 (24,0) 26,5 (32,9) 26,0 (33,5) 25,6 (36,6) 22,8 (48,2) Earth Sciences 29,3 (285,6) 30,4 (314,9) 31,0 (306,0) 28,8 (311,5) 26,9 (283,3) 26,3 (277,7) Ecology and Genetics 39,1 (319,3) 40,7 (304,6) 44,7 (301,4) 47,0 (301,3) 44,4 (278,5) 40,4 (253,0) Electrical Engineering 23,4 (158,9) 22,4 (177,2) 23,8 (189,0) 22,2 (200,1) 23,8 (203,2) 21,8 (189,6) Information Technology 18,7 (269,3) 17,5 (321,9) 19,1 (357,2) 16,3 (386,4) 16,4 (385,3) 15,0 (369,8) Materials Science and Engineering 24,4 (303,5) 23,8 (325,2) 25,5 (356,5) 25,0 (344,7) 24,0 (348,9) 18,9 (337,3) Mathematics 28,6 (153,1) 29,6 (180,7) 34,3 (183,4) 34,2 (185,1) 35,4 (165,8) 31,6 (157,6) Organismal Biology 27,1 (111,1) 26,9 (106,4) 27,3 (121,5) 25,4 (128,5) 30,8 (135,4) 31,8 (122,3) Physics and Astronomy 38,6 (773,3) 39,3 (794,3) 35,6 (892,8) (1020,7) 31,1 (1107,5) 29,1 (1153,0) 30,1
3.4.2 Field normalized citation impact
In each graph in this section, the label of the vertical axis that corresponds to the world average for the citation indicator of the graph is in green color.
Table 35. Faculty of Science and Technology. Publication fractions (P; full counts within parentheses), MNCS, PP(top 10%), MNJS and MJPPtop10% for the whole publication period 2011-2018.
Department Indicator
P MNCS PP(top 10%) MNJS MJPPtop10%
Cell and Molecular Biology 389,2 (959) 1,38 16,7 1,41 16,3
Chemistry - BMC 291,0 (796) 0,90 10,1 1,04 11,7
Chemistry - Ångström Laboratory 793,0 (1691) 1,01 11,1 1,12 12,3 Civil and Industrial Engineering 23,6 (46) 0,71 2,2 0,78 6,1
Earth Sciences 564,6 (1626) 0,92 7,6 1,02 10,3
Ecology and Genetics 671,7 (1752) 1,65 18,5 1,55 17,7
Electrical Engineering 385,7 (732) 0,86 7,6 1,03 10,0
Information Technology 386,6 (832) 1,08 10,4 1,04 10,5
Materials Science and Engineering 709,2 (1490) 0,96 7,1 1,08 10,3
Mathematics 357,7 (652) 1,08 11,2 1,04 10,2
Organismal Biology 231,9 (650) 1,43 13,4 1,36 12,5
38
Figure 37. Faculty of Science and Technology. MNCS by publication period. 3-year moving average.
Figure 38. Faculty of Science and Technology. PP(top 10%) by publication period. 3-year moving average.
0 0,2 0,4 0,6 0,8 1 1,2 1,4 1,6 1,8 2 2011-2013 2012-2014 2013-2015 2014-2016 2015-2017 2016-2018 M N CS Publication period
Cell and Molecular Biology Chemistry - BMC
Chemistry - Ångström Laboratory Civil and Industrial Engineering Earth Sciences Ecology and Genetics
Electrical Engineering Information Technology Materials Science and Engineering Mathematics
Organismal Biology Physics and Astronomy
0 2 4 6 8 10 12 14 16 18 20 22 2011-2013 2012-2014 2013-2015 2014-2016 2015-2017 2016-2018 PP (t op 1 0% ) Publication period
Cell and Molecular Biology Chemistry - BMC
Chemistry - Ångström Laboratory Civil and Industrial Engineering Earth Sciences Ecology and Genetics
Electrical Engineering Information Technology Materials Science and Engineering Mathematics
39
Figure 39. Faculty of Science and Technology. MNJS by publication period. 3-year moving average.
Figure 40. Faculty of Science and Technology. MJPPtop10% by publication period. 3-year moving average.
0 0,2 0,4 0,6 0,8 1 1,2 1,4 1,6 1,8 2 2011-2013 2012-2014 2013-2015 2014-2016 2015-2017 2016-2018 M N JS Publication period
Cell and Molecular Biology Chemistry - BMC
Chemistry - Ångström Laboratory Civil and Industrial Engineering Earth Sciences Ecology and Genetics
Electrical Engineering Information Technology Materials Science and Engineering Mathematics
Organismal Biology Physics and Astronomy
0 2 4 6 8 10 12 14 16 18 20 2011-2013 2012-2014 2013-2015 2014-2016 2015-2017 2016-2018 M JP Pt op 10 % Publication period
Cell and Molecular Biology Chemistry - BMC
Chemistry - Ångström Laboratory Civil and Industrial Engineering Earth Sciences Ecology and Genetics
Electrical Engineering Information Technology Materials Science and Engineering Mathematics