ALTERATION AND MINERAL PARAGENESIS OF THE MCARTHUR RIVER AND FOX LAKE URANIUM DEPOSITS, ATHABASCA BASIN: A NEW MODEL FOR THE
FORMATION OF UNCONFORMITY-RELATED URANIUM DEPOSISTS
by John DeDecker
Copyright by John DeDecker 2019 All Rights Reserved
A thesis submitted to the Faculty and Board of Trustees of the Colorado School of Mines in partial fulfillment of the requirements for the degree of Doctor of Philosophy (Geology).
Golden, Colorado Date _________________________ Signed: _________________________ John DeDecker Signed: _________________________ Thomas Monecke Thesis Advisor Signed: _________________________ Richard Wendlandt Thesis Co-advisor Golden, Colorado Date _________________________ Signed: _________________________ M. Steven Enders Professor and Interim Department Head
Department of Geology and Geological Engineering
ABSTRACT
The McArthur River uranium mine in the Athabasca Basin, Canada, hosts the largest high-grade uranium deposit in the world, accounting for 12% of global uranium production in 2015. McArthur River is a Proterozoic unconformity-related uranium deposit, with ore bodies located in the P2 fault zone at the contact between metamorphic basement rocks and overlying conglomerate, and up to 120 m below the unconformity in basement rock. Oxidized basinal fluids are considered the most likely medium for transporting dissolved UO22+ to the
unconformity where precipitation as UO2 occurred in response to the reduction of the fluids.
A comprehensive study was undertaken to unravel the nature of the reductant causing the precipitation of UO2. Core logging and sample collection were followed by bulk rock
compositional analysis. Optical microscopy, scanning electron microscopy, and electron microprobe analysis were used to establish the mineral paragenesis. Here, a new model for the reduction of uranium at McArthur River is proposed. The observations indicate that the P2 reverse fault is characterized by the abundant presence of fault-hosted pre-ore pyrite veins. The formation of these veins resulted in the illitization of feldspar in the basement rocks. Oxidizing, high-salinity Na-Mg-Ca chloride basinal fluids penetrated into the basement along the P2 fault and oxidized the pre-ore pyrite veins. Pyrite in the veins was replaced by Fe3+-bearing sudoite. Fe-sudoite altered pyrite shows extreme sulfur isotope fractionation consistent with oxidation of pyrite by thiosulfate disproportionation. It is hypothesized that the reaction of basinal fluids with pre-ore pyrite was responsible for the reduction of UO22+ at McArthur River.
A comparative study of the nearby Fox Lake unconformity-related uranium deposit was performed to evaluate the general applicability of the genetic model developed for McArthur River. The Fox Lake uranium deposit is a complex-type unconformity-related uranium deposit 10 km west of McArthur River. This study is the first comprehensive investigation of the Fox Lake deposit, and summarizes key findings that constrain the paragenesis and alteration
located along the C-10 fault zone at the unconformity between metamorphic basement rock and overlying basal conglomerate of the Manitou Falls Formation. The investigations at Fox Lake included extensive drill core logging and systematic sampling. Bulk compositional analyses were performed to complement core logging. A paragenesis was established using optical and
scanning electron microscopy, and electron microprobe analysis. Petrographic and sulfur isotope investigations show that the large amount of pre-ore pyrite occurring in sandstone above the C-10 fault was oxidized by thiosulfate disproportionation and replaced by Fe-sudoite and a second generation of pyrite. The evidence suggests that the oxidation of pre-ore sulfide minerals by basinal fluids resulted in the precipitation of uraninite. These results are consistent with the genetic model proposed for McArthur River. In addition to the traditional vector of dravite and sudoite alteration, the presence of pyrite associated with faulted basement rocks should be a vector for the exploration of unconformity-related uranium deposits.
TABLE OF CONTENTS ABSTRACT...iii LIST OF FIGURES...vi LIST OF TABLES...xi ACKNOWLEDGEMENTS...xiii CHAPTER 1 INTRODUCTION...1 1.1 References...3
CHAPTER 2 ALTERATION ASSOCIATED WITH BASMENT FAULTS IN UNCONFORMITY-RELATED URANIUM DEPOSITS: CASE STUDY AT THE MCARTHUR RIVER URANIUM MINE, ATHABASCA BASIN...5
2.1 Geological Background...7
2.1..1 Athabasca Basin...7
2.1.2 Sedimentary Host Rocks...8
2.1.3 Basement Rocks...9
2.1.4 P2 Fault Zone...10
2.1.5 Uranium Ore Bodies...10
2.1.6 Paragenesis...11
2.2 Materials and Methods...12
2.2.1 Fieldwork...12
2.2.2 Bulk Compositional Analysis...15
2.2.4 Cathodoluminescence Investigations...16
2.2.5 Electron Microprobe Analysis...16
2.3 Results...17
2.3.1 Core Logging and Whole Rock Geochemical Composition...17
2.3.2 Optical Petrography and Scanning Electron Microscopy...27
2.3.3 Paragenesis...34
2.3.4 Electron Microprobe Analysis...41
2.4 Discussion...55 2.4.1 Pre-ore Alteration...55 2.4.2 Ore-stage Alteration...59 2.4.3 Genetic Model...63 2.5 Conclusions...64 2.6 References………..65
CHAPTER 3 EXTREME ABIOTIC SULFUR ISOTOPE FRACTIONATIONAT THE MCARTHUR RIVER URANIUM MINE, CANADA...70
3.1 Methods...72
3.2 Mineral Paragenesis and Proposed Genetic Model...73
3.3 Sulfur Isotope Fractionation...74
3.4 Implications for the Genetic Model...79
3.5 Conclusions...82
3.6 References………..83
CHAPTER 4 THE FOX LAKE UNCONFORMITY-RELATED URANIUM DEPOSIT, ATHABASCA BASIN: PARAGENESIS OF ALTERATION MINERALS AND POSSIBLE IMPLICATIONS TO ORE DEPOSITION...86
4.1.1 Athabasca Basin...88
4.1.2 Comparison of Ore Bodies at Fox Lake With Those at Cigar Lake and McArthur River...90
4.1.3 Paragenesis...91
4.2 Methods...92
4.2.1 Core Logging and Sampling...92
4.2.2 Whole Rock Compositional Analysis...92
4.2.3 Optical Petrography and SEM Investigations...93
4.2.4 Cathodoluminescence Investigations...95
4.2.5 Electron Microprobe Analysis...95
4.3 Results...96
4.3.1 Core Logs...96
4.3.2 Bulk Compositional Analyses...101
4.3.3 Unconformity-related Ore Zone...101
4.3.4 Perched Uranium...110
4.3.5 Chlorite Breccia...120
4.3.6 C-10 Fault and C-10 Alteration Zone...122
4.3.7 Electron Microprobe Analysis...131
4.4 Discussion...141
4.4.1 Pre-ore Alteration...149
4.4.2 Ore-stage Alteration...151
4.4.3 Genetic Model...153
4.6 References...156
CHAPTER 5 ABIOTIC SULFUR ISOTOPE FRACTIONATION IN SULFIDE MINERALS AT THE FOX LAKE UNCONFORMITY-RELATED URANIUM DEPOSIT, ATHABASCA BASIN CANADA: EVIDENCE FOR THIOSULFATE DISPROPORTIONATION...160
5.1 Geological Background...162
5.2 Methods and Materials...162
5.3 Results...165
5.3.1 Macroscopic Observations...165
5.3.2 Paragenesis of Alteration Minerals at the Fox Lake U Deposit...166
5.3.3 Composition of Sulfide and Sulfarsenide Minerals...170
5.3.4 Sulfur Isotope Composition of Sulfide and Sulfarsenide Minerals...171
5.4 Discussion...176
5.4.1 Proposed Genetic Model for Unconformity-related U Deposits...176
5.4.2 Sulfur Isotope Compositions...176
5.5 Conclusions...178
5.6 References...178
CHAPTER 6 CONCLUSIONS...180
6.1 Research Findings...180
6.2 Recommendations for Future Works...182
LIST OF FIGURES
Figure 2.1 Geologic map of the Athabasca Basin with locations of terranes, major structures,
and uranium deposits. ...8
Figure 2.2 Geologic map of the McArthur River uranium deposit showing general basement rock types, faults, mineralized zones, and the locations of drill holes logged and sampled ...13
Figure 2.3 Core logs for drill holes MC-410-1, MC-410-2, and MC-415...23
Figure 2.4 Reflected and transmitted light images of pyrite veins in the P2 fault zone ...30
Figure 2.5 BSE images of pyrite veins distal and proximal to the unconformity ...32
Figure 2.6 Barite occurrence in sudoite-altered basement rock...33
Figure 2.7 Cathodoluminescence images of quartz veins associated with fault-hosted pyrite....33
Figure 2.8 Ore-stage uraninite and alteration associated with sandstone-hosted ore bodies...35
Figure 2.9 BSE images of ore-stage uraninite and alteration minerals associated with sandstone-hosted uranium ore bodies...37
Figure 2.10 BSE images of ore-stage uraninite and alteration minerals associated with sandstone-hosted uranium ore bodies...38
Figure 2.11 BSE images of ore-stage uraninite and alteration minerals associated with basement-hosted uranium ore bodies...39
Figure 2.12 Microtextural relationships between late alteration minerals...40
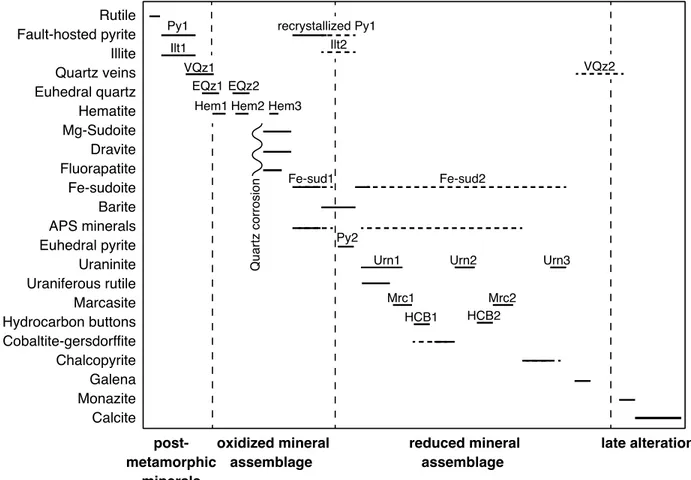
Figure 2.13 Paragenetic sequence of alteration minerals in sandstone and metamorphic basement rocks along the P-2 fault...40
Figure 2.14 Octahedral site occupancy of chlorites determined by EMP analysis and formula calculation using 14 oxygens...43
Figure 2.15 Microprobe spots for MC-411-1 660.5...44
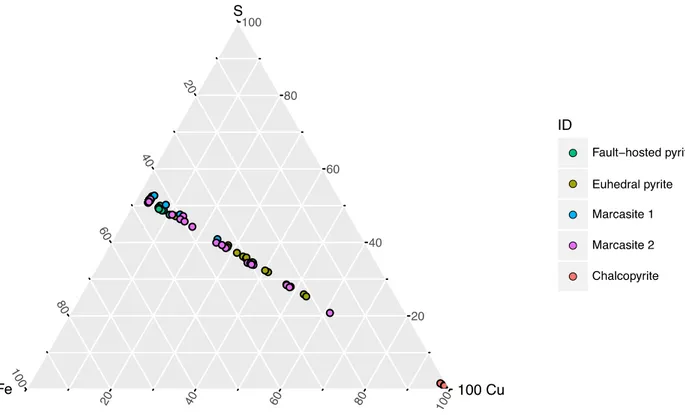
Figure 2.16 Ternary diagram plotting concentrations of Fe, S, and 100 times Cu (wt. %)
for fault-hosted pyrite, euhedral pyrite, marcasite, and chalcopyrite...48
Figure 2.17 Compositional data for sulfarsenide minerals...48 Figure 2.18 Ternary diagram showing variation in Pb, Si, and Ca (mol%) between sandstone-
hosted Urn1, Urn2, Urn3, and basement-hosted uraninite and uraniferous rutile...52
Figure 2.19 Ternary diagram showing variation in U, Si, and 10 times Ca (mole%) between sandstone-hosted Urn1, Urn2, Urn3, and basement-hosted uraninite and
uraniferous rutile...53
Figure 2.20 Ternary diagram showing variation in U, Pb, and 100 times Th (mol%) between sandstone-hosted Urn1, Urn2, Urn3, and basement-hosted uraninite and
Uraniferous rutile...53
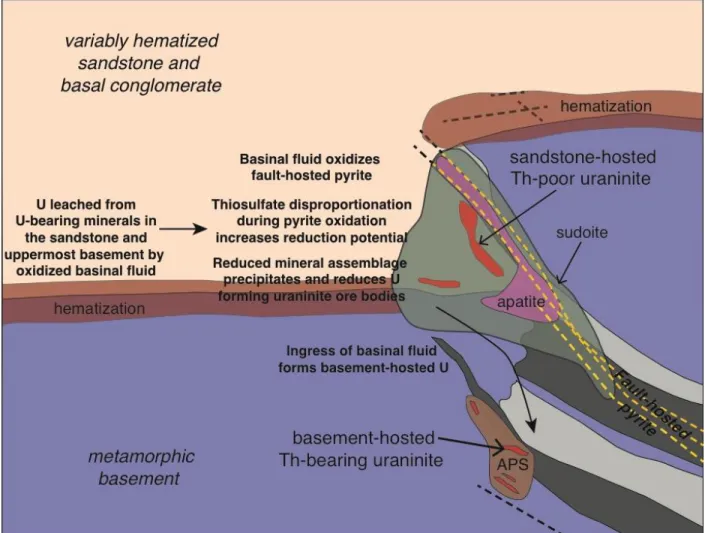
Figure 2.21 Schematic of the proposed genetic model for uraninite mineralization at McArthur River...64
Figure 3.1 Geologic map of the McArthur River uranium deposit showing general basement rock types, faults, mineralized zones, and the location of drill holes logged and sampled...71
Figure 3.2 Paragenetic sequence of alteration minerals at McArthur River U deposit...75
Figure 3.3 Petrography of sulfur-bearing minerals at McArthur River...76
Figure 3.4 Plot of 34S ‰ values for fault-hosted Py
1 and minerals from the reduced mineral
assemblage at McArthur River uranium mine...78
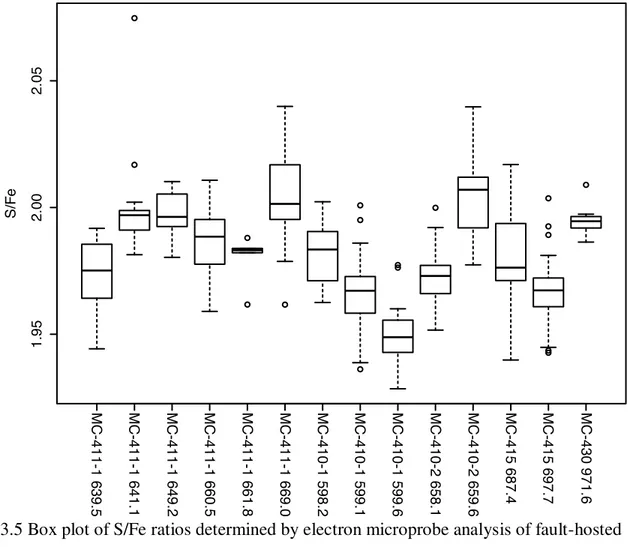
Figure 3.5 Box plot of S/Fe ratios determined by electron microprobe analysis of fault-
hosted pyrite...79
Figure 4.1 Geologic map of the Athabasca Basin with locations of terranes, major structures, and uranium deposits...89
Figure 4.2 Map of basement geology at the unconformity, and cross-sections showing the locations of the drill cores logged...94
Figure 4.3 Core logs for REA-165-3, REA-165, REA-165-1, and a perched U occurrence in
REA-165...98
Figure 4.4 Drill core from REA-165-1 showing increasing sudoitization and quartz corrosion approaching the unconformity-related ore zone...109
Figure 4.5 Photomicrographs of pre- and syn-ore alteration of rocks near the unconformity..111
Figure 4.6 BSE images of pre- and syn-ore alteration of rocks near the unconformity...113
Figure 4.7 Paragenesis for alteration minerals associated with the unconformity-related ore body...114
Figure 4.8 Perched uranium occurrence from drill core REA-165...114
Figure 4.9 Photomicrographs of quartz sandstone associated with perched uranium...116
Figure 4.10 BSE images of perched U samples...118
Figure 4.11 Paragenesis of alteration minerals associated with perched uranium...120
Figure 4.12 Chlorite breccia samples in drill core...121
Figure 4.13 Photomicrographs of two styles of chlorite breccia...123
Figure 4.14 BSE images of chlorite breccia samples...124
Figure 4.15 Paragenesis of chlorite breccia immediately below the unconformity...125
Figure 4.16 Intervals from the C-10 fault zone and the C-10 alteration zone showing the increasing intensity of bleaching proceeding downwards from the fault...127
Figure 4.17 Photomicrographs of samples from the C-10 alteration zone...128
Figure 4.18 BSE images of samples from the C-10 alteration zone...130
Figure 4.20 Octahedral site occupancy of Mg, Fe, and Al + vacancy for chlorite minerals in the different lithologies at Fox Lake...132
Figure 4.21 Ternary diagram showing variations in Fe, S, and Cu (wt. %) for pyrite and chalcopyrite in the ore zone at the unconformity and in chlorite breccia
immediately below the unconformity...134
Figure 4.22 Ternary diagram showing variations in Fe, S, and Cu (wt. %) for sulfide minerals in the C-10 fault zone, C-10 alteration zone, and in unaltered quartz-biotite-
garnet gneiss below the C-10 alteration zone...135
Figure 4.23 Ternary diagram showing variations in Fe, Ni and Co (wt. %) for sulfide
minerals as a function of depth in the C-10 alteration zone. Metamorphic pyrite from unaltered quartz-biotite-garnet gneiss shown for comparison...136
Figure 4.24 Ternary diagram showing variations in Fe, S, and Cu (wt. %) for sulfide minerals associated with perched uranium...136
Figure 4.25 Ternary diagram of U-Si-Ca concentrations (wt. %) in unconformity-hosted uraninite and zircon-coffinite-xenotime-thorite replacement of zircon associated with the perched uranium occurrence...139
Figure 4.26 Dodecahedral site occupancy ternary diagram for zircon and the U-altered zircon that constitutes the perched uranium occurrence...142
Figure 4.27 Plots showing cations involved in the P substitution reactions for U-altered zircon...142
Figure 4.28 Electron microprobe analysis spot locations for zircon and uranium-altered zircon...148
Figure 4.29 High-resolution BSE images of unaltered zircon in contact with uranium-altered zircon...149
Figure 4.30 Schematic cross-section depicting proposed genetic model for the Fox Lake
uranium deposit...155
Figure 5.1 Map of basement geology at the unconformity, and cross-section showing the locations of the drill cores logged and sampled for this study...163
Figure 5.2 BSE images of key sulfide and sulfarsenide minerals associated with the unconformity-hosted ore bodies, chlorite breccia, and C-10 alteration zone...167
Figure 5.3 Paragenesis of alteration minerals for the unconformity-related ore body, the
chlorite breccia, and the C-10 alteration zone...169
Figure 5.4 Ternary diagram showing variation in iron, nickel, and cobalt content of sulfide minerals in the C-10 alteration zone as a function of depth below the unconformity...170
Figure 5.5 Ternary diagram showing variation in iron, sulfur, and copper content of sulfide minerals in the C-10 alteration zone as a function of depth below the unconformity...171
Figure 5.6 Plot of 34S ‰ values for sulfide and sulfarsenide minerals at the Fox Lake
LIST OF TABLES
Table 2.1 Bulk compositional data in ppm for selected elements from MC-410-1...18
Table 2.2 Bulk compositional data in ppm for selected elements from MC-410-2...20
Table 2.3. Bulk compositional data in ppm for selected elements from MC-415...21
Table 2.4. MC-411-1 660.5 chlorite EMP analyses...45
Table 2.5. Representative EMP analyses for fault-hosted and euhedral pyrite...49
Table 2.6. Representative EMP analyses for marcasite...50
Table 2.7. Representative EMP analyses for chalcopyrite...51
Table 2.8. Representative EMP analyses for euhedral cobaltite-gersdorffite in sample MC-408 617.2...52
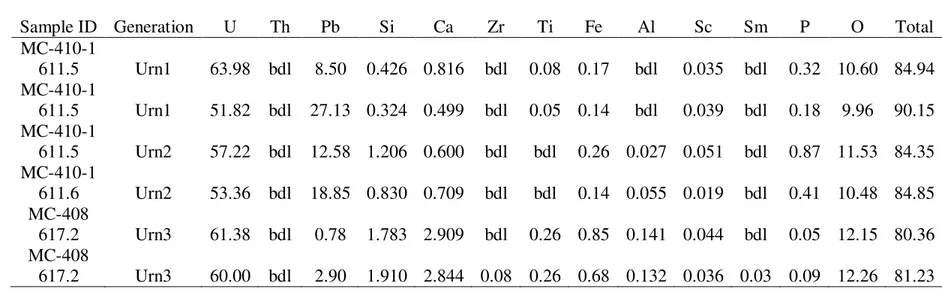
Table 2.9. Representative EMP analyses for sandstone-hosted uraninite...54
Table 2.10. Representative EMP analyses for basement-hosted uraninite and uraniferous rutile...54
Table 4.1. Bulk compositional data in ppm for selected elements from REA-165-3...102
Table 4.2. Bulk compositional data in ppm for selected elements from REA-165...105
Table 4.3. Bulk compositional data in ppm for selected elements from REA-165-1...107
Table 4.4. Representative compositions for chlorite minerals at Fox Lake...133
Table 4.5. Representative compositions in wt.% for sulfide minerals from the unconformity-related ore zone and underlying chlorite breccia...137
the C-10 alteration zone...137
Table 4.7. Representative compositions in wt.% for sulfide minerals associated with perched uranium...138
Table 4.8. Analyses for unconformity-hosted U mineralization...143
Table 4.9. Analyses for zircon associated with perched U mineralization...145
Table 4.10. Site occupancy of major cations in zircon based on four O...145
Table 4.11. Analyses for U-altered zircon...146
Table 4.12. Site occupancy of major cations in U-altered zircon based on four O...147
ACKNOWLEDGEMENTS
I would like to thank my advisor Thomas Monecke for his comments, guidance, and support during this research. I would also like to extend my sincere gratitude to the rest of my committee. I am indebted to Katharina Pfaff for her advice and help during the scanning electron microscopy investigations, which helped me to refine the mineral parageneses developed for this study. Richard Wendlandt assisted with petrographic investigations and helped me to learn the subtleties of mineral chemistry. Murray Hitzman introduced me to the fundamentals of ore genesis, upon which this thesis drew heavily. Discussions with Josh Sharp on bacterially mediated sulfate and uranium reduction were helpful in interpreting sulfur isotope data and uranium ore precipitation.
Julien Allaz, formerly at the Department of Geological Sciences at CU Boulder, aided in electron microprobe analysis of the chlorite group minerals. Transmission electron microscope analyses of chlorite group minerals performed by Giovanna Giorgetti of the Università di Siena was crucial for confirming chlorite compositions determined with electron microprobe analysis. Heather Lowers and Dave Adams of the U.S. Geological Survey assisted with electron
microprobe analysis of sulfide and uranium minerals. Mike Pribil of the U.S. Geological Survey was instrumental in LA-ICP-MS analyses of sulfur isotopes in sulfide minerals. Discussions with Martin Goldhaber of the U.S. Geological Survey helped elucidate the geochemical significance of the sulfur isotope fractionation observed in sudoite-altered pyrite. I thank Reinhard Kleeberg of the TU Bergakademie Freiberg for performing the X-ray diffraction measurements. The staff of the Saskatchewan Research Council was critical for the preparation of radioactive thin sections and bulk compositional analysis. The staff of Spectrum Petrographics and Jae Erickson of Colorado School of Mines prepared the remainder of the thin sections upon which this research depended.
This research would not have been possible without the support of Cameco Corporation. The initial project idea was devised by Gerard Zaluski and Tom Kotzer. Both also were
unconformity-related uranium deposits were invaluable and I thank them for guiding this
research over the past years. Scott Rogers, Gary Witt, and Marie Barker of Cameco Corporation are acknowledged for their support with access to drill core, sample collection, and field
logistics.
The research was financially supported by Cameco Corporation. I also benefited from a teaching assistantship provided by Colorado School of Mines. Research grants from the Society of Economic Geologists and the Geological Society of America funded sulfur isotope
investigations and chlorite microanalysis, respectively.
I would like to thank my fellow graduate students at Colorado School of Mines for their insight and suggestions. My parents deserve a special thanks for encouraging me to pursue art, science, and my various interests well outside of the box of normality. Last but not least I would like to thank my daughter Millicent for inspiring me to use my talents to make her future a better one.
CHAPTER 1 INTRODUCTION
Unconformity-related uranium deposits constitute the largest high-grade uranium deposits in the world. All known deposits occur in the Athabasca Basin in Canada, and the Kombolgie Basin in Australia, and are Proterozoic in age. Unconformity-related uranium deposits are located at the unconformity between basinal sandstone and faulted metamorphic basement rock, and comprise fault controlled basement- and sandstone-hosted uranium ore bodies.
Traditional genetic models for unconformity-related uranium deposits are based on the water solubility of oxidized U6+ and the insolubility of reduced U4+. Uranium is leached from U-bearing minerals in basinal sedimentary rocks or from basement rocks by oxidizing meteoric basinal fluids. The uraniferous basinal fluid flows along the unconformity, which provides enhanced permeability, and interacts with a reductant, precipitating uraninite (UO2) from
solution and forming an ore body (Hoeve and Sibbald, 1978). The nature of the reductant is unknown (Mercadier et al., 2010; Adlakha and Hattori, 2015), with hypotheses invoking reducing basement rock (Hoeve and Sibbald, 1978) or basement-derived reducing fluids rising along faults in the basement (Wilson and Kyser, 1987).
Unconformity-related uranium ore bodies in the Athabasca Basin are classified as either simple or complex based on their mineralogy (Fayek and Kyser, 1997; Kyser and Cuney, 2009). Simple ore bodies are generally located greater than 50 m below the unconformity in the
basement, and consist of relatively pure uraninite, whereas complex ore bodies are sandstone-hosted and contain sulfide and Co-Ni sulfarsenide minerals in addition to uraninite.
Dravite, sudoite, and illite alteration occur in a 20 km wide and 100 km long band in the eastern Athabasca Basin encompassing several unconformity-related uranium deposits including McArthur River and Fox Lake. Dravite, sudoite, and illite alteration has been used as a vector for
exploration of new deposits, however this alteration is also present in U barren areas, indicating that its use as a vector may be of limited value (Kyser and Cuney, 2009).
The study presented in this thesis is a comparison of two deposits in the eastern Athabasca Basin, McArthur River and Fox Lake. McArthur River is the largest high-grade uranium deposit in the world with proven and probable reserves of 1.7 million tons with an average grade of 9.63 % U3O8 equivalent (Cameco, 2017), and accounted for 12% of global
uranium production in 2015. McArthur River has sandstone and basement-hosted ore bodies both of the simple type, associated with the P2 reverse fault. Fox Lake is located 10 km west of McArthur River. This deposit has an inferred resource of 386,700 tons with an average grade of 7.99% U3O8 equivalent (Cameco, 2015). The ore at Fox Lake is of the complex type, with the
primary ore bodies located in sandstone immediately above the intersection between the unconformity and the C-10 strike slip fault. Fox Lake also has perched uranium lenses greater than 100 m above the unconformity.
The investigations presented herein comprise logging of drill core, macroscopic descriptions of primary and alteration mineralogy, sampling of drill core, bulk rock compositional analyses, development of a new paragenesis based on optical and scanning electron microscopy, electron microprobe analyses of chlorite, sulfide, and uranium minerals, and sulfur isotope analysis of sulfide minerals. Compositional and isotopic data in combination with the paragenesis of alteration minerals led to the development of a new genetic model for McArthur River and Fox Lake, and perhaps generally for all unconformity-related uranium deposits. The research shows that pre-ore pyrite was oxidized and replaced by Fe-sudoite. The petrographic and sulfur isotope data suggest that the oxidation of pre-ore pyrite by thiosulfate disproportionation resulted in the reduction of basinal fluids, facilitating the precipitation of a reduced mineral assemblage including uraninite. The reaction of oxidized basinal fluids with metamorphic basement rocks and pre-ore pyrite accounts for the formation of the alteration mineralogy and uraninite ore bodies at McArthur River and Fox Lake. In addition to dravite and sudoite alteration, the presence of pyrite associated with faulted basement rocks should be a vector for the exploration of unconformity-related uranium deposits.
This thesis is organized into six chapters. This chapter provides a short introduction to the thesis topic. Chapter two presents the research into the alteration mineralogy and paragenesis at McArthur River, and introduces the genetic model for ore formation at this deposit. Chapter three presents the sulfur isotope investigations on sulfide minerals from McArthur River used to support the genetic model proposed in the previous chapter. Chapter four focuses on the Fox Lake deposit, presenting the research on alteration mineralogy and parageneses for the distinct lithologies encountered there; as well as a comparison of the alteration mineralogy, parageneses, and genetic models for McArthur River and Fox Lake. Chapter five presents the sulfur isotope investigations on sulfide and sulfarsenide minerals from Fox Lake, and are used to support the general genetic model for Fox Lake and McArthur River. Chapter six summarizes the
conclusions of the current research on McArthur River and Fox Lake, emphasizing the potential applicability of the proposed genetic model to all unconformity-related uranium deposits, and proposes refinements to exploration methods for these deposits.
The corresponding author for all chapters is John DeDecker of the Center for Mineral Resource Science, Department of Geology and Geological Engineering, Colorado School of Mines, E-mail address: jdedecke@mymail.mines.edu. Co-authors for this thesis are: Thomas Monecke of the Center for Mineral Resource Science, Department of Geology and Geological Engineering, Colorado School of Mines; and Michael Pribil of the U.S. Geological Survey in Denver, Colorado.
1.1 References
Adlakha, E., and Hattori, K., 2015, Compositional variation and timing of aluminum phosphate-sulfate minerals in the basement rocks along the P2 fault and in association with the McArthur River uranium deposit, Athabasca Basin, Saskatchewan Canada: American Mineralogist, v. 100, p. 1386-1399.
Cameco Corporation, 2015, Mineral reserves and resources
(https://www.cameco.com/annual_report/2015/mda/mineral-reserves-and-resources/mineral-resources/)
Cameco Corporation, 2017, Mineral reserves and resources
(https://www.cameco.com/businesses/uranium-operations/canada/mcarthur-river-key-lake/reserves-and-resources)
Fayek, M., and Kyser, T.K., 1997, Characterization of multiple fluid flow events and rare-earth-element mobility associated with formation of unconformity-type uranium deposits in the Athabasca Basin, Saskatchewan: Canadian Mineralogist, v. 35, p. 627-658.
Hoeve, J., and Sibbald, T.I.I., 1978, On the genesis of Rabbit Lake and other unconformity-type uranium deposits in northern Saskatchewan, Canada: Economic Geology, v. 73, p. 1450-1473. Kyser, K., and Cuney, M., 2009, Recent and not-so-recent developments in uranium deposits and implications for exploration: Mineralogical Association of Canada Short Course Series, v. 39, p. 161-219.
Mercadier, J., Cuney, M., Cathelineau, M., and Lacorde, M., 2010, U redox fronts and
kaolinization in basement-hosted unconformity-related U ores of the Athabasca Basin (Canada): late U remobilization by meteoric fluids: Mineralium Deposita, v. 46, p. 105-135.
Wilson, M.R., and Kyser, K., 1987, Stable isotope geochemistry of alteration associated with the Key Lake uranium deposit, Canada: Economic Geology, v. 82, p. 1540-1557.
CHAPTER 2
ALTERATION ASSOCIATED WITH BASEMENT FAULTS IN UNCONFORMITY-RELATED URANIUM DEPOSITS: CASE STUDY AT THE
MCARTHUR RIVER MINE, ATHABASCA BASIN
A paper to be submitted to Economic Geology John DeDecker, and Thomas Monecke Abstract
The McArthur River uranium mine in the Athabasca Basin, Canada, hosts the largest high-grade uranium deposit in the world, accounting for 12% of global uranium production in 2015. McArthur River is a Proterozoic unconformity-related uranium deposit, with ore bodies located in the P2 fault zone at the unconformity between
conglomerate and metamorphic basement rock, and up to 120 m below the unconformity in basement rock.
Core logging and sample collection were followed by petrographic analysis and scanning electron microscopy to establish the paragenesis and alteration styles in altered basement rocks. Scanning electron microscopy, electron microprobe analysis, and X-ray diffraction investigations revealed the presence of di-trioctahedral sudoite in
metamorphic basement samples from the P2 fault zone near the unconformity.
Here, a new model for the reduction of uranium at McArthur River is proposed. The observations indicate that the P2 reverse fault is characterized by the abundant presence of fault-hosted pre-ore pyrite veins. The formation of these veins resulted in the illitization of feldspar in the basement rocks. Oxidizing, high-salinity Na-Mg-Ca chloride basinal fluids, forming abundant secondary fluid inclusions, penetrated into the basement along the P2 fault and oxidized the pre-ore pyrite veins, resulting in the reduction of the fluids. Pyrite veins and illite were replaced by Fe3+-bearing sudoite and fluorapatite.
Barite and aluminum-phosphate-sulfate (APS) minerals incorporated a portion of the SO42- generated during pyrite oxidation. It is hypothesized that the reduction of the
basinal brine by the pre-ore pyrite was responsible for the reduction of UO22+ and the
formation of the world-class McArthur River unconformity-related deposit. Introduction
The McArthur River uranium mine in the Athabasca Basin, Canada, hosts the largest high-grade uranium deposit in the world. McArthur River is an unconformity-related uranium deposit, with ore bodies located in the P2 fault zone at the unconformity between conglomerate and metamorphic basement rock, and up to 120 m below the unconformity in basement rock. McArthur River has proven and probable reserves of 1.7 million tons with an average grade of 9.63 % U3O8 equivalent (Cameco, 2017).
Genetic models for unconformity-related uranium deposits are based on the water solubility of the oxidized uranyl ion (UO22+) and insolubility of reduced UO2. Uranium
is leached from U-bearing minerals in basinal sedimentary rocks or from basement rocks by oxidizing meteoric basinal fluids. The uraniferous water flows through rocks at the unconformity and interacts with a reductant, precipitating uraninite (UO2) from solution
and forming an ore body (Hoeve and Sibbald, 1978). The nature of the reductant is unknown (Mercadier et al., 2010; Adlakha and Hattori, 2015), with hypotheses invoking reducing basement rock (Hoeve and Sibbald, 1978) or basement-derived reducing fluids (Wilson and Kyser, 1987).
Previous research conducted at McArthur River (Emberley, 2014) suggested that the P2 fault zone is enriched with pyrite relative to competent rock outside the fault zone. As reduced minerals such as pyrite can constrain redox conditions before, during, and after uranium ore precipitation (Ingham et al., 2014), a research project was initiated to constrain the possible role of pyrite in the formation of the McArthur River deposit. This study included extensive drill core logging to study pyrite abundance and hydrothermal alteration within the P2 fault zone along strike from and down dip of the high-grade uranium ore bodies. In addition to core logging, systematic sampling was performed. Bulk major and trace element geochemical and XRD analyses were performed to complement core logging. Thin sections were studied by optical and scanning electron microscopy to establish the paragenesis. The present study summarizes key findings
made constraining the paragenesis and alteration mineralogy of the basement rocks. The research shows that the large amount of pyrite occurring along the P2 fault formed prior to mineralization, and was subsequently oxidized and replaced by Fe-sudoite. The petrographic evidence suggests that this reaction with pre-ore pyrite resulted in the reduction of basinal fluids, facilitating the precipitation of a reduced mineral assemblage including uraninite. It is proposed here that this process is ultimately responsible for deposit formation. Implications to exploration are briefly discussed.
2.1 Geological Background 2.1.1 Athabasca Basin
The Athabasca Basin is located in northern Saskatchewan, Canada (Fig. 2.1). The basin is Paleoproterozoic in age, with an age of ca. 1750-1680 Ma, coeval with the post-orogenic uplift of the ca. 1800 Ma Trans-Hudson orogen to the east (Annesley et al., 2005). The 1900 Ma Talston orogen is located to the northwest of the Athabasca Basin. The basin is divided into three sub-basins that trend NE-SW and overlie the suture between the Hearn and Rae tectonic provinces. The highest-grade uranium deposits, including McArthur River, are located at the transition between the Mudjatik and Wollaston Domains of the Hearne tectonic province (Kyser and Cuney, 2009).
Estimates of basin depth during late diagenesis and pre-ore alteration have been obtained by fluid inclusion analysis of euhedral quartz veins and overgrowths in
sandstone near the unconformity by Pagel et al. (1980) and Derome et al. (2005). Pagel et al. (1980) reported a minimum pressure of entrapment of ~700 bars at 160° C obtained using the homogenization temperature and the temperature of dissolution of halite for liquid+vapor+halite fluid inclusions. Derome et al. (2005) utilized homogenization temperature data and estimates of likely thermal gradients to derive a range of entrapment temperatures and pressures between 190-235°C and 1200-1400 bars. Assuming the sedimentary overburden has a density of 2.5 g/cm3, the pressure estimates of Derome et
Derome et al. (2005) performed investigations on the compositions of fluid inclusions in quartz overgrowths on detrital quartz and euhedral quartz veins. They identified an early NaCl-rich fluid, interpreted as a primary formation fluid derived from evaporite beds; and a later Ca-MgCl2-rich fluid produced by interaction of the NaCl-rich
fluid with basement rock.
Fig.2.1 Geologic map of the Athabasca Basin with locations of terranes, major structures, and uranium deposits (after Slimmon and Pana, 2010). MF=Manitou Falls Formation, LZ=Lazenby Lake Formation, W=Wolverine Point Formation, LL=Locker Lake Formation, O=Otherside Formation, and FP=Fairpoint Formation.
2.1.2 Sedimentary Host Rocks
The Athabasca Basin is filled with sedimentary rocks of the Athabasca Group (Hiatt and Kyser, 2007). The Manitou Falls Formation comprises the lowermost portion of the Athabasca Group, and is the only formation in the Athabasca Group that occurs at McArthur River in present times. The Manitou Falls Formation is composed of a basal quartz-pebble to quartz-cobble conglomerate, overlain by mature quartz sandstone with sparse thin beds of quartz pebbles. The source rocks of the lower Manitou Falls
Formation are believed to be paleo-topographic highs composed of pegmatite-bearing basement gneiss, represented by basal conglomerate rocks, and successively more distal
granitoid rocks derived from the east represented by mature quartz sandstone. Formation of the Athabasca Basin occurred ca. 1750-1680 Ma (Annesley et al., 2005).
The basal conglomerate of the Manitou Falls Formation is variably hematized, indicating that oxidizing fluids once flowed through the permeable lowermost part of the basin fill. Detrital zircon, monazite, and fluorapatite are common within quartz grains, but are rarely found in interstices between quartz grains, suggesting dissolution of these uranium-bearing minerals by basinal fluids. Dissolution of these U-bearing minerals by oxidizing basinal brines is considered the most likely source for uranium in
unconformity-related deposits (Fayek and Kyser, 1997; Kyser and Cuney, 2009).
2.1.3 Basement Rocks
The Wollaston Domain is a fold thrust belt fault bounded to the west by the Mudjatik Domain (Annesley et al., 2005; Alexandre et al., 2009; Mercadier et al., 2010). The largest uranium deposits in the Athabasca Basin occur at the transition between these domains. The Wollaston Domain comprises amphibolite to lower granulite facies pelitic and almandine-bearing calcsilicate gneisses, anatectic pegmatite, and quartzite that reached peak metamorphism P-T conditions of approximately 800 °C and 800 MPa ca. 1800-1840 Ma during the Trans-Hudson Orogeny. Unroofing of the basement initiated ca. 1814 Ma, and reached 500-550°C and 200-250 MPa ca. 1720 Ma (Annesley et al., 2005; Mercadier et al., 2010). The pelitic rocks contain weakly to strongly graphitic units that serve as the primary host for ore-related faults. Wollaston Domain metasedimentary rocks are unconformably underlain by Archean granitoid gneiss.
The contact between metamorphic basement rock and the unconformably overlying sedimentary rocks of the Manitou Falls Formation is characterized by a
strongly hematized, chloritized, and argillized basement rock. Adlakha et al. (2014) noted bleached rocks proximal to the unconformity, as lenses in the Manitou Falls Formation, and up to 120 m below the unconformity near basement-hosted ore bodies. Bleached rocks have high abundances of dickite and illite replacing feldspar and biotite, and are associated with an outer zone of hematite, and an inner zone of chlorite at the
unconformity and in the basement. MacDonald (1980; 1985) suggests a diagenetic reducing fluid was responsible for bleaching proximal to the unconformity, as bleaching overprints hematite.
2.1.4 P2 Fault Zone
Uranium ore bodies at McArthur River are hosted by the P2 fault. The P2 fault is a 13 km long listric reverse fault with up to 80 m of offset at the unconformity between the base of the Manitou Falls Formation and metamorphic basement rocks (Adlakha et al., 2014). The fault strikes ~050°and is hosted by graphitic metapelitic rocks in the basement. Above the unconformity the P2 fault splays into several faults that become sub-parallel to bedding. Hydrothermal alteration of basement and sedimentary rocks is structurally controlled by the P2 fault, and is characterized by Mg-Al chlorite, illite, magnesiofoitite, and hematite in the basement; and quartz, dickite, illite, and chlorite in the Manitou Falls Formation. The association of intense hydrothermal alteration with the P2 fault is evidence that the P2 repeatedly served as a conduit for basinal and
hydrothermal fluids. Metapelites in the P2 fault zone host elevated pyrite abundances with respect to rocks outside the P2 fault zone (Emberley, 2014). Carbon isotope
investigations of graphite and hydrocarbon buttons (amorphous hydrocarbon nodules) at the Key Lake uranium deposit by Kyser et al. (1989) show no significant isotopic
fractionation, leading to the contention that graphite did not play a major role is reduction of uranium, but rather served as a structural control on the location of faults that focused fluid flow.
2.1.5 Uranium Ore Bodies
Unconformity-related uranium ore bodies in the Athabasca Basin are classified as either simple or complex based on their mineralogy (Fayek and Kyser, 1997; Kyser and Cuney, 2009). Simple ore bodies consist of relatively pure uraninite and are generally basement-hosted, whereas complex ore bodies contain abundant sulfide and Co-Ni sulfarsenide minerals in addition to uraninite and are generally sandstone-hosted. At McArthur River both basement- and sandstone-hosted ore bodies are of the simple-type.
The location of the McArthur River deposit is controlled by the intersection of the P2 fault in the metamorphic basement rocks with the overlying sub-Athabasca
unconformity. Ore is found in two settings. Nose or wedge ore (zones 1,3,4, A, and B; Fig. 2) is replacement uraninite in the Athabasca sandstone along the unconformity at the tip of the post-Athabasca reactivated P2 reverse fault wedge. Alteration associated with the sandstone-hosted ore zones is characterized by an inner chlorite zone and an outer illite + chlorite zone with silicification of sandstone over quartzite ridges in the basement. Basement ore of zone 2 is massive uraninite in the P2 fault and immediate footwall, as deep as 120 m below the unconformity. Basement alteration surrounding this zone consists of an outer chlorite zone and inner illite ± chlorite + dravite + hematite zone (Kyser and Cuney, 2009).
2.1.6 Paragenesis
Previous workers have developed paragenetic sequences for uranium deposits in the Athabasca Group and basement rocks for the Athabasca Basin (Kotzer and Kyser, 1995; Fayek and Kyser, 1997; Alexandre et al., 2009; Kyser and Cuney, 2009; Ng et al., 2013), and for McArthur River specifically (Derome et al., 2005). Alteration events common to previous parageneses include: 1) late diagenetic quartz overgrowths with hematite on detrital quartz clasts; 2) pre-ore hydrothermal alteration dominated by illitization of feldspar beginning ca. 1670 Ma; 3) primary uraninite ore formation ca. 1588 ± 15 Ma, accompanied by sulfide and Co-Ni sulfarsenide minerals; and 4) post-ore alteration events typified by carbonate and sulfide minerals, and low-temperature
remobilization and subsequent precipitation of uraninite.
Fayek and Kyser (1997) recognized three stages of uraninite precipitation in the Athabasca Basin. Stage-one is characterized by euhedral uraninite with high reflectivity, association with Ni-Cu arsenide minerals, PbO contents of 13.47-25.32 wt%, <3 wt% SiO2 and CaO, and < 1.5 wt% FeO. Stage-two consists of massive uraninite, with a lower
reflectivity than stage one uraninite. It is associated with Ni-Cu arsenide and Ni-Co sulfarsenide minerals; and contains 6.45-11.98 wt% PbO, 1-3 wt% SiO2 and CaO, and ~1
associated with Cu-Fe sulfide minerals, and contains 0.67-5.54 wt% PbO and variable concentrations of SiO2 CaO, and FeO. U-Pb ages in uraninite and 40Ar/39Ar ages of clay
minerals related to hydrothermal alteration correspond to ages of far field tectonic events; suggesting that fluid flow and mobilization of uranium in the Athabasca Basin may have been linked to far field stresses (Alexandre et al., 2009; Kyser and Cuney, 2009, Li et al., 2017).
2.2 Materials and Methods 2.2.1 Fieldwork
Fieldwork performed at McArthur River between June 13 and July 3, 2015 focused on drill core logging and the collection of representative samples for laboratory research. Drill holes were selected for core logging and sampling to ensure coverage of the P2 fault along strike and dip, high-grade ore bodies and uranium anomalies within the P2 fault zone, altered rock surrounding ore bodies, unaltered basement rock, and
uranium-barren zones along the P2 fault (Fig. 2.2). Drill holes 408, 411, MC-411-1, and MC-430 were logged over an interval ± 24 m from the middle of the P2 fault zone. Drill holes MC-410-1, MC-410-2, and MC-415 were logged from the unconformity to the bottom of the hole.
Core logging consisted of identifying major minerals, describing rock type and fabric, noting alteration styles and relative intensity, measuring depths of fault zones, and estimating pyrite abundance. Pyrite abundances were visually estimated using ~5 cm intervals and an abundance scale (0%, trace, 1-5%, 5-10%, 10-15%, 15-20%, and >20% pyrite).
Representative samples of unaltered basement rock and hematite, chlorite, dravite, and clay altered basement rock were collected. Emphasis was placed on selecting fresh, altered, and pyrite-bearing samples for petrographic, XRD, and trace element
investigations. Select samples of basement- and sandstone-hosted uraninite were
collected as well. All samples were labelled using the drill hole identification and depth interval of the sample.
Fig. 2.2 Geologic map of the McArthur River uranium deposit showing general basement rock types, faults, mineralized zones, and the location of drill holes logged and sampled. The P2 fault dips to the southeast and is hosted in graphitic rocks. Cross sections are viewed from the southwest looking towards the northeast. The P2 fault zone hosts hydrothermal alteration, pyrite enrichment, and uranium ore bodies. Cross sections prepared using data provided by Cameco.
2.2.2 Bulk Compositional Analysis
Cameco provided existing geochemical analyses to supplement new data. Fifty-eight major and trace elements were analyzed. SRC Geoanalytical Laboratories
performed the bulk compositional analyses.
Major and trace element concentrations in basement and sandstone samples were determined by inductively coupled plasma-mass spectrometry (ICP-MS). Partial
digestion of an aliquot of pulped sample in an ultra-pure mixture of nitric and
hydrochloric acids in a hot water bath, followed by dilution in deionized water, was used for the analysis of As, Ge, Hg, Sb, Se, and Te. Total digestion of an aliquot of pulped sample in a concentrated mixture of ultra-pure hydrofluoric, nitric, and perchloric acids was used for ICP-MS on the remainder of the elements analyzed.
Carbon and sulfur concentrations were determined by combusting an aliquot of pulped sample in a LECO induction furnace with an oxygen supply. The percentage of carbon and sulfur were determined from the instrument calibration. Inorganic carbon content was determined by combustion of an aliquot of pulped sample in a LECO induction furnace with an argon supply. Organic carbon content was determined by subtracting the inorganic carbon content form the total carbon content.
Boron concentrations were determined by fusing an aliquot of pulped sample in a mixture of NaO2 and NaCO3, dissolving the fused melt in deionized water, and analyzing
the sample solution by ICP-OES.
2.2.3 Optical Petrography and Scanning Electron Microscopy
Sixty-five polished thin sections of core samples were prepared for petrographic and microanalytical analysis. The samples examined represent high-grade ore, sandstone proximal to the ore bodies, and basement rocks within and surrounding the P2 fault zone. Reflected and transmitted light petrography was used to identify and describe sulfide mineral morphologies, identify optically discernible zonation in sulfide minerals, select
regions of interest for further microanalytical studies, and to establish the mineral paragenesis.
Back-scattered electron imaging and energy dispersive X-ray spectroscopy (EDXS) were performed on a Tescan MIRA3 field emission scanning electron microscope with a Bruker XFlash 6130 energy dispersive X-ray spectrometer. BSE imaging and X-ray spectroscopy were performed with an accelerating voltage of 15 kV, a beam diameter of 5.0 nm, and a working distance of 10.0 mm.
BSE imaging was used to identify compositional variations between different types of sulfide and uranium minerals, and compositional zonation within pyrite grains and veins. These data were used to refine optically determined paragenetic relationships, and to select samples for electron microprobe analysis. Mineral abbreviations used in petrography figures and the paragenesis are from Whitney and Evans (2010).
2.2.4 Cathodoluminescence Investigations
Optical cathodoluminescence (CL) imaging was performed on samples containing hydrothermal fluorapatite, hydrothermal quartz, and K-feldspar to identify CL-active compositional zonation in quartz and fluorapatite, and feldspar alteration.
A HC5-LM hot cathode CL microscope by Lumic Special Microscopes,
Germany, was used, permitting examination of thin sections under electron bombardment in a modified Olympus BXFM-S optical microscope. The microscope was operated at an accelerating voltage of 14 kV with a current density of ~10 µA mm-2 (Neuser, 1995). CL
images were captured using a high sensitivity, double-stage Peltier cooled Kappa DX40C CCD camera, acquisition times ranged from 8 to 10 seconds.
2.2.5 Electron Microprobe Analysis
Quantitative chlorite compositions were acquired with a JXA-8230 Electron Probe Microanalyzer, using a 2 µm spot size, 15 kV accelerating voltage, and a beam current of 10 nA. Spots were chosen to avoid cracks, porosity, and compositional
heterogeneities ~2 times the size of the interaction volume. Compositions were acquired for chlorites associated with pre- to syn-ore alteration. K𝛼 X-ray lines were measured for Si, Al, Mg, Fe, K, Ti, V, Cr, Mn, Zn, F, and Cl. The following Astimex Minerals
standards were used: Albite (Si), labradorite (Al), diopside (Mg), almandine NY (Fe), orthoclase (K), rutile (Ti), chromite (Cr), rhodonite (Mn), sphalerite (Zn), topaz (F), and tugtupite (Cl). An Astimex metals standard was used for V. Matrix corrections were calculated using the CalcZAF software.
Quantitative sulfide and sulfarsenide mineral compositions were acquired with a JEOL 8900 electron probe microanalyzer, using a 1 µm spot size, 20 kV accelerating voltage, and a beam current of 20 nA. K𝛼 X-ray lines were measured for Fe, Cu, Ni, Co, and S. L𝛼 lines were measured for As and Mo. The following USGS Denver Microbeam Laboratory standards were used: Fe STD_NUM_426, Cu STD_NUM_429, Ni
STD_NUM_428, Co STD_NUM_427, S STD_NUM_417, As STD_NUM_434, and Mo STD_NUM_443. Spot locations were chosen to acquire representative analyses from the cores to edges of fault-hosted pyrite veins, euhedral pyrite, marcasite, chalcopyrite, and cobaltite-gersdorffite. Matrix corrections were calculated using the CalcZAF software.
Uraninite analyses were acquired with the same instrument and conditions as sulfide and sulfarsenide minerals except the beam current was 50 nA. K𝛼 lines were measured for Si, Ti, Al, V, Cr, Sc, Fe, Co, Ca, P, and S. L𝛼 lines were measured for Zr, Hf, Y, Sm, Er, and Ba. M𝛼 lines were measured for U, Pb, Th, and W.
2.3 Results
2.3.1 Core Logging and Whole-Rock Geochemical Composition
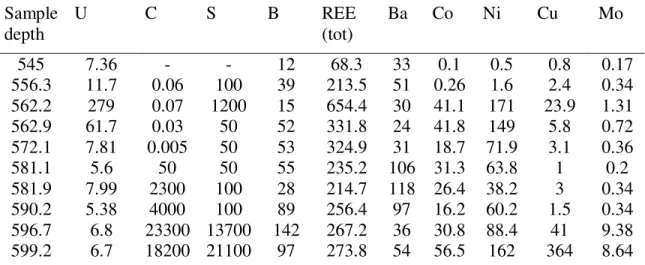
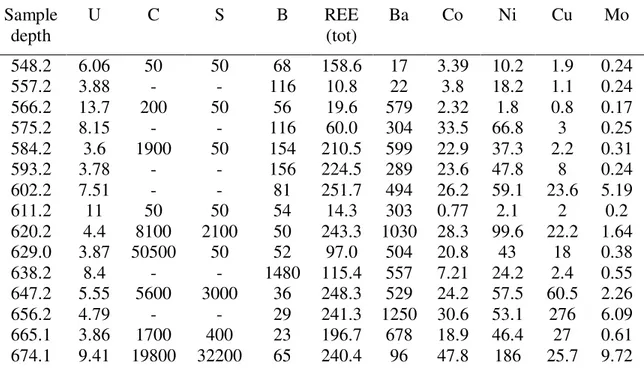
Graphic core logs were compiled for every hole examined and include rock type, mineralogy, alteration style and relative intensity, relative intensity of bleaching, and pyrite abundance. Representative logs of drill core comprising high-grade unconformity-hosted uranium from MC-410-1, a basement-unconformity-hosted uranium anomaly MC-410-2, and samples from MC-415 located deeper in the basement along the P2 fault than the other drill cores are provided in Figure 2.3. Bulk compositional data for uranium, carbon,
sulfur, total rare-earth elements, copper, molybdenum, cobalt, nickel, boron, and barium are provided in Tables 2.1-2.3 and plotted as a function of depth on the core logs.
The P2 fault zone is associated with graphitic intervals in metamorphic basement rocks, and hosts the highest abundance of sulfide minerals over the intervals logged. Pyrite vein abundances in every drill hole logged increase from trace amounts in competent basement rock to over 20% in strongly graphitic and brecciated rocks within the P2 fault zone (Fig 2.3). Smaller spikes in pyrite abundance in rocks below the P2 fault are associated with bleached rocks and elevated U concentrations. Sulfur concentration data supports visually estimated pyrite abundances, and are positively correlated with uranium, transition metal, and barium enrichments. Elevated carbon concentrations are associated with the graphitic zones in basement rock that host the P2 fault, and are offset into the hanging wall relative to uranium enrichments in the sandstone fault nose.
Barium, cobalt, nickel, copper, molybdenum, and the rare-earth elements generally have a positive correlation with U concentrations. In MC-410-1 uranium concentrations are elevated at the unconformity, in the basal conglomerate fault wedge in the immediate footwall of the P2 fault, and in a bleached zone below the P2 fault. In MC-410-1, MC-410-2 and MC-415 uranium concentrations are elevated in the P2 fault zone, and in a bleached zone below the P2 fault.
Table 2.1 Bulk compositional data in ppm for selected elements from MC-410-1 Sample depth U C S B REE (tot) Ba Co Ni Cu Mo 545 7.36 - - 12 68.3 33 0.1 0.5 0.8 0.17 556.3 11.7 0.06 100 39 213.5 51 0.26 1.6 2.4 0.34 562.2 279 0.07 1200 15 654.4 30 41.1 171 23.9 1.31 562.9 61.7 0.03 50 52 331.8 24 41.8 149 5.8 0.72 572.1 7.81 0.005 50 53 324.9 31 18.7 71.9 3.1 0.36 581.1 5.6 50 50 55 235.2 106 31.3 63.8 1 0.2 581.9 7.99 2300 100 28 214.7 118 26.4 38.2 3 0.34 590.2 5.38 4000 100 89 256.4 97 16.2 60.2 1.5 0.34 596.7 6.8 23300 13700 142 267.2 36 30.8 88.4 41 9.38 599.2 6.7 18200 21100 97 273.8 54 56.5 162 364 8.64
Table 2.1 continued 602.7 40.9 17900 62600 5670 211.2 32 465 503 19300 87.1 605.2 98 - - 262 139.1 26 6 48 45 11 605.7 449 - - 91 125.7 30 269 962 6 91 606.1 17100 600 1700 171 427.1 72 190 1080 22 68 606.4 1020 - - 248 139.8 37 11 87 4 15 606.7 24 200 600 268 124.0 24 4 55 1 1 607.0 3560 - - 104 318.0 32 13 189 3 128 607.4 186 - - 1390 184.0 32 500 1780 3 19 607.9 28 - - 831 118.5 24 7 65 1 2 608.3 5 - - 1520 193.6 33 1 29 1 1 608.8 26 - - 2940 141.4 27 4 36 1 1 609.3 21 - - 909 74.0 20 4 25 2 1 609.7 136 - - 1610 129.4 32 10 61 5 16 610.1 2630 600 300 887 170.7 31 10 73 10 93 610.4 26 - - 594 68.3 15 2 14 11 27 610.7 775 - - 624 133.8 31 19 560 18 269 611.0 671000 - - 163 2071.9 76 66 205 380 479 611.2 715000 - - 179 1989.6 74 27 151 195 526 611.3 673000 2000 5400 195 1959.7 144 1 147 112 840 611.6 615000 - - 185 1814.2 197 1 144 111 1050 611.9 6760 - - 40 67.8 53 52 52 148 425 612.2 330000 - - 147 1003.2 155 71 210 175 1930 612.5 3870 800 1200 42 77.9 24 48 78 77 538 612.9 718 - - 279 84.1 26 25 36 118 216 613.3 1000 1400 1500 980 97.0 32 24 36 24 161 613.7 1840 - - 1360 185.0 49 9 26 12 216 614.0 9820 - - 787 331.0 106 8 49 19 127 614.3 2990 - - 284 196.8 56 5 30 9 101 614.7 1540 - - 318 92.5 30 11 21 18 53 615.2 298 - - 145 128.3 16 12 20 14 17 615.7 2780 400 1400 514 171.6 63 17 15 57 218 616.0 3050 - - 131 71.5 24 11 12 39 19 616.3 176 - - 189 67.0 15 2.34 6.2 38.6 11.7 616.6 5020 - - 371 129.7 59 15 21 8 36 617.0 1220 - - 187 58.7 18 7 9 6 13 617.4 1220 - - 234 51.8 24 7 9 3 11 617.7 3910 - - 351 150.8 76 6 20 3 6 618.1 355 800 200 489 73.1 22 5 20 2 4 618.6 892 - - 105 57.4 19 13 71 4 6 619.0 648 - - 320 69.4 18 8 43 9 2 625.0 9.76 100 100 947 55.1 16 1.76 9.1 2.6 0.14 630 4.8 400 100 1020 135.8 30 1.04 5.8 0.5 1.78 640 1.87 100 100 315 226.3 36 0.85 3 0.2 1.65 651.8 125 50 300 812 147.7 22 5 20 1 1 652.3 443 - - 812 141.7 34 13 55 33 6
Table 2.1 continued 652.8 5750 - - 761 299.6 87 57 54 15 787 653.1 5790 - - 661 217.4 87 14 30 9 1250 653.4 99200 200 7700 572 1720.4 724 24 42 21 1670 653.6 22400 - - 456 361.5 419 23 37 8 1120 654 20700 - - 695 340.2 543 31 44 9 226 654.3 28100 100 11300 693 518.2 585 29 31 5 69 654.6 11900 - - 596 315.5 160 15 17 4 593 654.9 6800 - - 740 226.4 179 14 16 11 137 655.3 11800 - - 884 311.4 230 45 41 96 1120 655.9 6330 300 5800 1300 256.1 134 11 27 8 320 656.2 2740 - - 365 107.6 53 5 13 4 51 656.5 831 - - 2680 229.6 45 10 10 1 415 657 55 - - 1360 121.6 21 2 4 1 10 657.5 7.09 - - 373 191.4 18 1.72 9.5 2.2 1.55 661.4 2.67 700 100 356 117.0 15 2.11 27.2 0.8 0.65 668.1 2.03 600 100 145 275.9 29 9.88 65.7 1.9 0.88 677.1 2.22 1400 200 115 304.8 31 14.1 85.6 0.5 0.79 686.0 3.13 - - 36 163.7 29 8.03 39.6 1.9 1.39
Table 2.2 Bulk compositional data in ppm for selected elements from MC-410-2 Sample depth U C S B REE (tot) Ba Co Ni Cu Mo 548.1 4.06 - - 257 99.24 44 129 105 5.5 0.2 548.3 4.01 - - 176 40.04 32 26.1 24.6 0.3 0.2 566.1 2.36 7200 50 124 186.31 38 15.8 29 1.1 0.11 575.1 1.99 - - 97 51.35 42 25.1 63.2 6.7 0.52 584.1 2.99 56100 50 36 69.22 60 15.9 42.6 2.7 0.43 592.9 6.96 23100 50 62 83.48 16 23.1 43.3 2.4 0.2 602.1 4.81 1000 1100 58 186.49 1720 18.2 45.5 64.7 2.19 611.1 4.32 6100 50 96 204.36 58 13.3 46.1 19.1 0.66 620.1 4.44 1800 800 69 226.96 489 13.4 57.8 2.7 1.61 629.1 3.77 2500 900 104 192.3 52 11.8 44.9 1.3 0.61 637.9 7.05 13500 15300 125 245.6 40 29.2 83.4 13.2 6.32 647.1 4.04 100 51 39 290.0 681 32.3 65.3 6.2 0.75 656.1 15.2 55000 65000 156 174.8 161 53.4 252 5.8 60.8 657.2 12 56900 98900 478 168.5 145 75.7 207 8.4 49.5 664.9 6.94 14000 31500 199 237.8 261 31.6 128 8.1 11.4 674.1 8.8 15800 26300 112 211.1 268 37.9 115 3.7 4.41 683.1 9.87 3000 9200 139 274.6 32 24.9 54.6 4.8 3.42 689.3 994 12700 9100 266 391.3 135 49.5 76.4 81.6 196 692.1 7.28 2100 10700 138 240.1 93 28.8 77.6 2.5 2.08 694.7 1080 14000 19600 171 167.7 105 24 80.6 6 185 701.1 18.1 3200 3800 177 132.2 43 12.6 33.6 1.6 3.4 710.1 3.82 300 3100 163 258.2 40 17.1 55.7 1 0.84
Table 2.2 continued 719.1 2.15 100 300 57 117.1 23 3.88 14.7 3.7 0.22 728.1 4.82 30800 6500 90 266.4 43 27.8 83 11.1 5.32 731.9 335 - - 104 192.34 58 8.89 128 4.6 82.9 735.8 6.18 - - 125 245.61 10 6.54 133 13.2 12.5 736.7 1090 - - 39 289.99 51 23 277 129 245 737.1 2590 46600 300 156 174.79 114 17 138 51 15 737.6 1920 23700 600 478 168.49 77 12 160 153 25 738.1 372 - - 199 237.75 40 7.17 99.9 11 10.1 749.1 11.6 2400 100 112 211.09 179 16.8 61.4 3.9 0.86 751.9 262 - - 139 274.55 323 30.6 163 3320 3.42 752.4 609 - - 266 391.25 43 14.8 34 517 5.84 752.7 8360 - - 138 240.09 349 180 157 22000 25 753.0 2070 400 4400 171 167.71 38 26 31 415 5 753.3 4420 - - 177 132.16 101 80 59 10800 10 753.7 1140 - - 163 258.15 24 10 9 1780 3 754.2 2040 - - 57 117.06 51 22 17 1870 4 754.8 446 - - 90 266.4 23 5.75 7.6 376 2.61 755.5 349 700 1600 161 153.31 61 12.9 17.8 1180 3.18 758.5 1120 - - 97 57.04 93 6.79 20.4 186 10.3 759.5 632 200 1400 252 95.2 51 4.7 15.6 144 1.27 760.5 3110 - - 381 535.4 154 14 40 339 3 761.3 1230 700 1600 322 229.1 115 5.66 53 5580 2.19 772.9 5.67 - - 570 129.25 377 4.83 40.8 34.5 0.97 785.1 6.19 100 100 126 235.54 89 6.84 54.2 14.7 0.34 791.2 1.44 - - 3430 373.16 32 0.27 1.3 1.9 0.14
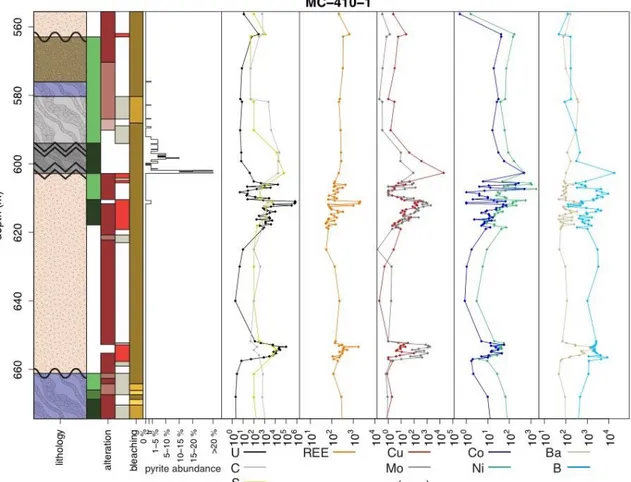
Table 2.3 Bulk compositional data in ppm for selected elements from MC-415 Sample depth U C S B REE (tot) Ba Co Ni Cu Mo 548.2 6.06 50 50 68 158.6 17 3.39 10.2 1.9 0.24 557.2 3.88 - - 116 10.8 22 3.8 18.2 1.1 0.24 566.2 13.7 200 50 56 19.6 579 2.32 1.8 0.8 0.17 575.2 8.15 - - 116 60.0 304 33.5 66.8 3 0.25 584.2 3.6 1900 50 154 210.5 599 22.9 37.3 2.2 0.31 593.2 3.78 - - 156 224.5 289 23.6 47.8 8 0.24 602.2 7.51 - - 81 251.7 494 26.2 59.1 23.6 5.19 611.2 11 50 50 54 14.3 303 0.77 2.1 2 0.2 620.2 4.4 8100 2100 50 243.3 1030 28.3 99.6 22.2 1.64 629.0 3.87 50500 50 52 97.0 504 20.8 43 18 0.38 638.2 8.4 - - 1480 115.4 557 7.21 24.2 2.4 0.55 647.2 5.55 5600 3000 36 248.3 529 24.2 57.5 60.5 2.26 656.2 4.79 - - 29 241.3 1250 30.6 53.1 276 6.09 665.1 3.86 1700 400 23 196.7 678 18.9 46.4 27 0.61 674.1 9.41 19800 32200 65 240.4 96 47.8 186 25.7 9.72
Table 2.3 continued 682.9 5.14 - - 58 279.8 282 65.6 66.4 53.3 1.28 687.4 5.6 6400 134000 - 165.0 70 84 310 120 10 688.1 13.8 - - 120 183.7 139 65.4 275 258 63.5 688.4 14.7 67000 77500 - 264.7 199 46 240 20 49 688.9 11.5 - - 153 114.9 190 85.8 381 26.1 45.9 692.1 13.9 - - 182 157.9 319 61.7 212 12.2 54.1 693.8 7.71 62000 33700 - 201.8 157 28 170 5 39 696.9 14.9 53700 30400 - 98.7 253 45 80 5 51 697.7 13.7 64800 216000 - 104.5 81 149 680 20 60 701.4 4.56 19200 24700 81 116.2 181 38 140 3.4 8.81 710.1 15.8 9600 13600 118 89.9 61 31.1 78.1 10.4 6.46 719.1 3.19 50 4000 90 171.7 20 7.46 24.6 38.4 1.95 728.1 5.1 50 200 87 46.8 19 1.71 32.8 35.8 0.27 737.1 93.1 - - 155 117.2 58 4.22 67.3 139 6.38 746.1 4.18 - - 77 39.4 31 1.66 36.6 3.8 0.55 755.1 63.3 - - 174 117.6 42 3.99 52.6 3 4.23 764.1 5.57 3400 6000 110 218.0 40 23.8 90.8 7.5 1.64 772.2 778 57500 1700 411 348.6 269 13 77 142 25 773.1 31.5 - - 117 212.6 173 24.7 79.1 14.7 8.6 782.1 1.71 50 50 25 9.5 8 1.23 4.3 2.5 0.3 791.1 1.09 - - 24 21.5 87 0.54 5.5 1.2 0.18 800.1 4.24 50 100 66 54.3 95 4.14 17.1 23.8 0.12 803.5 2480 50 400 233 263.3 492 18 59 136 9 809.2 0.81 50 50 65 68.5 287 5.34 18.5 1 0.17 818.1 4.95 50 500 100 260.5 261 25.4 82.9 2.5 2.37 827.1 2.62 50 50 76 93.9 31 3.42 5.4 8.1 0.32 836.1 2.26 - - 26 33.7 21 0.39 2.1 3.8 0.31
2.3.2 Optical Petrography and Scanning Electron Microscopy
Unaltered rocks and pre-ore alteration Unaltered Athabasca Group sandstone consists of detrital quartz with interstitial illite and trace amounts of zircon. Euhedral quartz overgrowths (EQz1-2) on detrital quartz, and lining vugs in the sandstone are associated with hematization
(Hem1-2). Quartz corrosion affects detrital quartz and EQz1-2.
Unaltered basement gneiss near the P2 fault consists of quartz, biotite, plagioclase, graphite, ± potassium feldspar, ± almandine, and ± cordierite; trace minerals include rutile, zircon, and monazite. Pods of anatectic pegmatite composed of biotite, quartz, and potassium feldspar are interlayered with the gneiss. Potassium feldspar and almandine distal to the P2 fault show variable degrees of chloritization.
Fault-hosted pyrite veins (Py1) are abundant (5 - >20%) within the P2 fault zone along
strike and at all depths examined during core logging. Py1 veins cut foliation, are associated with
illitized metamorphic K-feldspar, contain inclusions of fragmented metamorphic rutile, and are commonly armored by hydrothermal quartz veins of which the first generation (VQz1) formed
with the pyrite (Fig. 2.4A). These observations suggest that Py1 is post-metamorphic.
Pyrite veins distal to the unconformity fill fractures, and frequently exhibit a sieved texture where pyrite grew around chemically inert graphite (Fig. 2.4A). The margins of pyrite veins at depth are smooth and free of embayment, and are spatially associated with illite alteration of the host rock (Fig. 2.4B, Fig. 2.5A). As the faulted unconformity is approached along the P2 fault from the basement, Py1 veins show increasingly intense dissolution textures
and replacement with Fe-sudoite along vein margins and in vein penetrating fractures (Figs.2.4C and D, Figs. 2.5B, C, E and F). The margins of Py1 armored by VQz1 show little to no
dissolution textures or replacement by sudoite (Fig. 2.4C, and Figs. 2.5C and D). The Fe-sudoite alteration of Py1 veins is most intense in basement rocks along the P2 fault-sandstone contact,
Figs. 2.5B, and C). High-contrast BSE imagery of sudoite-altered Py1 (Fig. 2.5E) shows a patchy
texture delineated by regions of variable S and Fe content. Energy-dispersive X-ray spectroscopy shows that all Py1 replaced by Fe-sudoite is S deficient. These compositional heterogeneities are
not present in unaltered Py1.
Metamorphic and hydrothermal quartz in rocks with extensive sudoite alteration of pyrite is partially to totally replaced by sudoite (Fig. 2.5C). BSE imaging of sudoite near partially replaced quartz, or surrounding sudoite breccia fragments shows darker Mg-sudoite cores surrounded by a bright halo of Fe-sudoite (Figs. 2.5C and D). Sandstone-hosted uranium ore bodies are associated with pervasive sudoite-dravite alteration. Ore samples rich in sudoite contain sparse corroded detrital quartz grains, indicating nearly complete dissolution of detrital quartz during sudoite alteration. Trace amounts of sub-micron scale barite occur as nodules within the pore space between mixed illite and sudoite in bleached basement rocks associated with basement-hosted uraninite (Figs. 2.6A-C).
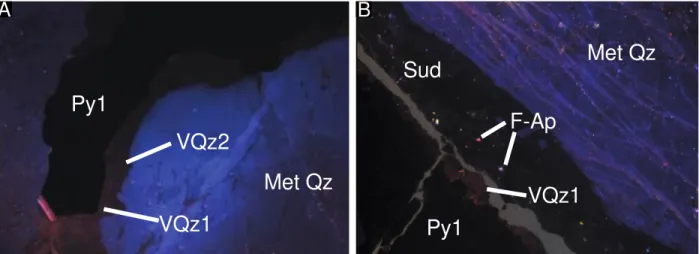
CL imaging was used to identify crosscutting relationships with zoning in quartz. Py1
veins commonly occur in contact with hydrothermal quartz veins. CL images of contacts between vein-hosted pyrite and quartz veins show vein-hosted pyrite cutting the inner growth zones in the quartz, and a second quartz vein with darker CL rimming the first quartz vein (Fig. 2.7).
Ore-stage alteration Uraninite ore at McArthur River occurs in the sandstone fault wedge at the unconformity, and associated with bleached basement rocks as deep as 120 m below the
unconformity.
Sandstone-hosted deposits comprise three generations of uraninite, and are spatially associated with intense replacement of detrital quartz by sudoite and dravite. Small 100-200 µ m crystals of euhedral pyrite and cobaltite-gersdorffite occur disseminated in intensely sudoitized sandstone. The first generation of uraninite (Urn1) is volumetrically the most significant,
overgrows euhedral pyrite, and contains vugs lined by euhedral uraninite and filled with marcasite (Mrc1) (Figs. 2.8A and B). The outer parts of euhedral uraninite have marcasite
inclusions that appear to have formed along or replace growth zones in Urn1 (Fig. 2.8A).
Marcasite in the vug has partially inverted to pyrite. Urn1 also occurs replacing euhedral pyrite
formed during pre-ore alteration.
The second generation of sandstone-hosted uraninite (Urn2) occurs as an overgrowth on Urn1 and
euhedral cobaltite-gersdorffite (Figs. 2.8B, C, and D). Urn2 is distinguished from Urn1 by the
darker optical reflectance, and the presence of chalcopyrite inclusions embayed into the rim of Urn2. Chalcopyrite also occurs as nodules on dravite crystals in sandstone with strong sudoite
replacement of quartz, rimming or replacing both marcasite generations, filling microfractures in fault-hosted pyrite, rimming cobaltite-gersdorffite overgrowths on fault-hosted pyrite, and replacing fault-hosted Py1 (Figs. 2.8C, E, F, and 2.9C-F). Sudoite replaces corroded detrital and
euhedral quartz in sandstone. Sudoite is partially replaced by Urn1 and Urn2. A second
generation of hydrothermal quartz veins (VQz2) cuts chalcopyrite filling microfractures in
vein-hosted pyrite, however the paragenetic relationship between Urn3 and VQz2 is unknown.
There are two generations of marcasite, these are distinguished based on their cross-cutting relationships with hydrocarbon buttons (HCB). Mrc1 marcasite is late- to post-Urn1,
infills vugs in Urn1, and has weak Cu growth zones that are cut by HCB (Fig 2.8A). Mrc2
marcasite grew around or into fractures in HCB (Fig. 2.8E), and has distinct Cu-rich zones in BSE images (Fig 2.9B). Both marcasite generations have partially inverted to pyrite (Figs. 2.8A and F) as indicated by the patchy anisotropy and porosity caused by the volume change during the marcasite to pyrite transformation (Murowchick, 1992). Mrc2 is rimmed or replaced by
chalcopyrite.
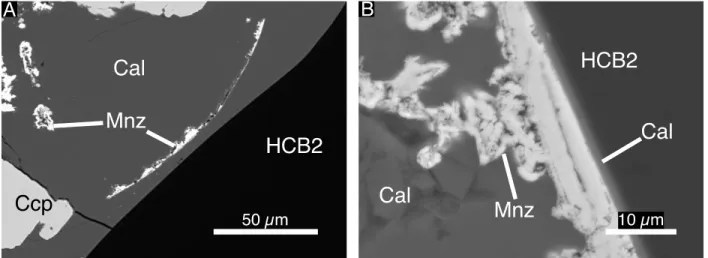
The third generation of sandstone-hosted uraninite (Urn3) replaces chalcopyrite along
grain boundaries between pre-ore fluorapatite and ore-stage HCB (Fig. 2.9E), and has cores partially replaced by chalcopyrite (Fig. 2.10 C and D). Urn3 also occurs as inclusions along the
growth zone delineating HCB1 from HCB2 (Fig. 2.9F). HCB1 and HCB2 are optically discernible
with HCB2 having a slightly lower reflectance than HCB1. HCB were distinguished from
Fig. 2.4 Photomicrographs of pyrite veins in the P2 fault zone. A. reflected light and B. transmitted plane polarized light images of sample MC 410-2 658.1 showing unaltered pyrite veins (Py1), associated illitization, metamorphic rutile inclusions in Py1, and absence of sudoite
alteration. C. Transmitted plane polarized light image of sample MC 411-1 641.1 from basement rock in the hanging wall. These samples show sudoite alteration of fault-hosted Py1, replacement
of illite with sudoite, absence of sudoite alteration where pyrite is armored by hydrothermal quartz (VQz1), and replacement of metamorphic and hydrothermal quartz by sudoite. D.
Reflected light image of sample MC-411-1 660.5 showing fault-hosted Py1 replacement by
sudoite, euhedral Py2 overgrowth on corroded Py1, and fluorapatite associated with the strongest
sudoite alteration. E. transmitted plane polarized light and F. reflected light images of sample MC-410-1 602.7 in the immediate metamorphic hanging wall to the sandstone fault wedge. This sample shows pervasive sudoite-dravite-fluorapatite alteration, hematite inclusions in
Fig. 2.5 BSE images of pyrite veins distal and proximal to the unconformity. A. Sample MC-430 971.6, a relatively unaltered basement gneiss at depth with brecciated fault-hosted pyrite vein and associated illite alteration. B-D. Sample MC-411-1 660.5 from the footwall near the
unconformity below the fault wedge with pyrite (Py1) dissolution textures, hydrothermal quartz
armoring (VQz1), sudoite-fluorapatite alteration, and Fe-sudoite replacing pyrite. E. Sample MC-411-1 660.5 showing patchy texture in Fe-sudoite replaced Py1 delineating zones of variable
sulfur content, and overgrowth of euhedral Py2 on Py1. F. Sample MC-411 632.0 showing
Fe-sudoite replacing Py1.