VTI notat 8A-2011 Utgivningsår 2011
www.vti.se/publications
Wear particles from road pavements with rubber
mixed bitumen
Comparison with reference pavement
Mats Gustafsson Göran Blomqvist Cecilia Bennet
VTI notat 8A-2011
Dnr: 2007/0721-24
Foreword
This project was initiated by Thorsten Nordgren, Swedish Traffic Administration, in order to study whether two bituminous pavement constructions with rubber admixture give rise to particulate emissions different from those from a reference pavement with the same aggregates.
VTI has performed this commission with the help of the VTI road simulator which had been used for studies of particle generation in several projects. The project leader has been Mats Gustafsson. The project leader wishes to express his sincere thanks to Tomas Halldin and Romuald Banek, without whose technical expertise it would have been impossible to carry out this project.
Linköping, June 2011
Mats Gustafsson project leader
VTI notat 8A-2011
Quality review
Internal peer review was performed on 10 May 2011 by Leif Viman. Mats Gustafsson made alterations to the final manuscript of the report on 12 May 2011. Maud Göthe-Lundgren, research director of the project, examined and approved the report for publication on 1.
Kvalitetsgranskning
Intern peer review har genomförts den 10 maj 2011 av Leif Viman. Mats Gustafsson har genomfört justeringar av slutligt rapportmanus 12 maj 2011. Projektledarens närmaste chef, Maud Göthe-Lundgren, har därefter granskat och godkänt publikationen för publicering 13 maj 2011.
VTI notat 8A-2011
Contents
Summary ... 5 Sammanfattning ... 7 1 Introduction ... 9 2 Abbreviations ... 10 3 Method ... 11 3.1 Road simulator ... 113.2 Pavement types and tyres ... 11
3.3 Initial wear of the pavement ... 12
3.4 Design of the test ... 12
3.5 Particle measurement ... 12
3.6 Measurement of wear and stud protrusion ... 13
4 Results ... 14
4.1 Particle concentration ... 14
4.2 Particle size distributions ... 17
4.3 Wear and stud protrusion ... 18
5 Discussion ... 20
6 Conclusions ... 23
References ... 24
VTI notat 8A-2011 5
Wear particles from road pavements with rubber mixed bitumen – comparison with reference pavement
by Mats Gustafsson, Göran Blomqvist and Cecilia Bennet VTI (Swedish National Road and Transport Research Institute) SE-581 95 Linköping Sweden
Summary
Wear of road pavements by studded tyre gives rise to emissions of repairable particles (PM10). The permissible concentration of PM10 is regulated by an EU directive which is
implemented in an environmental quality standard in Sweden. One way of reducing the emission of wear particles is to adjust the properties of the road pavement. In the present project, the effect on particle emission of mixing milled tyre rubber into the pavement bitumen has been investigated. Tests were made using the VTI road simulator using two pavement constructions containing rubber (GAP11 and GAÖ11) and one reference pavement (ABS11). The concentrations and mass size distributions of the emitted particles were measured.
The results show that GAP11 gives rise to lower PM10 concentrations (in this laboratory
environment 20–25%) than the reference pavement ABS11, while GAÖ11 does not differ from the reference. Particle size distributions show that PM10 has a bimodal
distribution, with two mass maxima at 4–5 and 7–8 µm. GAP11 decreases the mass size distribution mainly in the finer mode, while GAÖ11 seems to affect mainly the coarser mode. Ultrafine particles are emitted during all tests, with number distribution maxima at around 20–30 nm. These particles are formed by the interaction between tyre studs and pavement and/or tyre rubber. A higher speed generates higher concentrations of ultrafine particles.
All in all, the results indicate that GAP11 has a lowering effect on PM10 emissions,
while GAÖ11 does not seem to lower the emissions compared with the reference pavement ABS11.
VTI notat 8A-2011 7
Slitagepartiklar från vägbeläggningar med gummiinblandad bitumen – jämförelse med referensbeläggning
av Mats Gustafsson, Göran Blomqvist och Cecilia Bennet VTI
581 95 Linköping
Sammanfattning
Dubbdäcksslitage av vägbeläggningar orsakar emissioner av inandningsbara partiklar (PM10) vars tillåtna halt i omgivningsluften är reglerad enligt en miljökvalitetsnorm. Ett
sätt att minska partikelemissionen är att anpassa beläggningarnas egenskaper.
Föreliggande projekt har undersökt betydelsen för partikelbildningen av inblandning av gummi från bildäck i två beläggningars bitumenfas. Undersökningen genomfördes i VTI:s provvägsmaskin där två gummiinblandade beläggningar av olika konstruktion (GAP11 och GAÖ11) och en referensbeläggning (ABS11) undersöktes. De bildade partiklarnas halter och storleksfördelningar studerades.
Resultaten visar att GAP11 ger upphov till 20–25 % lägre halter av PM10 än
referensbeläggningen, medan GAÖ11 inte skiljer sig från referensbeläggningen vad gäller PM10. Storleksfördelningar visar att partikelmassan för PM10 har två maxima vid
4–5 och 7–8 µm. GAP11 sänker koncentrationen av den finare moden jämfört med ABS11, medan GAÖ11 främst påverkar den grövre moden. Ultrafina partiklar bildas och en mod vid ca 20–30 nm dominerar partikelantalsfördelningarna. Dessa partiklar är relaterade till däckdubbarnas interaktion med beläggning och/eller däckgummi. Högre hastighet medför högre koncentrationer av ultrafina partiklar.
Sammantaget tyder resultaten på en sänkande effekt av PM10-emissionerna av
gummi-inblandning i konstruktionen GAP11, medan GAÖ11 inte verkar sänka emissionerna jämfört med en ABS11.
VTI notat 8A-2011 9
1 Introduction
The objective of this commission was to compare the particle generating properties of a conventional ABS11 pavement with two pavements in which the bitumen content had been modified by the admixture of rubber components. The pavements were identical with respect to the aggregate, which was rhyolite. In this report, these pavements are referred to as GAP11 and GAÖ11.
The investigation has been carried out in the VTI road simulator in a collaborative project between VTI and the Department of Design Sciences, Division of Ergonomics and Aerosol Technology, Lund University.
10 VTI notat 8A-2011
2 Abbreviations
AB Sasphalt concrete, aggregate rich
APS aerodynamic particle sizer (instrument for particle size distribution) DT DustTrak (measures PM10 or PM2.5)
GAP gap graded rubber asphalt GAÖ open textured rubber asphalt
PM10 mass concentration of particles smaller than 10 m (respirable particles)
PM2.5 mass concentration of particles smaller than 2.5 m
PVM road simulator
SMPS Scanning Mobility Particle Sizer (instrument for particle size distribution)
VTI notat 8A-2011 11
3 Method
3.1 Road
simulator
The project has been carried out using the VTI road simulator (PVM) (Fig. 1). In order to study wear particles separately, without admixture of particles from exhausts and other anthropogenic and natural sources, it is essential that the particles should be generated and sampled in an environment where other sources are minimised. This could be achieved by placing the measuring instruments in the enclosed room around the road simulator, which has been used for studying the wear of different types of road pavements and tyres.
The road simulator comprises a 0.5 m wide circular track of 16 m diameter which can be paved with the surfacing to be tested. The machine rotates about a central vertical shaft on which six wheel axles are mounted. On these, different types of tyre can be fitted. Four of the axles are driven by electric motors. During a test, the wheels are lowered onto the track until the required axle pressure has been attained, and the wheels impart a rotary motion to the track. Speed can be varied steplessly up to 70 km/h. At speeds above 50 km/h an eccentric can be engaged to ensure that the wheels do not drive along the same track but cover almost the entire width.
Figure 1 The VTI road simulator.
3.2
Pavement types and tyres
In this project, two different constructions comprising rubber modified bitumen (rubber asphalt) and a reference pavement are tested:
GAP11 (Gap graded rubber asphalt) GAÖ11 (Open textured rubber asphalt)
12 VTI notat 8A-2011
The aggregate material is the same in all the pavements and the largest coarse aggregate size is 11 mm. All the pavements were tested with studded tyres of the type Nokian Hakkapeliitta 4.
3.3
Initial wear of the pavement
The initial wear process implies that the surface layer of bitumen is worn away by the action of the studded tyres while the track is sprayed with water, in accordance with a standard procedure. This is done to expose the aggregate material from the bitumen, so that the surface of the pavement more resembles a normally worn pavement. Standard running-in comprises about 20,000–30,000 revolutions at 70 km/h. Since the pavements with rubber admixture were found to be more difficult to strip, running-in was increased to about 40,000 revolutions which exposed the aggregates.
3.4
Design of the test
The VTI road simulator (PVM) is installed in a closed room with controlled ventilation. During a test, the pavement, type of tyre and the initial temperature of the room and the pavement can be selected. The studded tyres used were of the make Nokian
Hakkapeliitta 4. Both tests were performed in accordance with the same driving schedule (Table 1).
Table 1 Driving schedule for PVM. The term "sink" refers to a fan with a filter that was used to lower the particulate contents in the room in order to improve control of the sampling.
Speed Time
30 1 hour 30 min
50 1 hour 30 min
70 2 hours
70 1 hour with sink
3.5 Particle
measurement
An outline description of the types of instrument used to measure the occurrence of respirable particles is given below.
Tapered Element Oscillating Microbalance (TEOM).
The instrument is based on gravimetry and gives a value of the mass concentration PM10 (mass concentration of particles smaller than 10 m) every five minutes. The
method is gravimetric and has been approved for air quality monitoring.
DustTrak (DT)
Two of these optical instruments were used in the investigation: one measured PM2.5
(mass concentration of particles smaller than 2.5 m) and the other PM10.The temporal
resolution of both was 3 seconds. The method is not approved for air quality monitoring but has a higher temporal resolution than TEOM.
VTI notat 8A-2011 13
These instruments measure particles in the size intervals 7.64–300 nm (SMPS) and 0.523 –17.14 m (APS). Data in the lower size interval were presented as particle number distributions while the coarser interval was presented as mass distributions. The reason is that nanoparticles have a very low mass, but, in return, they are present in very large numbers, while the coarser particles have a high mass but there are only few of them. During the APS measurements a PM10 inlet, which separates particles larger than
PM10, was used.
In addition to particles, air, tyre and surfacing temperatures were measured. Relative humidity was also determined during the measurements. Prior to the investigation the room was cooled. The objective was to lower the temperature during the tests to a degree or two below freezing so as to reproduce realistic winter conditions. During the tests on the two pavements an initial temperature of ca -1°C was achieved (see Table 2).
3.6
Measurement of wear and stud protrusion
Wear was measured on four pavement slabs with the laser profilometer after ca 40,000 revolutions during the running-in process and after particle measurement on each pavement.
Stud protrusion was measured on all four tyres before and after particle measurement. The mean stud protrusion on ten studs per tyre was used.
14 VTI notat 8A-2011
4 Results
4.1 Particle
concentration
Optimally, all ambient parameters are the same at the start of each measurement. Table 2 shows all the mean values of the ambient parameters at the start and at 30, 50 and 70 km/h. The values are the means for periods of 15 minutes at the end of each speed interval. Experience shows that the pavement temperature and humidity are important for the PM10 contents. When ABS11 is tested, RH is slightly higher than for GAP11 and
GAÖ11. The air and tyre temperatures are however slightly higher during the test on GAÖ11. All temperatures increased during the test. The relative humidity which is mainly dependent on air temperature therefore decreases during the tests.
Table 2. Temperatures and humidity during particle measurements.
ABS11 Parameter Start 30 km/h 50 km/h 70 km/h Pavement temperature (°C) -0.9 1.3 4 6.9 Air temperature (°C) -0.8 3.2 5.8 9.0 Tyre temperature (°C) -0.3 9.9 13.7 17.4 RH (%) 80 84 80 76 GAP11 Parameter Start 30 km/h 50 km/h 70 km/h Pavement temperature (°C) -0.9 0.6 2.9 6.7 Air temperature (°C) -1.2 2.2 4.4 8.7 Tyre temperature (°C) -0.6 8.9 12.4 16.9 RH (%) 74 81 78 73 GAÖ11 Parameter Start 30 km/h 50 km/h 70 km/h Pavement temperature (°C) -0.7 0.8 3.1 6.7 Air temperature (°C) 2.0 2.6 4.6 8.5 Tyre temperature (°C) 1.2 9.3 12.6 16.7 RH (%) 76 76 71 62
Fig. 2 shows the changes in PM10 contents measured with TEOM. Since TEOM is a
gravimetric instrument, it is considered that data from this show the most correct difference in particle generation between the different pavements. As the speed is increased, contents increase and then level out to show a relatively constant concentration level. As will be seen (also in Fig. 3), the contents for ABS11 and GAÖ11 are very similar, while GAP11 generates PM10 concentrations that are ca 20%
VTI notat 8A-2011 15 Figure 2 Time series of PM10 measured with TEOM.
Figure 3 Median values of PM10 (TEOM) during a fifteen minute period at the end of
the speed intervals 30, 50 and 70 km/h.
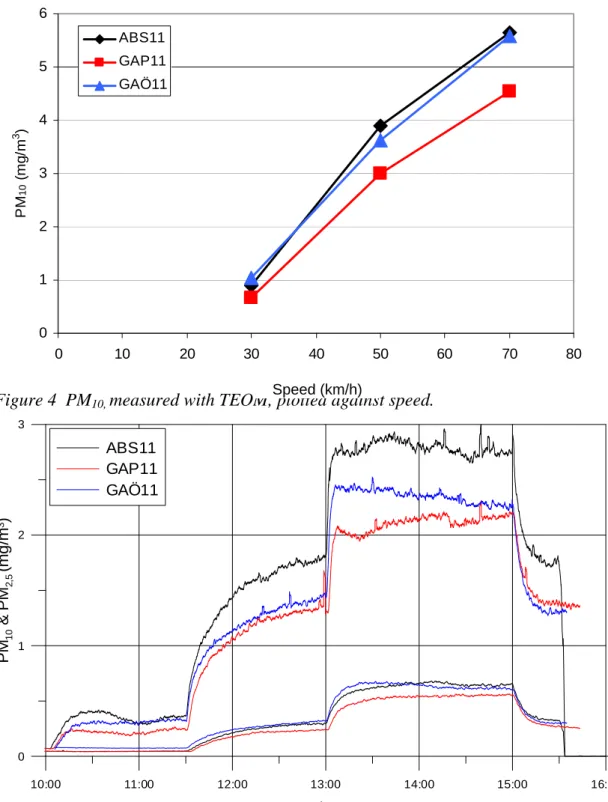
If data from Fig. 3 are plotted against speed, it is seen that the PM10 – speed curve is
almost linear (Fig. 4).
10:00 11:00 12:00 13:00 14:00 15:00 16:00 Tid 0 2 4 6 8 PM 10 (m g /m 3) ABS11 GAP11 GAÖ11 0 1 2 3 4 5 6 30 50 70 Hastighet (km/h) PM 10 (m g/ m 3 ) ABS11 GAP11 GAÖ11 Time Speed (km/h)
16 VTI notat 8A-2011
Figure 4 PM10, measured with TEOM, plotted against speed.
Figur 5 Time series for PM10 och PM2.5 measured with DustTrak.
The measurements with DustTrak exhibit the same pattern as for TEOM, but with lower concentrations. However, in contrast to the TEOM results, GAÖ11 has lower PM10
concentrations than the reference ABS11, especially at 50 and 70 km/h (Fig. 5). The figure also shows the concentration of PM2.5measured with DustTrak. In this fraction,
ABS11 and GAÖ11 generate almost identical concentrations while GAP11 gives rise to lower concentrations. 0 1 2 3 4 5 6 0 10 20 30 40 50 60 70 80 Hastighet (km/h) PM 10 (m g/ m 3 ) ABS11 GAP11 GAÖ11 10:00 11:00 12:00 13:00 14:00 15:00 16:00 Tid 0 1 2 3 PM 10 &P M2, 5 (m g /m 3) ABS11 GAP11 GAÖ11 Speed (km/h) Time
VTI notat 8A-2011 17
4.2
Particle size distributions
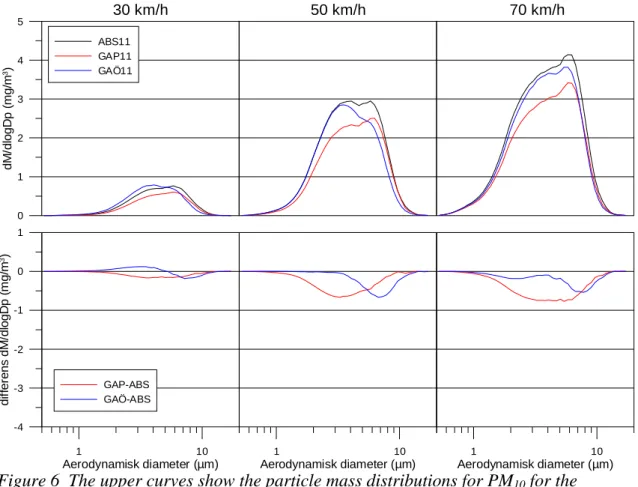
Fig. 6 shows extracts of APS data (0.523 – 17.14 m) for the speeds 30, 50 and
70 km/h. These extracts are the means of size distributions during ten minute periods at the ends of the speed intervals 30, 50 and 70 km/h. The rapid decrease in the coarser parts of the curves is caused by the PM10 intake that separates coarser fractions. It is
seen here that the distributions tend towards being bimodal, i.e. they are made up of two fractions (modes) with maxima at different particle sizes. The distributions at 50 and 70 km/h have two clear maxima, one at 3–4 m and one at 7–8 m. The maxima for the rubber admixture pavements are slightly different from the reference pavement. In the lower part of Fig. 6 the differences between the distributions are highlighted. It is seen that the mode at 3–4 m is reduced mainly by GAP11, while GAÖ11 mainly affects the coarser mode 7–8 m.
Figure 6 The upper curves show the particle mass distributions for PM10 for the
pavements. The lower curves show the difference between the mass distributions for the rubber admixture pavements and the reference pavement.
As in all measurements where the pavements are tested with studded tyres, ultrafine particles (< 100 nm) are formed in these studies also. Fig. 7 shows extracts of these particles (7.64 – 300 nm, SMPS data) for the speeds 30, 50 and 70 km/h. These extracts are the means of particle size distributions during fifteen minute periods at the ends of the speed intervals 30, 50 and 70 km/h. Note that the occurrence of particles in the different sizes is given as numbers per cm3.
0 1 2 3 4 5 dM /d logD p (m g /m 3) ABS11 GAP11 GAÖ11 30 km/h 50 km/h 70 km/h 1 10 Aerodynamisk diameter (µm) -4 -3 -2 -1 0 1 di ff e rens dM /d logD p (m g /m 3) GAP-ABS GAÖ-ABS 1 10 Aerodynamisk diameter (µm) 1 10 Aerodynamisk diameter (µm)
18 VTI notat 8A-2011 Figure 7 The upper curves show particle number distributions for the pavements at different speeds. The lower curves show the differences between the particle number distributions for the rubber admixture pavements and the reference pavement.
At 30 km/h, the particle number distributions are very similar. At 50 km/h, GAP11 gives rise to lower contents, but the appearance of the distributions is very similar (maxima at ca 20–30 nm). At 70 km/h the rubber admixture pavements tend to produce higher concentrations than the reference pavement. The shape of the distribution is also slightly altered, inasmuch as the rubber admixture pavements give rise to somewhat coarser fractions, while the maxima of the reference pavement are displaced towards slightly smaller sizes.
4.3
Wear and stud protrusion
The change in wear during the running-in process and particle measurement for both pavements is shown in Fig. 8. GAÖ11 is different from ABS11 and GAP11. The probable cause is that the laser profilometer is not reliable when open textured
pavements are measured, since the voids in the pavement may provide contributions to the measurements, although they are not wear. GAP11 is abraded slightly more rapidly than ABS11 during the initial wear process under water spray, but somewhat more slowly during the dry measurement. However, these wear measurements are only indications. A regular wear measurement is performed while water is sprayed onto the track, and at a much higher number of revolutions.
Wear, and thus particle generation, is a function, inter alia, of the stud force which is, in turn, influenced by the stud protrusion. Fig. 9 shows that the difference in stud
protrusion before and after the measurements is at most one tenth of a millimetre, which is considered to have only a marginal effect on the results.
0 40000 80000 120000 dN /d logD p (#/ cm 3) ABS11 GAP11 GAÖ11 30 km/h 50 km/h 70 km/h 1 10 100 Mobilitetsdiameter (nm) -40000 -20000 0 20000 40000 60000 dN /d logD p (#/ c m 3) GAP-ABS GAÖ-ABS 1 10 100 Mobilitetsdiameter (nm) 1 10 100 1000 Mobilitetsdiameter (nm)
VTI notat 8A-2011 19 Figure 8 Average wear during the initial wear process and particle measurement (medel = mean).
Figure 9 Stud protrusion before and after particle measurement.
0.00 0.10 0.20 0.30 0.40 0.50 0.60 0.70 0.80 0.90 0 10 000 20 000 30 000 40 000 50 000 60 000 70 000 Varv i PVM S li tage (m m ) ABS11 medel GAP11 medel GAÖ11 medel Inslitning av beläggningarna (vatten används) Partikelmätning (torr körning) 0.00 0.20 0.40 0.60 0.80 1.00 1.20 1.40 0 5 000 10 000 15 000 20 000 25 000 Varv i PVM D ubbu ts ti c k (m m ) ABS11 GAP11 GAÖ11 Initial wear of pavements, water spray Particle measurement (dry runs)
Revolutions in road simulator
Wear (mm)
Revolutions in road simulator
20 VTI notat 8A-2011
5 Discussion
The results of this investigation confirm the conclusions of the previous test, that a rubber admixture pavement slightly reduces the formation of PM10 in relation to an
identical pavement without rubber admixture (Gustafsson et al, 2009). This conclusion is valid for GAP11 in comparison with ABS11, while it is more doubtful whether it also applies for the open textured pavement GAÖ11. Data from TEOM which should be the most reliable for comparison do not exhibit any clear difference. DustTrak and APS (particle size distribution), however, show slightly lower contents for GAÖ11 compared with ABS11.
For GAP11, the reduction in PM10 concentration at the three speeds is ca 20–25%
compared with ABS11. In percentage terms, the decrease is somewhat greater at higher speed.
The particle mass concentrations exhibit bimodal distributions for all pavements, which indicates that there are two different sources or processes that generate the PM10
particles. To obtain an idea as to what these are requires sampling and analysis, which were not included in this project. For the moment, it is not clear what these sources are, but since GAÖ11 is an open textured pavement with a smaller amount of binder, one possible explanation is that the coarser mode originates from the binder, while the somewhat finer mode comes from the aggregate.
GAP11 and ABS11 may be compared to similar pavements in Gustafsson et al (2009). The aggregate then was quartzite from Dalby. The chief differences in mass size
distributions are a less clear bimodality in the earlier pavements and a higher proportion of finer particles; see Fig. 10. These differences are chiefly attributed to the properties of the aggregate.
Figure 10 Mass size distribution for comparable ABS and GAP pavements in the present and earlier tests.
The pavements with rubber admixture tend to produce higher contents of ultrafine particles at 70 km/h, while GAP11 produces lower contents at 50 km/h. At 30 km/h there is no discernible difference between all the pavements. This is slightly in contrast to earlier tests (Gustafsson et al., 2009) where the rubber admixture pavement produced significantly lower contents of ultrafine particles at 50 and 70 km/h (Fig. 11).
1 10 Aerodynamisk diameter (µm) 0 2 4 6 8 dM /d lo gD p (m g /m 3) ABS11 2009 GAP11 2009 ABS11 2010 GAP11 2010 1 10 Aerodynamisk diameter (µm) 1 10 Aerodynamisk diameter (µm) 30 km/h 50 km/h 70 km/h
VTI notat 8A-2011 21 Figure 11 Particle number distributions of ultrafine particles in the present test,
compared with results from Gustafsson et al., 2009.
Fig. 11 also shows that the particle number distributions from the tests in Gustafsson et al. (2009) also display the start of a strong maximum towards the lower limit of size of the measuring instrument. This particle fraction sporadically occurred in various tests without any demonstrable relationship to pavements or tyres.
It has recently been shown that the production of ultrafine particles is associated with the contact between the studs and aggregates or bitumen, or with the stud-tyre contact. Since the differences between the different types of pavement are pronounced, it is most probable that the source is to be found in the studs' contact with either the aggregates or the bitumen in the pavement. It is however not possible on the basis of these tests to draw any further conclusions whether this source is affected by the admixture of rubber into the bitumen.
Wear in GAP11 develops more rapidly during the wet initial wear phase, and more slowly during the dry particle measurement, than in ABS11. The causes of this are open to conjecture. It might be that the surface layer of GAP11 with rubber admixture is abraded more rapidly than that on ABS11, while abrasion of the exposed aggregate material occurs slightly more slowly.
The differences in stud protrusion were very small between the tests. GAÖ11 had ca 0.05–0.1 mm larger stud protrusion than ABS11, and GAP11 about 0.02–0.05 larger. The effect of these differences, which is quite likely to be small, would result in the particle contents for GAP11 and ABS11 having to be slightly adjusted upwards, which, taken together, would give GAÖ11 a slightly more favourable result regarding particle generation. Experience shows, however, that such small differences in stud protrusion have only a marginal effect on particle generation.
In order that a correction may be made regarding the way in which the measured contents are influenced by external factors, a multiple regression analysis was performed on the basis of runs on some standard pavements (ABS) under different external conditions. The governing factors were the ball mill value of the aggregate material, the stud protrusion and the relative humidity (RH) in the room. This multiple regression produces the following formula for the determination of the expected PM10
content:
PM10= 1.38 · Ball mill – 0.087 · RH + 2.90 · stud protrusion
1 10 100 Mobilitetsdiameter (nm) 0 100000 200000 300000 dN /d lo gD p (#/ cm 3) ABS11 2009 GAP11 2009 ABS11 2010 GAP11 2010 1 10 100 Mobilitetsdiameter (nm) 1 10 100 1000 Mobilitetsdiameter (nm) 30 km/h 50 km/h 70 km/h
22 VTI notat 8A-2011
The ball mill value has greatest significance, followed by RH, while the stud protrusion has the least significance.
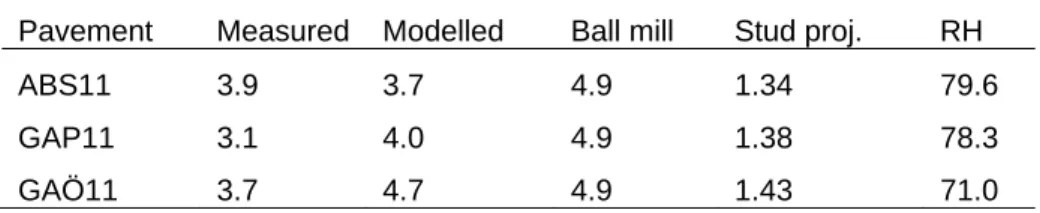
If the modeled values are compared with the measured values (Table 3), it is seen that the measured content for ABS11 (at 50 km/h) is not very far from the expected content. On the other hand, it is found that both the rubber admixture pavements are ca 1 g/m3
lower than what the model predicted (GAP: -0.9, and GAÖ = -1.0).
This may be interpreted to mean that the content-reducing effect of rubber admixture in the pavement is in the order of 1 g/m3. It must however be borne in mind that the model
for adjusting the values on the basis of RH, stud protrusion and ball mill value is as yet based only on a limited volume of data, and the results should therefore be seen as an indication of the content-reducing effect rather than a proof of this.
Table 3 Results of a multiple regression for PM10 at 50 km/h, with the parameters ball
mill value, stud protrusion and RH.
Pavement Measured Modelled Ball mill Stud proj. RH
ABS11 3.9 3.7 4.9 1.34 79.6
GAP11 3.1 4.0 4.9 1.38 78.3
VTI notat 8A-2011 23
6 Conclusions
All the measuring methods show that GAP11 gives rise to lower particle
emissions than the reference pavement ABS11. In the laboratory, the differences are ca 20–25% for PM10 measured with TEOM.
According to the gravimetric method (TEOM), GAÖ11 does not give rise to lower PM10 concentrations than ABS11, while both DustTrak and the APS
methods indicate slightly lower contents for GAÖ11.
The mass distributions of the particles are bimodal for all three pavements, with peaks at 4–5 and 7–8 m.
In the mass distribution data, both GAP11 and GAÖ11 exhibit slightly lower contents than ABS11, but GAP11 mainly lowers the finer mode (4–5 m) while GAÖ11 mainly affects the coarser mode (7–8 m).
The particle number distributions show that ultrafine particles, with a particle number maximum at 20–30 nm, are generated during the tests. This is in
accordance with all the investigations in the road simulator where studded tyres are used.
All in all, the results indicate that rubber admixture has a positive effect on particle emissions in the construction GAP11, and to a lesser extent also in GAÖ11, compared with an ABS11.
24 VTI notat 8A-2011
References
Gustafsson, M., et al., 2009. Nano Wear – nanopartiklar från däck- och vägbaneslitage? (Nano Wear - nanoparticles from tyre and pavement wear?) (In Swedish).
Gustafsson, M., et al, 2008. Properties and toxicological effects of particles from the interaction between tyres, road pavement and winter traction material. Science of the Total Environment 393, 226–240.
Appendix Page 1 (2)
VTI notat 8A-2011 1
Temperatures and humidity
Figure A1. Change in pavement temperatures during the tests. (Tid = Time)
Figure A2. Change in air temperature during the tests.
10:00 11:00 12:00 13:00 14:00 15:00 16:00 Tid -5 0 5 10 t( C) ABS11 GAP11 GAÖ11 10:00 11:00 12:00 13:00 14:00 15:00 16:00 Tid -5 0 5 10 15 20 t( C) ABS11 GAP11 GAÖ11 Time Time
Appendix Page 2 (2)
2 VTI notat 8A-2011
Figure A3. Change in tyre temperature during the tests.
Figure A4. Change in relative humidity during the tests.
10:00 11:00 12:00 13:00 14:00 15:00 16:00 Tid -5 0 5 10 15 20 25 t( C) ABS11 GAP11 GAÖ11 10:00 11:00 12:00 13:00 14:00 15:00 16:00 Tid 0 10 20 30 40 50 60 70 80 90 100 t( C) ABS11 GAP11 GAÖ11 Time Time
www.vti.se vti@vti.se
VTI är ett oberoende och internationellt framstående forskningsinstitut som arbetar med forskning och utveckling inom transportsektorn. Vi arbetar med samtliga trafikslag och kärnkompetensen finns inom områdena säkerhet, ekonomi, miljö, trafik- och transportanalys, beteende och samspel mellan människa-fordon-transportsystem samt inom vägkonstruktion, drift och underhåll. VTI är världsledande inom ett flertal områden, till exempel simulatorteknik. VTI har tjänster som sträcker sig från förstudier, oberoende kvalificerade utredningar och expertutlåtanden till projektledning samt forskning och utveckling. Vår tekniska utrustning består bland annat av körsimulatorer för väg- och järnvägstrafik, väglaboratorium, däckprovnings-anläggning, krockbanor och mycket mer. Vi kan även erbjuda ett brett utbud av kurser och seminarier inom transportområdet.
VTI is an independent, internationally outstanding research institute which is engaged on research and development in the transport sector. Our work covers all modes, and our core competence is in the fields of safety, economy, environment, traffic and transport analysis, behaviour and the man-vehicle-transport system interaction, and in road design, operation and maintenance. VTI is a world leader in several areas, for instance in simulator technology. VTI provides services ranging from preliminary studies, highlevel independent investigations and expert statements to project management, research and development. Our technical equipment includes driving simulators for road and rail traffic, a road laboratory, a tyre testing facility, crash tracks and a lot more. We can also offer a broad selection of courses and seminars in the field of transport.
HUVUDKONTOR/HEADOFFICE
LINKÖPING BORLÄNGE STOCKHOLM GÖTEBORG
POST/MAIL SE-581 95 LINKÖPING POST/MAIL BOX 920 POST/MAIL BOX 55685 POST/MAIL BOX 8072
TEL +46(0)13 20 40 00 SE-781 29 BORLÄNGE SE-102 15 STOCKHOLM SE-402 78 GÖTEBORG