QUALITATIVE STATISTICAL ANALYSIS OF SIMULATED DATA
FROM A PILOT SCALE MILL
JOHANNA ALATALO*,† AND BERTIL I. PÅLSSON†
*
Research & Development LKAB
SE-971 28 Luleå, Sweden
e-mail: johanna.alatalo@lkab.com , www.lkab.com
*
,† Division of Sustainable Process Engineering Luleå University of Techonlogy
SE-971 87 Luleå, Sweden
e-mail: johanna.alatalo@ltu.se, www.ltu.se
e-mail: bertil.palsson@ltu.se, www.ltu.se
Key words: Comminution, tumbling mills, DEM, statistical analysis
Abstract. Grinding is the process of reducing a particle size distribution of an extracted ore
and is commonly performed in a tumbling mill. It is a complex procedure and there is a lack of knowledge of what really happens inside the mill.
A number of pilot-scale experiments were done at LKAB's pilot plant at Malmberget, Sweden [1]. In this particular pilot mill, a continuous charge measurement system is installed in one of the lifters and it gives a deflection signal produced by the mill charge. From this signal it is possible to detect features correlated to the settings of the mill. Large, real experiments are very difficult to control and are of course, very costly and time consuming.
A 10 cm slice of the mill was simulated with discrete element method (DEM) for different mill operating conditions. From the simulations a deflection signal was extracted and validated against real data. There is a difference in the signal, mainly due to the lack of slurry in the simulations, but the behaviour when the mills operating conditions changes seems to be the same in both the simulated and the measured signals.
To analyse the data from the simulation a statistical analysis on a full factorial design was done. Two levels of degree of filling of the mill, two different rotational speeds, two levels of friction and different types of particles were selected as factors. The response data are two angles: toe and shoulder angle. The toe angle is when the lifter hits the charge and the shoulder angle is when the lifter leaves the charge.
The analysis show that the toe angle increases when the degree of filling is low and the rotational speed is high. It is also clear that the particle shape influences the charge behaviour. The simulated changes correspond to changes detected in pilot mill runs. This is important since it validates the DEM model.
one factor can be isolated and changed while the others are kept at constant values, which in turn creates the possibility to investigate one factor at a time. In real experiments, the factors are more dependent on each other and there is a very high disturbance from noise.
1 INTRODUCTION
In the North of Sweden, LKAB (Loussavaara Kirunaavaara AB) mines iron ore and produces upgraded iron ore products for the steel industry. To provide this, the particle size distribution of the extracted ore (mainly magnetite) needs to be decreased and this is done by grinding in tumbling mills in the concentrating plant. Comminution is a complex procedure; but still, it is necessary that the final product from the concentrator meet the required targets for iron content and the specified amount of fine material < 45 µm.
The product from the tumbling mill depends on size fraction of the feed material, the quality and the mineralogy of the ore. It is normally controlled by charge type, rotational speed of the mill, degree of filling inside the mill and the feed rate to the mill. The charge type can be the ore itself – so called autogenous grinding, pebbles – a selected size fraction of the ore or gangue, or manufactured media, usually steel rods or spheres (balls). However, it is difficult to control the product since the natural variation of the ore means that there is a varying optimal setting for the mill.
To be able to have control of the product, it is important to understand the grinding process. This is best done by experimental work, however they are not only difficult to control but also both costly and time consuming and therefore the number of experiments will necessarily be limited. Simulations are easily done of the mill and many different settings for the mill can be tested. This means that simulations offer a great possibility to increase the knowledge of what actually is occurring inside the mill. However, it is crucial that the simulations are verified against real process data to be trusted.
In order to get process data, experimental work has to be done and it is also necessary to have results to compare the simulations with. LKAB did experiments with a steel ball charge at their pilot plant in Malmberget, Sweden [1], and the same mill has also been used for experiments with a magnetite pebbles charge [2].The pilot mill has an in-mill sensor installed that measures the deflection of a lifter. It is a continuous charge measurement (CCM) system provided by Metso Minerals. The sensor systems register the deflection of the lifter caused by the mill charge load on the lifter. From the signal it is possible to detect features that may be correlated to the settings of the mill. This curve can also be used to verify the experienced force on a simulated lifter. It is important to note, that the aim of the simulations are not to match the deflection curves to real experiments, since only the grinding media and no slurry or feed material is simulated, but to see if the response to changes is the same for both simulations and experiments. Thereby, verifying the simulations and also being able to investigate how other changes of variables effect the deflection of the lifter.
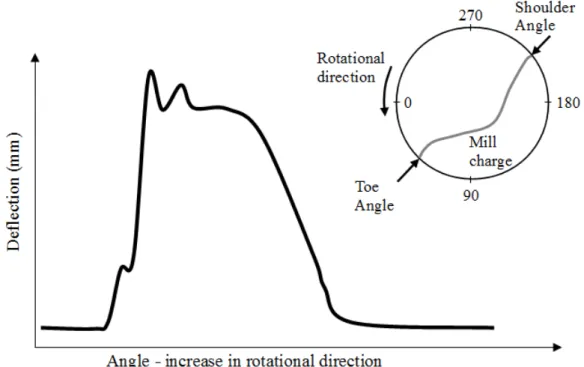
Figure 1: A simplified view of the mill with toe and shoulder angles and the resulting deflection curve of one
revolution. The height of the signal corresponds to the amount of deflection as the lifter passes through the charge.
2 VERIFICATION OF SIMULATIONS WITH EXPERIMENTAL RESULTS
Experiments were done at LKAB and the results have been used to verify simulations. The first set of experiments with a steel charge show that there is a difference in the deflection, especially in the toe angle. Again, one major difference to the real experiments is the presence of slurry in the mill. The results show that the toe angle is lower and that the width of the deflection signal is not the same. The smaller width means that the charge is more compact in the simulations. It has been shown that three dimensional simulations are preferable over simulations in two dimensions. [3]
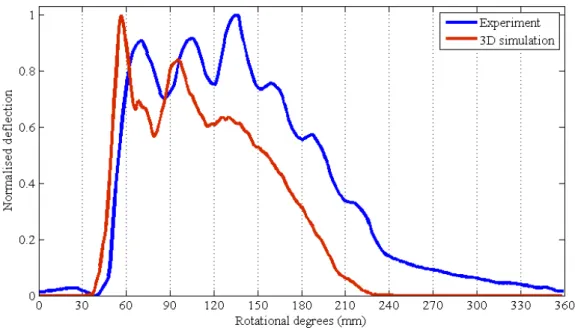
Comparison of deflection curves from experiments with a magnetite pebbles charge also has a discrepancy in the toe angle and width, consistent with the previous results with a steel charge. However, the simulations pick up the behavioural changes, such as an increased width when the degree of filling in the mill is increased.
Figure 2: Comparison of deflection curves of the simulated magnetite pebbles and experimental results.
The simulation results can not be used for predicting product results from the mill yet, but can at least be used to increase the knowledge of the events inside mill
3 SIMULATIONS
A 10 cm slice of the pilot mill with periodic boundaries was simulated with discrete element method (DEM) for different mill operating conditions. A full factorial test were done with two level of degree of filling, two different rotational speeds, two levels of friction, two different densities and two different shapes of the charge media; spheres or ellipsoids. The shape of the charge media is chosen to replicate the steel ball charge from the first set of experiments and the magnetite pebbles from the second set of experiments. The responses are the toe and shoulder angle in degrees. The test set-up can be seen in table 1. The simulations were done in a randomized order.
Table 1: The test set-up with factor levels
Factor Low High
A Degree of filling 25 % 45 %
B % of critical speed 73 % 78 %
C Friction 0.5 0.8
D Density 5200 kg/m3 7800 kg/m3
The low and high level, 25 and 45 %, of degree of filling are common levels in conventional milling. The rotational speed are given as percentage of critical speed, the lowest speed possible to make a particle stick to the mill wall throughout the whole revolution, and the chosen speeds were used for the first the set of experimental work. The low and high levels of friction are chosen for steel on steel (0.8) and a lower value (0.5) to simulate a more slippery charge. The low and high value for the density is chosen to resemble the density of magnetite pebbles and steel balls, respectively. The shape is also chosen to resemble the steel balls and magnetite pebbles.
The three-dimensional simulations done are performed in EDEM [4] developed by DEM Solutions Ltd. The simulations have run for a number of revolutions and then averaged to decrease the influence of noise. A 20 second simulation of the mill takes approximately 8 hours to run.
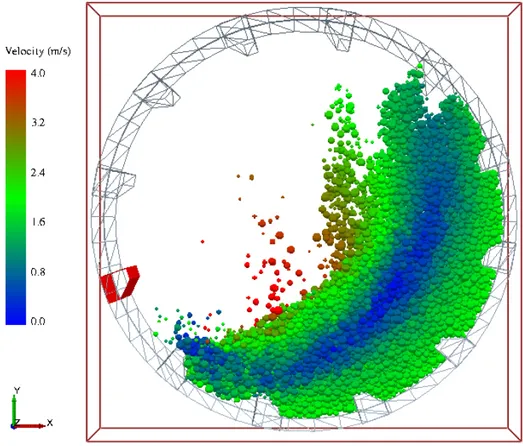
Figure 3: A simulated slice of the mill, where the individual particles are coloured by its absolute speed. 4 RESULTS AND DISCUSSIONS
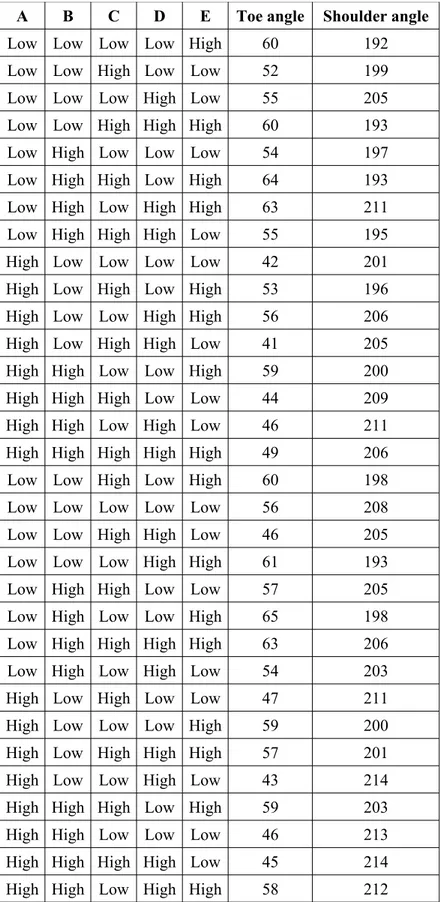
Toe and shoulder angles have been collected from each simulation, see table 2, and analysed with the aid of a statistical programme, Modde by Umetrics AB [5].
Table 2: Factorial levels and resulting responses from the simulations.
A B C D E Toe angle Shoulder angle
Low Low Low Low High 60 192
Low Low High Low Low 52 199
Low Low Low High Low 55 205
Low Low High High High 60 193
Low High Low Low Low 54 197
Low High High Low High 64 193
Low High Low High High 63 211
Low High High High Low 55 195
High Low Low Low Low 42 201
High Low High Low High 53 196
High Low Low High High 56 206
High Low High High Low 41 205
High High Low Low High 59 200
High High High Low Low 44 209
High High Low High Low 46 211
High High High High High 49 206
Low Low High Low High 60 198
Low Low Low Low Low 56 208
Low Low High High Low 46 205
Low Low Low High High 61 193
Low High High Low Low 57 205
Low High Low Low High 65 198
Low High High High High 63 206
Low High Low High Low 54 203
High Low High Low Low 47 211
High Low Low Low High 59 200
High Low High High High 57 201
High Low Low High Low 43 214
High High High Low High 59 203
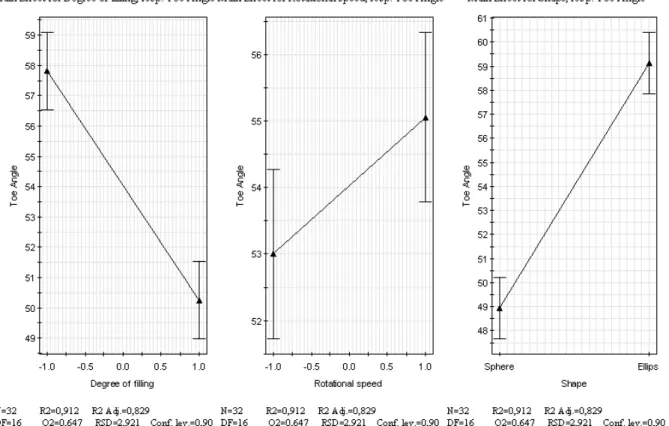
The analysis shows that the toe angle is influenced by degree of filling, the rotational speed and the shape of the particles. There is also a slight interaction effect from degree of filling and the shape of particles, where the toe angle is affected more for a change in degree of filling when the particles are spherical than for ellipsoidal particles.
The main effects on the toe angles can be seen in figure 4. An increase in degree of filling causes the toe angle to decrease, which is anticipated since there simply is more material inside the mill. An increase in rotational speed will cause an increase in toe angle. An ellipsoidal shape will give a large increase for the toe angle compared to a spherical shape. This is a very interesting result since it means that the shape of the particle influence the movements of the charge.
Figure 4: The main effect on the toe angle by the degree of filling, the rotational speed and the shape of
particles. N is the number of experimental runs, DF is the degree of freedom of the residuals, R2 – percent of variation of the response explained by the model, Q2 – the percent of the response predicted by the model according to cross validation, R2 Adj – R2 adjusted for degrees of freedom, RSD – residual standard deviation
and Conf.lev. – confidence level.
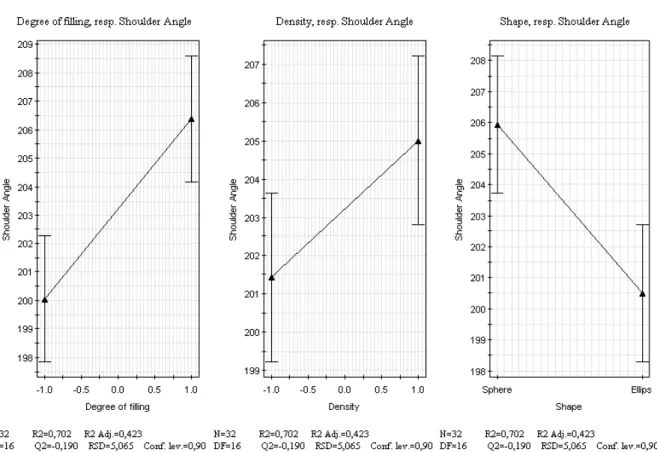
The main effect on the shoulder angle is the degree of filling, the density and the shape of the particles, which can be seen in figure 5. An increase in degree of filling will cause an increase in shoulder angle, which is anticipated due to more material in the mill. An increase in the density causes an increase in shoulder angle. An ellipsoidal shape will give a smaller shoulder angle.
Figure 5: The main effect on the shoulder angle by the degree of filling, the density of particles and the
shape of particles.
A high rotational speed will give a higher toe angle, this means that the charge has climbed higher in the mill and this result also correspond to the real deflection curves from the mill.
A high degree of filling gives a lower toe angle and a higher shoulder angle, this is anticipated since there simply is more material inside the mill and it corresponds very well with experimental results.
A high density will give a larger shoulder angle and this might be because the effect of each particle on the lifter is larger and is detected for a longer time.
A charge consisting of ellipsoidal particles will have a higher toe angle and a lower shoulder angle, this indicates a more compact charge than for the spheres. This is a very interesting result since it means that the shape of the particles is important for the dynamics in the charge.
5 CONCLUSIONS
The analysis show that the changes in toe angle correspond to changes detected in pilot mill runs. This is very important, since this also is a validation of the DEM model. It is also an indication that the material properties are important to get correctly.
investigate operational changes for a mill. In a real experiment it is very difficult, if not impossible, to change the level of only one variable to detect the changes in the response, since the factors are more dependent on each other and there is a very high disturbance from experimental noise. This can be done in the simulations, where one parameter can be changed meanwhile the others are kept constant.
REFERENCES
[1] Tano, K., 2005, "Continuous Monitoring of Mineral Processes with Special Focus on Tumbling Mills – A Multivariate Approach", Doctoral Thesis 2005:05, Luleå University of Technology, Sweden.
[2] Alatalo, J., 2011, “Charge Dynamics in Tumbling Mills – Simulation and Measurements with an In-Mill Sensor”, Licentiate Thesis, Luleå University of Technology, Sweden. ISBN: 978-91-7439-258-6.
[3] Alatalo J., Pålsson B. and Tano K., 2010. Comparing Experimental Measurements of Mill Lifter Deflections with 2D and 3D DEM Predictions. In: Discrete Element Methods, Simulations of Discontinua: Theory and Applications. Queen Mary, University of London, pp. 194-198. ISBN: 978-0-9551179-8-5.
[4] DEM Solutions Ltd, 2010. EDEM, version 2.3.0. www.dem-solutions.com