Ventilation systems in Volvo
Cars Body Components
Aenas Al-Attar
Siddharth Balakrishnan
Department of Mechanical EngineeringBlekinge Institute of Technology Karlskrona, Sweden
2004
Thesis submitted for completion of Master of Science in Mechanical Engineering with emphasis on Structural Mechanics at the Department of Mechanical Engineering, Blekinge Institute of Technology, Karlskrona, Sweden.
Abstract:
In this Master thesis work two types of ventilation system, mixed system and displacement system at the factory premises of Volvo Cars Body Components (VCBC) are investigated. A computer simulation technique was implemented to study the behavior of air movement and temperature distribution inside the factory for the two systems. The commercial CFD program Flovent is used for simulation purpose. Model verification was carried out with the measurements made. Results showed quite good agreement between these two values. The current model has then been used to predict the temperature distributions and air flow movement for different climate scenarios. Energy calculations were also made in order to find out the energy used by two systems annually. The results from the simulations showed that the displacement system gave better performance in every case in thermal comfort aspect, whereas in the energy aspect it was found that the displacement system used more energy annually compared to mixed system.
Acknowledgements
This Master thesis work was carried out at the Volvo Cars Body Components (VCBC), Olofström, Sweden, under the supervision of Mr. Bertil Åberg and at Blekinge Tekniska Högskolan, Karlskrona, Sweden under the supervision of Docent Claes Hedberg.
We would like to express our sincere gratitude to Mr.Bertil Åberg for his complete support and assistance throughout this thesis work. Our special thanks for his observation and comments which helped us in establishing the overall direction of this project and move forward with investigation in depth. Our sincere appreciation to Docent Claes Hedberg for his guidance in this work. We appreciate Ms.Catherina Cornmark, Human Resources, VCBC for giving us an opportunity to carry out this work at VCBC and also for her help to interview the workers in the factory.
We are grateful to Mr.Birger Tholén, Mr.Bertil Magnusson of Celero
Support for their valuable tips and advice. We thank Mr.Markku Palola of Stifab Farex for providing us the software and for the fruitful discussions we made with him. Our special thanks to Docent Dennis Johansson of Stifab Farex for his critical comments and suggestions throughout this work. We greatly appreciate Mr.Fredrik Bergner of Flomerics for sharing his knowledge which influenced this work.
Finally we thank all the employees in VCBC and Celero Support for their valuable information in this work and anybody we missed who deserves a mention.
Karlskrona, March 2004
Siddharth Balakrishnan Aenas Al-Attar
Summary
The basic idea behind industrial ventilation is to remove the contaminants in the occupied space to secure a comfortable environment by supplying fresh air. This Master Thesis work focuses on evaluating the performance of two types of ventilation systems, mixed ventilation and displacement ventilation at the working premises of Volvo Cars Body Components (VCBC). The press hall in the upper factory of VCBC is used as the object of study. Since equipments in the factory operates with very high power there was much heat produced in the occupied zone. For example, during summer when the intake air is above 23°C combined with the heat from the equipments it can lead to a situation where the temperature in the occupied zone would be above 27°C. A thorough investigation was carried out on technical aspects of the two systems as well as a small questionnaire was conducted with various employees in the factory. The work includes implementation of a computer simulation technique to study the behavior of air movement and temperature distribution inside the factory for the two systems. The commercial CFD program Flovent is used for simulation purpose.
Measurements were also carried out as a part of the work. Symmetry settings are used for the numerical model. Model verification was carried out with the measurements made. Results showed quite good agreement between these two values. The current model has then been used to predict the temperature distributions and air flow movement for different situations. This includes: Winter and summer cases, for both the systems. Since all the scenarios are for the same input settings (e.g.: Air flow rate, Ambience, heat sources) it is possible to make a comparison of the two systems. Energy calculations were also made in order to find out the energy used by two systems annually. The results from the simulations showed that the displacement ventilation gave better performance in every case in thermal comfort aspect, whereas in the energy aspect it was found that more energy was used by the displacement ventilation annually compared to mixed ventilation.
Contents
1 Notation 6
2 Introduction 8
3 Purpose and aim of the study 10
4 Methodology 11
5 Ventilation 13
5.1 Purpose and function 13
5.2 Definition 13
5.3 Principles 13
5.4 Mixing ventilation 14
5.5 Displacement ventilation 15
5.6 Short circuiting flow 16
6 Industrial ventilation 17
6.1 General requirements 17
6.2 Quality of air supplied to a building. 17
6.2.1 Ventilation 17
6.2.2 Air change 18
6.2.3 Air Velocity 18
6.2.4 Temperature 18
7 Background 20
7.1 Volvo Cars Body Components 20
7.2 Press hall in the upper factory of VCBC 20
7.3 Ventilation system in the press hall 23
8 Computational Fluid ynamics 26
8.1 Introduction 26
8.2 Finite volume method 27
9 Measurements 28
9.1 Angle measurements displacement ventilation 28 9.1.1 Angle settings for displacement ventilation in Flovent 29
10 Numerical model 41
10.1 Complexity of the computational domain 41
10.1.1 Cartesian co-ordinate system 43
10.2 Physical Boundary conditions 44
10.2.1 Symmetry settings 44
10.2.2 Walls 44
10.2.3 Inflow in mixed ventilation 44
10.2.4 Grid constrain and localizing on fixed flow for mixed
ventilation 45 10.2.5 Inflow in displacement ventilation 45
10.2.6 Grid constraining and localizing on fixed flow for
displacement ventilation. 46
10.2.7 Outlet flow 46
10.3 Geometric modelling 47
11 Result analysis 48
11.1 Simulation for winter scenario 48
11.1.1 Case I: Winter scenario for displacement ventilation in line
31and 32 48
11.1.1 Case II: Winter scenario for mixed ventilation in line 35
and 36 50
11.2 Model verification for displacement system 53
11.3 Model verification for mixed system 54
11.4 Simulation for summer scenario 57
11.4.1 Case II: Summer scenario for displacement ventilation in
line 31 and line 32. 58
11.4.2 Case II: Summer scenario for mixed ventilation in line 35
and line 36. 61
11.4.3 Case III: Summer scenario for displacement ventilation in
line 35 and line 36. 65
11.4.4 Case IV: 68
11.4.5 Case V: 70
11.5 Results from interview 73
12 Energy calculations 75
13 Conclusion 82
1 Notation
I Current
N Number of hours
P Active power
Q Air flow rate T Temperature U Voltage v Velocity
W Work done
β Air flow angle
η Efficiency
ρ Density
Cp Specific heat t
∆ Temperature difference
XoN Component in X- direction YoN Component in Y-direction ZoN Component in Z-direction
Indices
out Outdoor
ex Exhaust
Abbreviations
BTH Blekinge Tekniska Högskolan CFD Computational Fluid Dynamics DA Mechanical Double Action Presses IAQ Indoor Air Quality
SA Mechanical Single Action Presses VCBC Volvo Cars Body Components VCC Volvo Cars Corporation
2 Introduction
The purpose of ventilation in occupied spaces is to supply fresh air and to remove contaminants to secure a comfortable indoor environment, with of course, consideration of low energy consumption. One important aim of ventilation is to remove contaminants as quickly as possible. However; the air ventilation is constrained by factors of occupant comfort, eg.minimum draught and noise. In this Master thesis work two different types of ventilation systems, mixed ventilation and displacement ventilation in VCBC, Olofström is investigated. The occupants in the working premises had complaints of high temperature as well as draught during different climatic condition. The basic idea behind the mixing ventilation principle is to obtain a complete mixing of room air and a dilution of the released contaminants in such a way that a low and even contaminant distribution is achieved in the room. Where as in displacement ventilation conditioned air is supplied from a low side wall diffuser. In this case the supply air spreads over the floor and then rises along heated plumes set up by heat sources in the room. These heat sources create upward convective flows in the form of thermal plumes and bring contaminants from lower zone to higher zone. Figure 2.1 and 2.2 shows the displacement diffuser and mixed diffuser used in VCBC.
According to many researchers displacement ventilation generally provides better indoor air quality [1]. Xiaoxiong Yuan, Qingyan Chen and Leon [1] validates that displacement ventilation provides an acceptable comfort level from their model developed from a database of 56 displacement ventilation conditions from a validated CFD program. The 56 cases covered 4 different types of buildings: small offices, large offices, class rooms, and industrial workshops. The balance between the momentum in the supply air and buoyancy forces due to heat sources is important for effective displacement ventilation [2]. In low momentum displacement flow, the buoyancy forces created by heat sources have a tendency to take over and thus often causing poor ventilation efficiency in some zones of the room [4]. Per Heiselberg's [3] laboratory measurements for mixing ventilation showed that the air flow pattern was strongly dependent on the Reynolds number at low air change rates, that complete mixing was difficult to achieve, and that unfavorable conditions might results in quite large gradients in the distribution of contaminants and large differences in the local mean age of air as well. T.Karimipanah and H.B.Awbi [2] suggest traditional mixing system have poor ventilation efficiency and are less energy efficient even though they still occupy a large portion of market.
3 Purpose and aim of the study
The main purpose of this work is to investigate and evaluate the performance of two types of ventilations system, displacement and mixed ventilation at the working premises of VCBC. The employees working under both the system were experiencing higher temperature and draft in the breathing zone in different weather. Therefore it was important to find a system which can suits all kinds of weathers in the factory.
When comparing these two systems it was also important to consider the evaluations criteria like,
• Thermal comfort • Indoor air quality • Energy use
On the other hand it should be worth in the economic aspects too if it’s required to change from one system to the other. In this case it is always useful if there is a prior knowledge about the air movement and temperature distribution in the factory before the installation of a new system or changing from one system to the other.
In this work a CFD model is created for both displacement as well as mixed ventilation in VCBC factory and is simulated to study the behavior of temperature and air flow for summer and winter conditions. The main aim of using a CFD model is its ability to provide useful information for installing a new system or changing one system to the other. Nielsen [5] used numerical simulation to characterize the flow properties in a ventilated model room and the research concluded that numerical results could guide the design of ventilation. I. Ping Chung, Derek [6] concluded in their work that using numerical simulation, much more detailed information regarding the flow field and contaminant transport is available to characterize the ventilation effectiveness.
4 Methodology
The main evaluation methods adopted for this work are as follows.
A thorough investigation is made on the two types of ventilations in the factory, its working principles at different climatic conditions is also studied. Literature surveys as well as some fruitful discussions with ventilation engineers were also made. A small questionnaire section was conducted with various employees at the working premises of the factory. Final part is to create a numerical model and simulate the two systems for different scenarios. There are several methods to study the complex problems encountered in the wide field of industrial ventilation, the most common being the acceptability of air flow and temperature related to a new system or rebuilt system. Traditional methods of investigation such as filling with smoke or making gas concentration measurements typically using laughing gas, is not always possible or desired. In this work a computer simulation technique has been used which can also predict air movements and distributions of temperature and concentrations in indoor environment. There are many limitations in conducting a full-scale test or a visualizing technique for the same purpose. Since parametric variations and optimizations are important in this work, simulation is a cheaper and quicker way than any other techniques. Also the large dimensions of the factory almost make impossible to conduct a full-scale test even though the accuracy is more in a full scale test than simulation method.
In order to have a more realistic approach from a simulation it’s obvious to have real time measurements. This measurement helps in numerical model verification which is then used in predicting the temperature distribution and air movement for different scenarios. The temperature measurements and velocity measurements are performed in the factory for this purpose. A smoke test was made in order to visualize the air flow. Heat effect from various heat sources like press motor, lighting, people, and electric cabinets are also collected from the relying persons. Velocity and temperature measurements are made manually. A vane anemometer has been used to measure the velocity and an ordinary thermometer for the temperature measurements.
The CFD software Flovent is used for the simulation purpose in this work. Flovent uses Computational Fluid dynamics techniques to predict the air flow, heat transfer and contamination control within rooms or buildings. The complex effects of viscosity, buoyancy and turbulence are properly represented so that a detailed and accurate picture of both the air-distribution and the consequent heat-transfer process can be obtained from this program.
5 Ventilation
5.1 Purpose and function
Ventilation is normally used to diminish or preferably to prevent exposure to contaminants including heating. This includes protection of persons, products etc from hazardous or nuisance contaminants.
It is also important to create a room climate without draught problems and only slight temperature changes in the occupied zone and at the same time to removing pollution as quickly and efficiently as possible from the ventilated room.
5.2 Definition
Ventilation is nothing but ensuring adequate supply of air for human occupation of a building. Ventilation can be provided by natural means, natural with mechanical assistance or wholly mechanical. Its main purpose is to provide air at comfortable temperature and humidity levels, free of harmful concentrations of air pollutants. These are usually intended to be at the breathing zone of occupants.
5.3 Principles
There are two main principles when ventilating a room. • Mixing ventilation.
5.4 Mixing ventilation
The basic principle behind mixing ventilation is to obtain a complete mixing of the room air and a dilution of the released contaminants in such a way that a low and even contaminant distribution is achieved in the room. It follows that the temperature difference is negligible throughout the room and is therefore an advantage in terms of comfort. In this case supply air is normally supplied at ceiling level or alternatively under a window at a relatively high velocity. To achieve draught-free conditions, a careful choice of supply air terminal is required. A simple model of the working of mixing ventilation is shown in figure 5.1.
5.5 Displacement ventilation
In this type of ventilation air is supplied with temperature slightly lower than the room temperature usually at the floor level. The supply air velocity is very low and no significant mixing of the room air with supply air is aimed at in this case. This supply air spreads across the floor and gradually rises along the heated plumes when it comes in to contact with the heating sources (e.g. people, machines etc.) which creates convections streams. This will form vertical temperature stratification in the room air. These heat sources create upward convective flows in the form of thermal plumes and bring contaminants from the lower zone to the upper zone. The exhaust located at or close to the ceiling extracts the warm and contaminated room air. A simple model of the working of displacement ventilation is shown in the figure 5.2.
5.6 Short circuiting flow
The term short-circuiting is defined as a flow where a large fraction of the supplied air resides a short time without passing the occupied zone [4]
.
The risk of small short circuiting is normally present, for example whenever both supply units and the exhaust units are located at ceiling level, with the supply air temperature equal to room air temperature. If the supply air is warmer than the average room air temperature or when the supply and exhaust are located on opposite sides of the room it will leads to a severe short circuiting. This type of flow should naturally be avoided as much as possible.6 Industrial ventilation
In all ventilation, the conditions of the indoor environment, called indoor air quality (IAQ), and the exposures for the occupants are important. In industrial facilities, the contaminant emission rates may be 10-100 times higher than in non-industrial facilities, but for many contaminants the IAQ levels may be the same [7]. The first priority is to consider this process, but other important issues, such as occupants, energy, environment, and corporate image, must also be considered. Energy is a key issue and is closely associated with the environment. Global environmental issues must be addressed as well where the energy chain from the resources to end users is of vital importance.
6.1 General requirements
Buildings should be designed in such a way that the quality of air, light and water, moisture and temperature conditions, and hygienic conditions, should be satisfactory with respect to public health requirements.
Mandatory provisions and general recommendations according to the Building regulations, BBR, of the Boverket, the Swedish Board of Housing, Building and Planning are as follows:
See [8] for further reading.
6.2 Quality of air supplied to a building.
Buildings shall, with due regard to the quality of the outside air, be designed so that the air which is supplied to the building has a sufficient degree of purity.
6.2.1 Ventilation
The ventilation system of a building shall be designed in such a way that the required quantity of air is supplied to the building and so that the
contaminants from activities, respiration products from persons and airborne emissions from building materials, as well as moisture, bad smells and substances hazardous to health are removed. The effectiveness of ventilation shall be satisfactory.
General recommendation:
The requirement in the mandatory provision regarding ventilation of satisfactory effectiveness is normally complied with if the air exchange efficiency is not less than 40%.
6.2.2 Air change
Rooms shall have continual air change when they are in use. The rate of flow of outside area shall be not less than 0.35l/sec per m² of floor area.
6.2.3 Air Velocity
The supply and extract airflow rates in a room shall be designed so that the ventilation system does not give rise to unpleasant draughts.
General recommendations:
The air velocity in rooms where persons are present other than occasionally should not be higher than 0.15m/sec in the occupied zone during the heating season and not higher than 0.25m/sec at other times.
6.2.4 Temperature
Indoor thermal environment:
Building which contain dwellings, workplaces and similar places where persons are present other than occasionally shall be designed so that a
General recommendation
The requirement of the mandatory provision is complied with if the air buildings is designed so that, at the design outside temperature,
• Calculations show that the lowest temperature limit in the occupied zone will be 18°C in the habitable rooms and workrooms and 20°C in the sanitary accommodations and in institutional premises, and in rooms for children in day nurseries and nursery schools and for elderly in service buildings and similar.
• Calculations show that the differences in directional operative temperature at different points in the occupied zone of the room will not exceed 5K.
• Calculations show that the surface temperature of the floor in the occupied zone of a room will not be less than 16°C and not more than 27°C and
• Calculations shows that the air velocity in the occupied zone of a room will not exceed 0.15m/sec in the occupied zone during the heating season and not higher than 0.25m/sec at other times.(BFS1998:38)
7 Background
7.1 Volvo Cars Body Components
Volvo Cars Body Components (VCBC) is a unit organized within Volvo Cars Manufacturing located in Olofström. It is an integral part of Volvo Car Corporation, owned by Ford Motor Company since 1999 and is the competence center at Volvo Cars Corporation for the forming and joining of automotive body components in metallic materials as well as for the analysis and pre-matching of complete automotive bodies. It delivers car body components, truck cab components and form dies to customer within and outside Volvo.
VCBC has a plant area of 291,314m² and has 2,878 employees in the year 2002. The total number of body-in-white produced here in the year 2002 was 363,000 for both cars and trucks. A short description about the VCBC both for Olofström and Gothenburg is shown in the table 7.1 below.
Table 7.1.Description of VCBC Description Quantity Press-lines 20 Transfer 3D 2 Hydro forming 1 Assembly lines/stations 115 Robots 555
7.2 Press hall in the upper factory of VCBC
of every presses. The total power of all the presses for six lines collected from the concerned electrical engineers of the press hall are shown in the tables 7.2 to 7.6.A two dimensional view of the press hall is shown in the figure 7.1.
Table 7.2. Power for presses in line 31
Line 31 DA SA SA SA
Press No. 100404 102113 102112 102111
Power(kW) 162 148 148 148
Table 7.3. Power for presses in line 32
Line 32 DA SA SA SA SA SA
Press No. 100804 102801 102802 102803 102804 102805
Power(kW) 220 160 160 160 160 160
Table 7.4. Power for presses in line 33
Line 33 DA SA SA SA SA SA
Press No. 100606 102507 102508 102509 102510 102511
Power(kW) 220 160 160 160 160 160
Table 7.5. Power for presses in line 34
Line 34 DA SA SA SA SA
Press No. 100607 102512 102513 102514 102515
Power(kW) 220 160 160 160 160
Table 7.6. Power for presses in line 35
Line 35 SA SA SA SA SA
Press No. 102516 102517 102518 102519 102520
Table 7.7. Power for presses in line 36
Line 36 DA SA SA SA SA SA
Press No. 100805 102806 102807 102808 102809 102810
Power(kW) 220 160 160 160 160 160
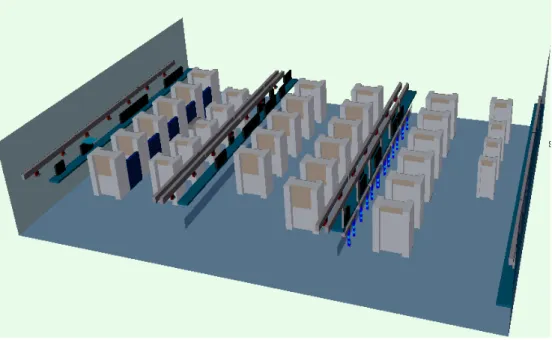
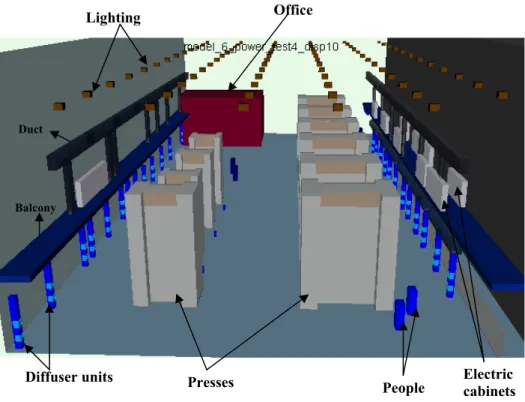
Figure 7.2. Three dimensional view of press hall
There are a total of 36 employees per shift working in the upper factory with six persons for each line. This will vary sometimes depending on the leaves taken by the employees. Normally the people work in the packing area of each line where the finished components are being removed from each line. There may be two or three machine operators on the other end of every line. The finished components once removed from the lines are then transported outside the hall for further work using fork lifts. The electric cabinets meant for controlling the electricity to the presses is located 4m from the floor on a platform after every two press lines. The exhaust fan of the press controls lies between every presses on each line. A three dimensional view of the press hall is shown in the figure 7.2. The main heat sources in the working premises are from the press motors, electric cabinets, people, and heat from the exhaust of press controls.
7.3 Ventilation system in the press hall
The press hall in the upper factory is ventilated by ventilation units that are located on the outer roof. The hall consists of six lines of presses from line 31 to line 36. Line 31 and 32 has displacement ventilation and from line 33 to 36 it consist of mixed ventilation. In the case of displacement ventilation
the supply is a low side wall diffuser situated at the floor level. The diffuser is made of textile with perforated holes in it for the air flow (see figure2.1). There are totally 28 diffusers in line 31 and 32 with 14 units on each side of press lines. In this case the air leaves the supply at the floor level at a very low velocity and the air flow rate is approximately 50,000m³/h per unit. For mixed ventilation the incoming air flow rate is approximately 50,000m³/h per unit and the air reaches the factory through the diffusers via air ducts that are placed above the electric cabinets on the platforms by the construction pillars after every two lines. Incoming air is aimed diagonally down towards the center line between each press lines in the case of mixed ventilation. The air velocity is high in this case in order to achieve a complete mixing of the room air with the released heat from the presses and other heat equipments in the factory.
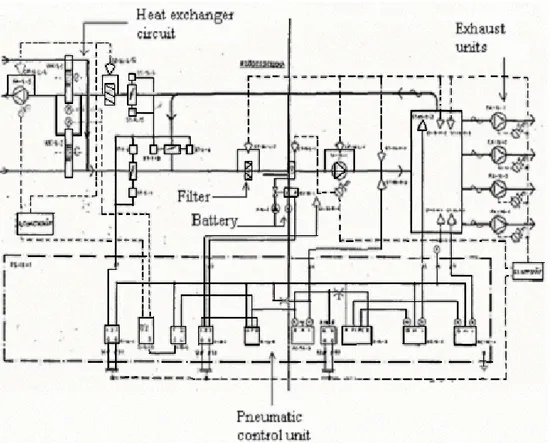
During winter the exhaust air is sucked out at the roof via heat exchanger which was installed in the middle of 80's which is docked to the incoming air ventilation unit. During summer the exhaust air flow rate is increased by starting up the exhaust fans located on the ceiling. The main purpose of increasing the air flow rate is to have more air change rate during summer time. Incoming air ventilation unit and its control and regulating systems are from the beginning of 70's when the factory was built. The regulating system is pneumatic controlled for which it is difficult to get any spare parts any more. A circuit diagram for the ventilation unit is shown in the figure 7.3. Due to the certain air leakage in every incoming air ventilation unit it has been established that the supply air temperature is always blown in to the building with a higher temperature than the temperature achieved by a wholly tight ventilation units. During summer time, the heat exchanger is shut down with the help of valves and the exhaust fans are started to sucks out the air. If it happens to miss to open one of these valves when the autumn starts the risk would be that the heating battery may freeze and burst causing water leakage in to the building.
8 Computational fluid dynamics
8.1 Introduction
CFD (computational fluid dynamics) is the analysis of systems involving fluid flow, heat transfer and associated phenomena such as chemical reactions by means of computer based simulations. The technique is very powerful and spans a wide range of application areas. Aerodynamics of aircraft and vehicles, hydrodynamics of ships, turbo machinery, and industrial ventilation are few examples.
Few unique advantages of CFD over experiment based approaches are: • Substantial reduction of lead times and costs of new design.
• Ability to study systems where controlled experiments are difficult or impossible to perform.
• Ability to study systems under hazardous conditions at and beyond their normal performance limits.
• Practically unlimited level of detail of results.
It’s a very promising tool, when it comes to ventilation and can be very helpful for analysis and design in industrial ventilation. It is suited for all types of problems where knowledge of a spatial distribution of flow quantities is required, i.e., where local values at several locations are required. The flow quantities may include air velocity, temperature, or contaminant concentrations such as smoke, carbon-dioxide or toxic gases. The main two key features of CFD are availability of local quantities and a minimal number of assumptions made. As a result have the following advantages over the other methods.
• Detailed analysis is possible.
8.2 Finite volume method
There are three distinct streams of numerical solution techniques: finite difference method, finite element method and spectral method [9].Numerical methods that forms the basis of solver perform the following steps.
• Approximation of the unknown flow variables by means of simple functions.
• Discretisation by substitution of the approximations in to the governing flow equations and subsequent mathematical manipulations.
• Finding a solution of the algebraic equations which satisfies the boundary conditions by an iterative procedure
Usually the equations are discretised in what is known as finite volume method a most well-established and thoroughly validated general purpose CFD technique which was originally developed as spectral finite difference formulation. A finite element method can also be used in this process. This is important when the solution domains are of complicated shapes.
The numerical algorithm for a finite volume method consist of,
• Formal integration of the governing equations of the fluid over all the (finite) control volumes of the solution domain.
• Discretisation involves the substitution of a variety of finite-difference-type approximations for the terms in the integrated equation representing flow process such as convection, diffusion and sources. This converts the integral equations in to a system of algebraic equations.
• Solution of the algebraic equations by an iterative method.
The control volume integration distinguishes the finite volume method from all other CFD techniques. This statement expresses the conservation of relevant properties for each finite size cell. This clear relationship between the numerical algorithm and underlying physical conservation principle forms one of the main attractions of the finite volume methods and makes its concepts simpler to understand by the engineers than finite element and spectral methods.
9 Measurements
In order to have a more realistic approach from a simulation it’s obvious to have real time measurements. This measurement helps in numerical model verification which is then used in predicting the temperature distribution and air movement for different scenarios. The temperature, velocity and angle measurements are carried out in the press hall of the upper factory in VCBC.
9.1 Angle measurements displacement ventilation
Since the shape of the displacement diffusers are of cylindrical the flow angle was varying for each perforated hole on the diffuser. The angles varied from 0° to 90° in this case. Since the flow direction cannot be adjusted manually the flow angles were constant for all the diffusers. In order to have a simpler numerical model and the difference between the angles for every hole on the diffuser is negligible an approximated angle of 45° is chosen for the angle flow in this case. Also instead of making a cylindrical model a rectangular block model using cuboids is being used in the numerical model in order to avoid the complication in applying grid constraints. Simplified model of displacement diffuser is shown in the figure 9.1. Thus a diffuser had two types of fixed flow one with normal to the plane of the supply in forward direction and sideward direction as well as an angled flow with an angle of 45° in both the sides of the rectangular block.Figure 9.1. Simplified model for displacement diffuser
9.1.1 Angle settings for displacement ventilation in Flovent
In Flovent for the angled flow, i.e. if the flow is inclined to the normal to the plane of supply, the program normalizes to create the resultant flow direction. This can be done by assigning the three components of direction vector which are XoN, YoN and ZoN. Since one flow is normal to the plane of the supply the normal angle settings is used. Angle setting calculation for flow with an angle of 45° is shown below.
Since there is no flow in the y-direction in this case the component YoN is set as zero. The ZoN component is set as 1 in order to find the XoN value. The vector diagram for angle flow in displacement unit is shown in the figure 9.2.
Figure 9.2. Vector diagram for angled flow in displacement diffuser
Here,
Angle α =angle β = 45°. Thus from the figure 9.2;
YoN = 0; ZoN = 1; XoN = tan 45° = -1.
The negative signs shows that flow is in the (– x) direction. These component values are same for all angle flows for 28 diffusers.
9.2 Angle measurements for mixed ventilation
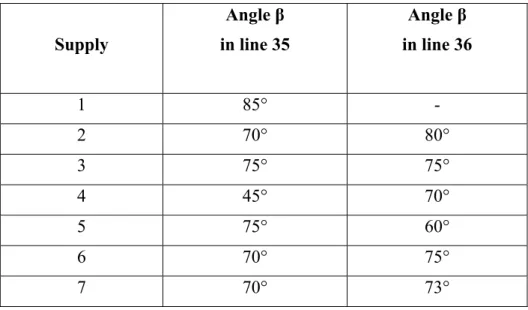
The flow angle measurements was carried out for mixed diffusers in line 35 and line 36.The method adopted to measure the angle was using smoke pistol. The pistol was held at different points nearby the diffuser to visualize the flow direction. It was noticed that flow was heading downwards in all the cases. Since the diffusers can be adjusted manually it was found that the flow angles were varying for many supplies. The angle measurements were made roughly with the help of an ordinary protractor. This was estimated by viewing the smoke direction from the pistol by holding it right beneath the diffusers. Flow angles ß measured with respect
Table 9.1 Measured flow angle in line 35 and line 36 Supply Angle β in line 35 Angle β in line 36 1 85° - 2 70° 80° 3 75° 75° 4 45° 70° 5 75° 60° 6 70° 75° 7 70° 73°
9.2.1 Angle settings for mixed ventilation in Flovent
Since there is no flow in the x-direction the component XoN is set as zero. The component in the z-direction, ZoN is set as 1 as default value in order to calculate the value in the y-direction, YoN. The simple model of the diffuser used in model is shown in the figure 9.3. The vector diagram is shown in the figure 9.4.
The component YoN for supply 2 in line 36 is calculated as follows, XoN=0; ZoN=1;
The angle β is shown in the table 9.1. Angle α can be written as, α = α +10°; α + β = 90°.
β =80°. Thus,
Tan α = YoN from the figure 9.4 Tan 10° =YoN
YoN= -0.1763.
The negative sign here indicates that the flow is in the downward direction (-Y direction).Similarly the YoN values are calculated for all the 14 diffusers. The tables 9.2 and 9.3 show YoN component values for 7 diffusers in line 35 and line 36.
Table 9.2. YoN component values for flow angles in line 35
Supply XoN ZoN YoN
1 0 1 -0.08748 2 0 1 -0.3639 3 0 1 -0.2679 4 0 1 -1 5 0 1 -0.2679 6 0 1 -0.3639 7 0 1 -0.3639
Table 9.3. YoN component values for flow angles in line 36
Supply XoN ZoN YoN
1 0 1 -0.1763 2 0 1 -0.1763 3 0 1 -0.2679 4 0 1 -0.3639 5 0 1 -0.5773 6 0 1 -0.2679 7 0 1 -0.30573
9.3 Temperature measurements
The air temperature was measured at several places closer to diffuser units as well as ventilated space in the factory. The measurements were initially made with the help of a laser pistol. This has been compared with the temperature measured using an ordinary thermometer. It was found that there was a drastic difference between the two measurement techniques. The main reason for it was using a laser pistol it indicated the surface temperatures of diffusers instead of air temperatures. This led to a conclusion that the temperature measured with an ordinary thermometer was more realistic.
In the case of displacement ventilation the metal strip of the thermometer was inserted in to the perforated hole in order to monitor the right temperature. The average air temperature measurements from four sides in the case of displacement ventilation are shown in the table 9.4. Measurements for certain diffusers are not available because they were not functioning while conducting the measurements. This measurement was made on 2003-11-14 at 13:25 P.M when outdoor temperature was
Table 9.4.Temperature measurement for line 31 and line 32 Temperature, T( οC) Supply Line 31 Line 32 1 19.7 - 2 19 - 3 - - 4 19.4 - 5 19.7 18.8 6 19.8 19 7 19.7 19 8 19.5 19.1 9 20 - 10 20 - 11 20.1 19.6 12 19.8 19.8 13 20 19.8 14 20.1 19.9
In the mixed ventilation diffuser, the air temperature was measured right in front of the diffuser at four different points as shown in figure 9.5.
Figure 9.5.Measuring method for supply air temperature
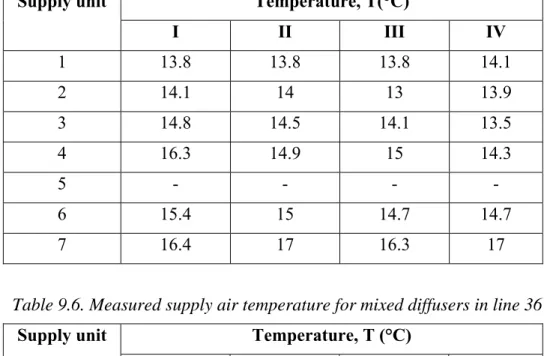
The measured temperature values are shown in the tables 9.5 and 9.6. This measurement was made on 2003-10-27 at 11:00A.M when outdoor temperature was around 4οC.
Table 9.5. Measured supply air temperature for mixed diffusers in line 35 Temperature, T(°C) Supply unit I II III IV 1 13.8 13.8 13.8 14.1 2 14.1 14 13 13.9 3 14.8 14.5 14.1 13.5 4 16.3 14.9 15 14.3 5 - - - - 6 15.4 15 14.7 14.7 7 16.4 17 16.3 17
Table 9.6. Measured supply air temperature for mixed diffusers in line 36
Temperature, T (°C) Supply unit I II III IV 1 - - - - 2 14.3 14.3 13.7 14.3 3 14.7 13.8 14.3 13.9 4 15.5 14.9 14.9 13.9 5 15.1 14.0 13.9 14.1 6 15 14.6 14.7 15.1 7 16 16 15.6 15.6
Since the above measured values were very close the average value was taken to set the ambient temperature for the fixed flow in the numerical
9.4 Velocity measurements
The velocity measurements were made with the help of a modern vane anemometer. In this type of anemometer, an electric sensor records the spindle rotation and the signal is processed, giving the velocity on a digital display. Such an instrument usually is able to integrate the mean velocity over a time interval.
The velocity for displacement ventilation is taken on four sides on each diffuser units. The instrument was placed few distances away from the diffusers in order to get more realistic values. The velocity measured for all 28 displacement diffusers for line 31 and line 32 are shown in the tables 9.7 and 9.8.
Table 9.7.Measured velocity values for line 31
Velocity, v(m/s)
Supply unit I II III IV
1 0.77 0.8 0.6 0.6 2 0.75 0.51 0.51 0.63 3 - - - - 4 0.47 0.6 0.67 - 5 0.49 0.5 0.46 0.44 6 0.46 0.4 0.62 0.48 7 0.59 0.44 0.68 0.57 8 0.49 0.64 0.655 0.39 9 0.44 0.37 0.455 0.49 10 0.48 0.5 0.422 0.55 11 - - - - 12 0.87 0.49 0.87 0.76 13 1.34 1.44 1.2 1.29 14 1.166 1.1 0.98 1.9
Table 9.8.Measured velocity values for line 32
Velocity, v(m/s)
Supply unit I II III IV
1 0.87 0.8 0.91 0.836 2 0.75 0.9 0.81 0.73 3 - - - - 4 - - - - 5 1.123 1.36 1.21 1.9 6 1.7 1.28 1.3 1.6 7 1.355 1.54 1.21 1.53 8 1.48 1.266 1.44 1.5 9 - - - - 10 - - - - 11 0.84 0.92 1.01 0.955 12 1.288 1.188 1.04 1.03 13 1.33 1.244 1.433 1.67 14 1.155 1.36 1.288 1.34 A few measurements are not available in the above table. The main reason for it was some of the diffusers were not functioning during the time of measurements. The mean velocity value for 14 diffusers was taken to calculate the volume flow rate for each diffuser.
Velocity measurements for a mixed ventilation diffuser are made by measuring velocities at four points on each diffuser as shown in figure 9.6.
Figure 9.6.Measuring method for supply air velocity for mixed diffuser unit
This procedure is followed mainly to get a more accurate measurement. The velocities measured on four points for the 14 diffusers for two lines are shown in the tables 9.9 and 9.10.
Table 9.9.Measured velocity values in line 35
Velocity, v(m/sec)
Supply unit I II III IV
1 5.2 5.3 4.3 4.6 2 5.3 5.1 4.9 4.8 3 - - - - 4 4.7 5.1 5.2 - 5 - - - - 6 5.1 5.2 - - 7 5.5 5.6 4.9 4.7
Table 9.10.Measured velocity values in line 36
Velocity, v(m/sec)
Supply unit I II III IV
1 - - - - 2 4.7 - 4.2 10.1 3 4.4 4 5.3 5.1 4 4.8 4.5 5.6 4.2 5 3.7 4.9 5.9 4.4 6 5.2 5.9 5.1 4.9 7 4.6 - 5.2 5.1
10 Numerical model
10.1 Complexity of the computational domain
The CFD software Flovent is used to create the numerical model for both the mixed and displacement ventilation. The press hall in the upper factory is modeled and simulated. The hall dimension is 84 X 64 X 17(length X width X height in meter).Due to large dimensions of the room two lines for both the ventilation systems are modeled. Line 35 and 36 for mixed system and line 31 and 32 for displacement system is been chosen for this purpose. Thus the dimensions for these two lines are 28 X 64 X 17(in meter) each. The number of grid cells used here is around half a million in all the cases. Due to the large room dimensions and other practical constraint like need of more computer time is the main reason for this. The grid cells are unstructured in this case because of the local grid refinement on the supply units, which also add up more time for solving. Radiation is not considered in this model. Figure 10.1 shows lines 31 and 32 and figure 10.2 shows lines 35 and 36.
Figure 10.1.Three dimensional view of line 31 and 32 Office Presses Diffuser units People Duct Balcony Lighting Electric cabinets
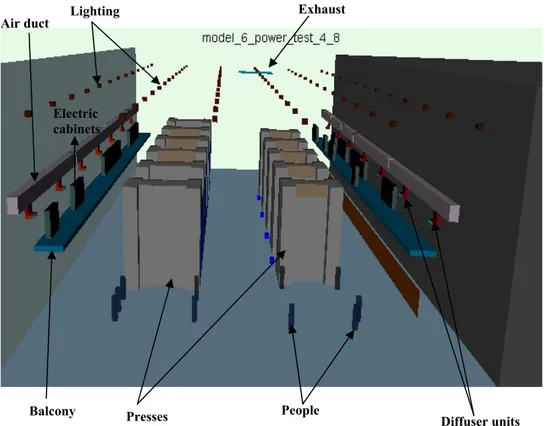
Figure 10.2.Three dimensional view of line 35 and 36
10.1.1 Cartesian co-ordinate system
In Flovent, calculations are mainly based on Cartesian co-ordinate systems. Practical boundary geometries can be complex (velocity near the diffusers in this case) and often irregular and they can only be approximated in Cartesian co-ordinates system by treating surfaces in a stepwise manner. The method has its own certain limitations also, such as cells inside the solid part are blocked while calculating. This has considerable disadvantages since the approximate boundary conditions are tedious to set up and introduce errors. Further disadvantages of this system are wastage of computer resources due to blocking of the cells in the solid region and the introduction of a fine Cartesian grid in one region of particular interest could imply unnecessary refinement in another region of minimal interest. Using a body-fitted grid can overcome these limitations.
Air duct Lighting Exhaust
Balcony Presses
Electric cabinets
People
10.2 Physical Boundary conditions
10.2.1 Symmetry settings
When implementing a symmetry boundary condition the values of all the ventilation parameters just outside the solution domain are equated to their values at the nearest grid cell just inside the domain. Since the heat output from presses was varying in each line the temperature distribution and air movement was not uniform throughout the hall. In fact, for line 35 and 36 symmetry settings can be used on one side between line 34 and 35 because the lines 33 and 34 have almost the same heat output from the presses (see tables 7.2 to 7.7). Also it is the same ventilation system in these four lines with the same flow rate. For this reason symmetry settings is used(the side adjacent to line 36 and line 31 are walls).For line 31 and 32 which consist of displacement ventilation, symmetry is set on the side between line 32 and 33 due to practical constraints, which is mainly the uncertainty in assigning the ambient temperature for an opening settings. The rest of the solution domain which is not of importance is assigned with a cut-out while solving. This will help to avoid calculation of the grid cells in that region.
10.2.2 Walls
As in reality, the enclosure walls in the numerical model exist only on two sides of the hall which are adjacent to the line 31 and line 36.The walls and the roof are insulated in the model. Glass wool is used for insulation. A small partition of height 2m after every two lines is also insulated.
10.2.3 Inflow in mixed ventilation
A fixed flow with an angle is modeled in the mixed ventilation case. The angle settings for diffusers are shown in the tables 9.2 and 9.3 in the previous section of this report. The volume flow rate is assigned to the fixed flow as flow parameter. This was obtained based on the velocities
10.2.4 Grid constrain and localizing on fixed flow for mixed ventilation
For precise modeling the boundary conditions around the supply should be mentioned in a detailed manner. Since the supply unit is very small relative to the large room dimensions in this case it is difficult to achieve this when adaptive grid technique is used, which requires more memory power for the computer. In order to avoid this, grids around the fixed flow is constrained and is localized, i.e. more grid cells are attached to all the fixed flows. This is then localized so that these cells will be limited for these fixed flows. By doing this minor details like air flow velocity, flow angle near the regions of supply are retained at the same time all the grid points can be accommodated in the computer memory. The figure 10.3 shows grid constrains attached to the fixed flow for mixed diffuser.
Figure 10.3.Grid constrain attached to the fixed flow in mixed diffuser
10.2.5 Inflow in displacement ventilation
In displacement ventilation totally 12 fixed flows are used to form one supply which includes 4 of them with an angle of 45°.The diffuser is more simplified in the numerical model. In reality the shape of the diffuser is cylindrical with angles varying for every perforated hole. This is been made in a more simplified way by making a rectangular block instead of cylindrical and the angle was approximated to 45°.Assigning of volume flow rate, ambient temperatures is similar to the mixed ventilation with the help of measurement values (see tables 9.6 and 9.7 in the previous sections).
10.2.6 Grid constraining and localizing on fixed flow for displacement ventilation.
The grid constrains and localization is carried out in displacement ventilation with the help of “box-method" or the "prescribed velocity method"[9]. In this method cuboids on which fixed flows are placed are attached with grid constraint. This is then localized so that this grid constrain is meant only for those cuboids and not to other regions in the solution domain. This grid constraining helps in creating more cells to create an angle flow in this case as well as the right supply velocities are achieved near the supply. The figure 10.4 shows cuboids with grid constraint on it.
Figure 10.4.Grid constrain attached to the fixed flow in displacement diffuser
10.2.7 Outlet flow
The outlet flow in the model is made of fixed flows with normal settings, i.e. with a flow directed outward normal to the plane of the exhaust. The flow rate assigned is equal to the supply flow rate in order to have a balance between the flow rates. During winter time the total exhaust flow rate is assigned as 50,000m³/h same as that of supply flow rate. In this case only one fixed flow used as exhaust. During summer the total exhaust flow rate
10.3 Geometric modelling
The major heat sources in the press hall were the press motor, electric cabinets, lighting, exhaust air from press controls and persons. These objects were modeled in Flovent with the help of rectangular blocks. In fact these blocks contain unused computational grids, which occupies lots of memory space as well as it takes more time for solving the problem. In order to avoid this conjugate heat transfer method [7] is used. This was done by measuring the surface temperatures on the presses and assigning it as ambient in the model. But this approach couldn’t give a more realistic situation. Assigning source (heat output) was another option for it. Since the press motor is on the top part of every press a heat source (in terms of power) is applied in the model using the source option in Flovent. For electric cabinets and press controls an ambience in terms of temperature were set which was measured from the hall. The cabinets were divided in two parts with two ambient settings 26°C and 27°C.Heat from the exhaust fans of press control was assigned with a temperature of 35°C. Lighting was assigned with a thermal property of 400Watts/bulb. Some other sources may be fork lifts used for transporting the body components inside the hall. This is not taken in to consideration in this model.
11 Result analysis
Simulations are carried out for different scenarios for both the ventilation systems. The measurement values are used in order to get more realistic results. Following section gives a detail explanation about the simulation results for different scenarios.
11.1 Simulation for winter scenario
11.1.1 Case I: Winter scenario for displacement ventilation in line 31 and 32
The first case was to simulate the model for real time measurement made in the factory. Initially this is been done for displacement ventilation when the outdoor temperature was around 4°C which is taken as winter scenario in this work. The total heat out put from the presses, lighting, persons are given in the table 11.1.The heat output from electric cabinets is set as 27°C in all the scenarios.
Table11.1.Heat sources and heat output
Heat sources Heat output(kW)
Presses 87 Lighting 31 Persons 1.5 The figure 11.1 and figure 11.2 shows the temperature and velocity plots for displacement ventilation in line 31 and line 32. The temperature plot shows the temperature distribution and velocity plot shows the air flow from the displacement diffusers in these press lines. The total air flow rate in this case was approximately 46,000m³/h which is obtained with the help of velocity measured for each supply units (see tables 9.7 and 9.8). The
Figure 11.1. Temperature plot for displacement ventilation for winter scenario in line 31 and 32
Figure 11.2. Velocity plot for displacement ventilation for winter scenario in line 31 and 32
Figure 11.3. Iso-surface plot for temperature of 20.5°C for displacement ventilation in line 31 and 32
Figure 11.3 shows the iso-surface plot for temperature of 20.5°C for displacement ventilation. It can be found that this temperature is present at the breathing zone in the building.
11.1.1 Case II: Winter scenario for mixed ventilation in line 35 and 36
The same procedure is followed for mixed ventilation. In this case line 35 and 36 is been simulated for the real time measurements. The heat sources and heat output assigned in this case is shown in table 11.2.This is almost same as that of displacement ventilation in line 31 and line 32 except for presses.
Table11.2.Heat sources and heat output
Heat sources Heat output(kW)
Presses 110 Lighting 31 Persons 1.5
The figure 11.4 and figure 11.5 shows the temperature and velocity plot for mixed ventilation in line 35 and line 36.The temperature plot shows the temperature distribution and velocity plot shows the air flow from the mixed diffusers in these press lines. The total air flow rate in this case was approximately 45,000m³/h which is obtained with the help of velocity measured for each supply units (see tables 9.9 and 9.10). The supply temperature is set as 14.5°C which is also obtained from the measured temperature values (see tables 9.5 and 9.6). The velocity plot shows the air flow heading down towards the centre line between two presses from the 7 supply units.
Figure 11.4. Temperature plot for mixed ventilation ventilation for winter scenario in line 35 and 36
Figure 11.5. Velocity plot for mixed ventilation ventilation for winter scenario in line 35 and 36
Figure 11.6 shows the iso-surface plot for temperature of 23°C for mixed ventilation. It can be found that this temperature is present almost at the breathing zone in the building.
11.2 Model verification for displacement system
Model verification was carried out for line 31 and 32 in the case of displacement system by comparing the measured values and the CFD values. The main interests of measurement were temperature in the case of displacement system. The temperature measured for different heights at certain point in the factory is been compared with the temperature values obtained in the CFD model. The measuring points are indicated in the figure 11.7. The temperature gradient comparison between measured values and CFD values is shown in the figure 11.8.Figure 11.7. Measuring points for temperature gradient in displacement system in line 31 and 32
18 20 22 24 26 28 30 32 34 1 6 8 17 Height [meter] Temperature [°c] CFD value Measured value
Figure 11.8 Model verification attempt for temperature gradient in displacement system
In this case the agreement between two values is not satisfactory. The main reason for this could be symmetry settings used in CFD model. In reality this two press lines are adjacent to lines with mixed system. This may create an influence in the air exchange from two systems which will have a major effect on temperature and air flow. Because of the symmetry settings in CFD model it is assumed that all the press lines consist of displacement system. Also the air flow in the factory is not the same due to the opening of doors and gates which is not included in the numerical model.
11.3 Model verification for mixed system
Model verification was conducted for mixed system in line 35 and 36 in a similar way as for displacement system. The main interests of
the figure 11.10. This showed good line fit of CFD values through measured values for temperature.
Figure 11.9. Measuring points for temperature gradient in mixed system in line 35 and 36
20 22 24 26 28 30 1 6 8 17 Height [meter] Temperature [°C ] CFD value Measured value
Figure 11.10. Model verification attempt for temperature gradient in mixed system
The velocity verification has been carried out by measuring the velocities at different points in the working zones. All the points selected for this purpose was at breathing zone at a height of 1.75meter.These were then compared with velocities obtained at the same points in the numerical model. The verification made for velocity values is shown in the figure 11.11. The slight variation in this case may be due to the uncertainty in assigning correct boundary conditions in the numerical model.
0 0.1 0.2 0.3 0.4 0.5 0.6 0.7 0.8 0.9 0 1 2 3Points4 5 6 7 8 Velocity [m/sec] CFD value Measured value
Figure 11.11. Model verification for velocity values in mixed system
11.4 Simulation for summer scenario
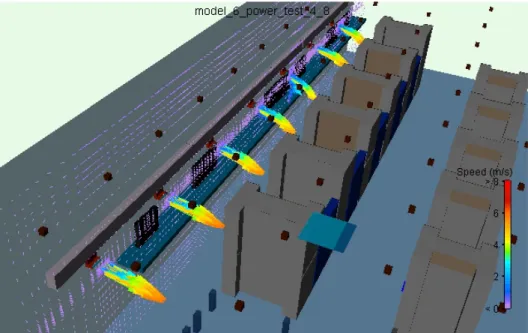
The current model is used for simulating an extreme summer scenario for both the systems. In all the cases the total designed exhaust flow rate is 170,000m³/h for each ventilation unit between two lines. The air is sucked out with the help of five exhausts in the ceiling. The same scenario is simulated in the CFD model by assigning equal flow rate for each exhaust. The heat sources and heat outputs assigned are same as that for winter case (see tables 11.1 and 11.2). Since the heat output from presses are varying for the two systems a scenario with mixed system in line 35 and 36 replaced by displacement system is also simulated in order to have a better comparison.
11.4.1 Case II: Summer scenario for displacement ventilation in line 31 and line 32.
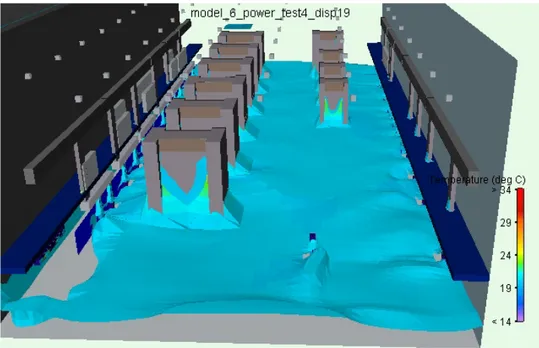
The outdoor temperature is kept as 25°C with a supply temperature of 26°C. The total exhaust flow rate assigned in CFD model is approximately 165,000m³/h. The supply flow rate is same as that of values used in the winter case which is approximately 45,000m³/h. In order to balance the incoming and outgoing flow rate in the model, the remaining incoming flow rate of 120,000m³/h is supplied with the help of fixed flows from both the ends of the hall. The temperature plot for displacement ventilation during summer is shown in figure 11.12. The distribution shows that the temperature at the breathing zone varies between 26°C and 27°C for supply temperature of 26°C.
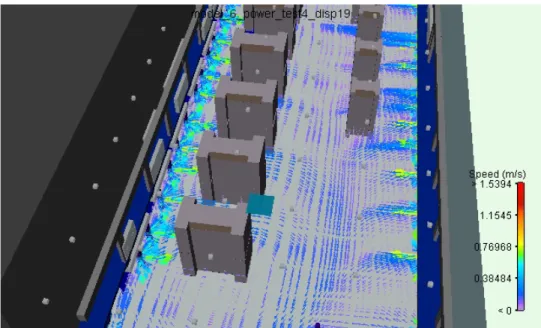
Figure 11.13. Velocity plot for displacement ventilation for summer scenario in line 31 and 32
Figure 11.14. Thermal plumes rising from the presses in displacement ventilation
Figure 11.13 shows the velocity plot for displacement ventilation. The plane shown is at a height of 0.5m from the floor. It shows the air leaves the supply unit in the floor level and spreads through out the breathing zone. Here the velocity is comparatively low compared to the mixed system. This air then lifts upwards when it reaches the heat sources, in this case the presses taking the heat in the upward direction in the form of thermal plumes. Thermal plumes rising from presses in the displacement system is shown in figure 11.14.
The iso-surface plot for temperature of 26.8°C is shown in the figure 11.15 which shows that this temperature is spread all around the breathing zone. The plane plotted for temperature for 28°C as shown in figure 11.16 is present at a height of around 7 meter from the floor level.
Figure 11.15.Iso-surface plot for temperature of 26.8°C for displacement ventilation
Figure 11.16.Iso-surface plot for temperature of 28°C for displacement ventilation
11.4.2 Case II: Summer scenario for mixed ventilation in line 35 and line 36.
The set up for mixed ventilation is same as that of displacement in summer scenario. The only parameter varying in this case is the power from the presses which is less than the case in the mixed system. Figure 11.17 shows the temperature plot showing the temperature distribution. It shows a temperature distribution of 28°C at the floor level and remains the same until a height of 8m from the floor level. This is then gradually increasing for different heights.
The velocity plot is shown in the figure 11.18. This shows the mixing principle with air blowing in to the breathing zone with high velocity. The air is mixed up with the heat released from the press motors causing high turbulence.
Figure 11.17. Temperature plot for mixed ventilation for summer scenario in line 35 and 36
Figure 11.19.Iso-surface plot for temperature of 28°C for mixed ventilation in line 35 and 36
Figure 11.19 shows the iso-surface plot for mixed ventilation during summer with outdoor temperature of 25°C.The plots is for temperature of 28°C. It can be seen that this temperature is present mostly in the floor level, whereas in the case of displacement it was 7 m above the floor level.
24 26 28 30 32 34 1 3 5 7 9 11 13 15 17 Height [meter] Temperature [°C] Mixed system Displacement system
Figure 11.20.Comparison between mixed system in line 35 and 36 and displacement system in line 31 and 32
Figure 11.20 shows the comparison of two systems in the summer scenario. The temperature difference in the breathing zone between two systems can be clearly seen here. The temperature is almost constant in the case of mixed system for certain height and is higher than displacement system. In principle the temperature at the ceiling for displacement system should be higher than mixed system. But in this case the mixed system shows higher temperature in the roof level and the main reason for this is the higher heat output from the presses in the mixed system compared to the displacement system.
11.4.3 Case III: Summer scenario for displacement ventilation in line 35 and line 36.
In order to have a better comparison between the two systems the mixed system in line 35 and 36 is replaced by displacement system in the model. This time all the heat output and heat sources are same as that for mixed system. The temperature settings are also same as that for mixed system. The temperature distribution plot can be seen in the figure 11.21.The temperature in the breathing zone is between 26°C and 27°C.The velocity plot in the figure 11.22 show the recirculation of contaminated air at the roof level from the presses and the breathing zone thus forming a stratification layer between the breathing zone and contaminated zone.
Figure 11.21. Temperature plot for displacement ventilation for summer scenario in lime 35 and 36
Figure 11.22.Recirculation of contaminated air at the roof level in displacement ventilation
The iso-surface plot in this case is shown in figure 11.23.It is plotted for a temperature of 26.5°C and it can notice that this temperature is spread entirely at the working area in the hall.
24 26 28 30 32 34 1 3 5 7 9 11 13 15 17 Height [meter] Temperature [°C] Mixed system Displacement system
Figure 11.24.Comparison between mixed and displacement system in line 35 and 36
The comparison between the two systems in line 35 and 36 is shown in the figure 11.24. The temperature compensation in displacement ventilation can be clearly seen in this case. Here also the temperature is low in the breathing zone when it’s compared to the mixed ventilation.
11.4.4 Case IV:
In this case the mixed system in line 35 and 36 is simulated for summer scenario keeping outdoor temperature 18°C. The exhaust flow rate in this is case same as that of winter case which is approximately 45,000m³/h.The remaining 120,000m³/h is not included in this case. The supply flow rate is also same as that of winter scenario. The outgoing air leaves the hall with the help of five exhausts on the ceiling by assigning equal flow rates for each exhaust. The supply temperature is set as 19°C. The heat output and heat sources remain the same as that in the winter case (see table 11.1). The temperature plot in this case can be seen in the figure 11.25. It shows a temperature range of 26° C and 27°C in the breathing zone. The velocity plot in the figure 11.26 shows the mixing of supply air with heat from the presses and blowing down towards centre line between the press lines.
Figure 11.25. Temperature plot for mixed ventilation for case IV in line 35 and 36
Figure 11.26. Velocity plot for mixed ventilation for case IV in line 35 and 36
Figure 11.27.Iso-surface plot for temperature of 27°C for case IV in line 35 and 36
The iso-surface plot in figure 11.27 shows the plot for temperature of 27°C for the mixed system during summer with outdoor temperature of 18°C. It can be seen that this temperature is present mostly in the floor level.
11.4.5 Case V:
The same situation is set for displacement system in line 35 and 36 as in case IV.The supplies temperature in this case also was 18°C. The heat sources and heat out put in this case remains the same (see table 11.1). Temperature plot in this case is shown in the figure 11.28.
Figure 11.28. Temperature plot for displacement ventilation for case V in line 35 and 36
Figure 11.29.Iso-surface plot for temperature of 19.5°C for displacement ventilation
Figure 11.30.Iso-surface plot for temperature of 27°C for displacement ventilation
Figure 11.29 and 11.30 shows the iso-surface plots for the displacement case. It shows the plots for the temperatures 19.5°C and 27°C. The plot for 27°C is well above the breathing zone which is not in the case of mixed system. 18 20 22 24 26 28 30 32 34 1 3 5 7 9 11 13 15 17 Height [meter] Temperature [°C] Mixed system Displacement system
Figure 11.31.Comparison between mixed and displacement system in line 35 and 36 from case IV and case V
The comparison for temperature gradient for two different systems can be seen in figure 11.31. The mixed system gave higher temperature in the occupied zone with a flow rate approximately 45,000m³/h.
11.5 Results from interview
An interview was conducted with the employees in the factory to find out which system they are more comfortable with. Interview was done with the employees working in both mixed and displacement system. The opinions for summer and winter scenarios for both the systems are represented with the help of pie charts and are shown in the figures 11.32, 11.33, 11.34, 11.35. Not sure 10% Uncomfortable 80% Comfortable 10%
Figure 11.32.Opinon for employees from line 33 to 36 in mixed system during summer Uncomfortable 50% Comfortable 30% Not sure 20%
Figure 11.33.Opinon for employees in line 31 and 32 in displacement system during summer
Not sure 20%
Comfortable 80%
Figure 11.34.Opinon for employees from line 33 to 36 in mixed system
during winter Uncomfortable 10% Not sure 10% Comfortable 80%
12 Energy calculations
Energy requirement for ventilation is an important factor to be considered when deciding on a new system or rebuilding a new system. The main reason for this is because the methods of distribution of air always affect the energy use. For this purpose the annual energy use for both mixed and displacement system in the factory is investigated.
As an initial step for this procedure a typical climate year has been made with the help of climate data software called Meteonorm.This software works as a database and helps the user to choose the city, weather station or places to find the climate parameters. For further reading see [10].If the necessary place or city is not available the user can choose the correct latitude, longitude and height over the sea in order to find the correct parameter.
A typical climate year for Olofström calculated by Meteonorm according to latitudinal and longitudinal position (latitude: 56°26’, longitude: 14°13’) is shown in the figure 12.1.The figure shows the outdoor temperature for each hour in a year. Figure 12.2 shows a temperature frequency plot for a typical climate year for Olofström. The normal temperature for a year in Olofström is 7.6°C which is almost same as in the figure 12.1.This verification is made with the help of chart in VVS tables and diagrams[11] for 7.6°C.