Are ethical mutual funds safer than
conventional mutual funds in the
European market?
A matched pair analysis of the risk in ethical mutual funds based on
three GARCH models’ estimates from a five factor model
Master Thesis within Business Administration Authors: Christoffer Johansson
Mattias Brandt Supervisor: Ph.D. Jan Weiss Jönköping, May 2015
ii
Acknowledgments
We would like to express our gratitude to our supervisor Ph.D. Jan Weiss at Jönköping International Business School for assisting and guiding us through this thesis and for the useful comments, remarks and engagement. We would also like to thank Ph.D. Pär Sjölander at Jönköping International Business School for the assistance in the statistical methods. We are also thankful for the comments and feedback made by our fellow seminar students at Jönköping International Business School.
………... ………...
Christoffer Johansson Mattias Brandt
christoffer.j@me.com mattias.brandt@hotmail.se
iii Master Thesis within Business Administration
Title: Are ethical mutual funds safer than conventional mutual funds in the European market? - A matched pair analysis of the risk in ethical mutual funds based on three GARCH models’ estimates from a five factor model
Authors: Christoffer Johansson and Mattias Brandt Supervisor: Ph.D. Jan Weiss
Date: May 2015
Subject terms: Ethical funds, SRI, Crises, Volatility, GARCH, TGARCH, EGARCH, Screens, Multifactor Models, Matched Pair Approach and European Market
ABSTRACT
Background: Ethical investing is growing in importance due to investors’ concern with environmental
and social issues. However, there is difference of opinion regarding the extent to which the limited investment universe affects the financial return of ethical investments. Recent empirical findings suggest that while there is no statistically significant difference in the returns of ethical and conventional funds, ethical funds tend to be less risky due to having better managed firms in the portfolio. More nuanced conclusions are drawn by Nofsinger and Varma (2014) who provide evidence that US ethical mutual funds outperform conventional funds in times of crisis at the cost of underperformance in non-crisis times, indicating that ethical funds are “safer” investments.
Purpose: This thesis builds on the latter findings, focusing on the European market instead. Its purpose is to examine whether European ethical mutual funds are safer than European conventional mutual funds in times of crisis and non-crisis. An analysis of the ethical funds’ screening-styles, returns and risk factor loadings will be performed to explain their volatility relative to conventional funds. The empirical investigation is based on a matched pair analysis of 33 European ethical mutual funds and 33 European conventional mutual funds with a European investment universe between 01-2005 and 01-2015.
Method: Volatility in the funds’ returns is estimated econometrically by means of three types of GARCH models (GARCH, TGARCH and EGARCH). To explain volatility differences, we moreover calculate the funds’ risk factor loadings from a five factor model. In addition, we test to what degree the variance in the ethical funds’ returns is influenced by screening techniques, and whether there are any significant differences regarding the techniques being applied.
Conclusion: Based on the variance, we observe that ethical funds have a lower mean reversion from a
shock and greater exposure in the volatility to certain market news. We moreover show that they are less exposed to systematic market risk and small firms. During the crisis we find that ethical funds react more to certain market news but less exposed to the systematic market risk. The empirical results also suggest an overperformance of ethical funds in times of crisis at the expense of underperformance in times of non-crisis, indicating support for Nofsinger and Varma’s (2014) conclusion. The PRO/ESG screen exhibits an asymmetric return while the Best-in-Class approach has the highest return and lowest variance.
iv TABLE OF CONTENTS 1. INTRODUCTION ... 1 1.1. BACKGROUND ... 1 1.2. PROBLEM DISCUSSION ... 2 1.3. PURPOSE ... 3 1.4. RESEARCH QUESTIONS ... 3 2. FRAME OF REFERENCE ... 4 2.1. ETHICAL THEORY ... 4
2.1.1. BUSINESS ETHICS AND CORPORATE SOCIAL RESPONSIBILITY ... 4
2.1.2. SOCIALLY RESPONSIBLE INVESTING ... 5
2.2. CONVENTIONAL AND ETHICAL FUNDS ... 7
2.2.1. SCREENING TECHNIQUES ... 9
2.3. PORTFOLIO THEORY AND MULTI FACTOR MODELS ... 10
2.3.1. THE CAPM AND SINGLE INDEX MODELS ... 11
2.3.2. FAMA AND FRENCH’S THREE FACTOR MODEL ... 12
2.3.3. CARHART’S FOUR FACTOR MODEL ... 12
2.3.4. LEITE AND CORTEZ’S FIVE FACTOR MODEL ... 13
2.4. THE EFFICIENT MARKET THEORY ... 13
2.5. AUTOREGRESSIVE CONDITIONAL HETEROSKEDASTICITY FRAMEWORK ... 14
2.5.1. ARCH ... 15 2.5.2. GENERALIZED ARCH ... 15 2.5.3. THRESHOLD GARCH ... 16 2.5.4. EXPONENTIAL GARCH ... 17 3. METHOD ... 18 3.1. METHODOLOGY ... 18 3.1.1. PHILOSOPHY OF SCIENCE ... 18 3.1.2. APPROACHES ... 19 3.1.3. STRATEGIES ... 19
3.1.4. DATA COLLECTION TECHNIQUES AND THE ANALYSIS PROCEDURES ... 19
3.1.5. TIME HORIZONS ... 20
3.1.6. THE MATCHED PAIR APPROACH ... 20
3.1.7. ECONOMETRIC METHOD ... 21
3.1.8. METHODOLOGICAL CHOICES ... 21
3.2. EMPIRICAL MODEL AND DATA ... 22
3.2.1. SAMPLE SELECTION ... 22
v
3.2.3. DATA ANALYSIS ... 23
3.2.4. DEFINITION OF THE INVESTIGATED PERIODS ... 24
4. EMPIRICAL RESULTS ... 25
4.1. PRELIMINARY RESULTS ... 25
4.2. VARIANCE MODELING AND ANALYSIS OF THE RETURN AND RISK FACTOR LOADINGS ... 26
4.2.1. THE RETURN AND RISK FACTOR LOADINGS OF THE PORTFOLIOS ... 28
4.3. ANALYSIS BEFORE, DURING AND AFTER CRISIS TIMES ... 28
4.3.1. THE RETURN AND RISK FACTOR LOADINGS OF THE PORTFOLIOS ... 30
4.4. ETHICAL FUNDS SCREEN PERFORMANCES ... 31
4.4.1. ANALYSIS BEFORE, DURING AND AFTER CRISIS TIMES OF THE SCREENS ... 33
5. ANALYSIS ... 35
5.1. ANALYSIS OF THE GARCH AND RISK FACTOR LOADINGS ... 35
5.2. ANALYSIS OF THE SCREENS ... 37
6. CONCLUSIONS ... 40
7. DISCUSSION ... 41
7.1. FUTURE RESEARCH ... 41
LIST OF REFERENCES ... 42
APPENDIX A – MONTHLY DATA ... 48
APPENDIX B – THE SAMPLE ... 49
APPENDIX C – MULTICOLLINEARITY/UNIT ROOT MATRIX TEST ... 50
APPENDIX D – FUNDS’ ABSOLUTE RETURNS ... 51
vi LIST OF TABLES
Table 1 – Types of ethical funds. Source: Swedbank (2007) ... 8
Table 2 – Different types of funds. Source: Morningstar (2015) ... 8
Table 3 - Sample selection criteria ... 22
Table 4 - Fund sample characteristics ... 23
Table 5 - Funds’ descriptive statistics ... 25
Table 6 - The GARCH models estimations of the funds ... 26
Table 7 - Risk factor loadings of the funds ... 29
Table 8 - Ethical funds EGARCH estimates for the screens ... 32
Table 9 - Screen characteristics ... 33
LIST OF FIGURES Figure 1 - The effect of diversification on non-market risk. Source: Sharpe (1972) ... 11
Figure 2 - Distributions. Source: Gujarati & Porter (2009) ... 14
Figure 3 - Conditional standard deviation of the GARCH models ... 27
1. INTRODUCTION
In this chapter we present the background of the thesis along with the problem discussion, the purpose of the thesis and the research questions.
1.1. BACKGROUND
While ethics can be described as a set of rules and principles that governs an individual’s behavior (Rhodes &Soobaryen, 2010), business ethics has an extensive, diffuse and ambiguous definition that includes a number of different aspects to take into consideration. One of the most obvious characteristics of business ethics is the environmental impact and how the company pollutes the nature. When discussing business ethics not only can the environmental impact from the business be under consideration but also the social impact from the business must be accounted for. The aim for corporations must be to achieve sustainability, which means to achieve social, environmental and financial success at the same time (Elkington, 1998). The intention of these achievements is based on the belief that corporations must seek financial success while taking responsibilities for their impact on the other areas (AON, 2007). This reasoning has also spread to the investment industry where this has created the concept of ethical investing and ethical funds which invest responsible with consideration to several criteria’s to avoid unethical corporations that trade and/or produce socially undesirable products such as war material, tobacco, pornography, alcohol and gambling. Most ethical fund managers apply a filter called ESG (Environmental, Social and Governance) in their investment analysis, decisions and portfolio construction in order to meet the predetermined criteria of the fund (Nofsinger & Varma, 2014). Ethical investments exists because investors want to combine both the financial and the social return of their investments (Sparkes, 2001) since the interest and concern for environmental and social issues is increasing and is further reinforced with the media exposure and advertisement of ethical mutual funds (Schwarz, 2003).
However, the issue of ethical investments has always been in the question whether the limited investment universe will have a negative impact on the performance of the fund (Leite & Cortez, 2014). By imposing limitations on the investment universe the investor will theoretically “pay for the ethical” of the fund and not receive any financial returns for this (Nofsinger & Varma, 2014). These questions have been researched for many years and started in 1972 when Moskovitz analyzed ethical funds based on 14 firms that he had determined ethical. He then calculated the performance and compared it to the Dow Jones Industrial Index and found a positive relationship between ethical firms and stock performance. In 1975 Vance did the same study but with 50 firms that were ethically rated by businessmen and students and the findings indicated a negative correlation between ethical firms and stock performance. Over the following years many more studies have been performed with the same research objective and the results of the studies have been mixed, where some studies show outperformance of ethical funds against conventional funds (Bauer, Derwall & Otten, 2007) while others show underperformance due to the costly constraints (Geczy, Stambaugh & Levin, 2003). Some research shows that there are no significant differences between ethical and conventional funds at all (Alexander & Buchholz, 1978; Kreander, Gray, Power & Sinclair, 2005; Leite & Cortez, 2014).
2
A meta-analysis conducted in 2014 by Revelli and Viviani based on 85 studies and 190 experiments showed that there is no statistical difference in the results of ethical and conventional funds but the differences found in previous studies is due to the study´s method and execution itself. Capelle-Blancard and Monjon (2012) claim that the topic of comparing ethical and conventional funds’ returns has already been too much investigated. Leite and Cortez (2014) tested based on a five factor model if the funds usage of the negative or the positive screening in the ethical investment decision made any difference for the fund’s return and found that funds that used the positive “Best-in-class” approach seems to lead to better financial performance but this could not be statistically proven. Also Capelle-Blancard and Monjon (2014) had tested the difference between positive and negative screening and found that the “…results
favor the best-in-class approach…” (p. 516).
Bauer et al (2005) argue that ethical funds are less exposed to market variability than conventional funds since the main focus in the investments is more on the growth and less on the current value. Nofsinger and Varma (2014) suggested in their nuanced research that ethical firms are better managed and therefore more stable in volatile times. The implication of their suggestion is that ethical funds could be safer in a risky market and they showed that US ethical funds are asymmetric since they outperform the conventional funds in times of crisis but underperform in non-crisis times due to their investments in stable firms. The theory of ethical funds volatility is not as extensive as the theory of comparison the fund’s performance and von Wallis and Klein (2014) request more research on the risk in ethical funds in volatile markets and especially on the European market, since it is a volatile market and has been ever since 1974 (Kearny & Potí, 2007). The European market has had a number of crises in modern times, for example the IT Crisis in 2000, the Subprime Mortgage Crisis in 2008 and the European Debt Crisis in 2010. The crisis of 2008, the Subprime Mortgage Crisis, was a consequence of the default of subprime loans (Junior and Franca, 2011) which occurs when borrowers with low credit scores can loan at a relative low interest rate and consequently it created an increase in the private debt in European monetary union (Constâncio, 2013). Most research on ethical funds has so far been conducted on the US and UK retail markets (Bauer et al, 2005), for example studies by Hamilton, Jo and Statman (1993) and Statman (2000) where they compared returns of the US markets with the S&P 500 and Domini Social Index. The research that has been conducted on the European market has either been in comparison against the US market or solely on the UK market, leaving the entire European market not being extensively researched (von Wallis & Klein, 2014).
1.2. PROBLEM DISCUSSION
Most studies have so far predominantly focused on the difference of the returns of ethical and conventional funds. Traditional portfolio theory claims that imposing ethical constraints create a limited selection universe for the portfolio manager, which will according to theory never outperform a conventional non-constraint portfolio (Bauer et al, 2005). Regardless of this theory, the results of the studies have been mixed over the years and the most recent study by Revelli and Viviani (2014) concludes that there is no difference in the yield between ethical and conventional funds. The risk aspect of the ethical funds has not been as thoroughly researched as the yield (Bauer et al, 2005) and there is gap in the knowledge about the ethical funds behavior in a volatile market. Nofsinger and Varma´s (2014) proposed in their article, based on Moskowitz
3
(2000) suggestion that actively managed funds may hold up better in crises times, that although ethical funds may experience a negative abnormal return compared to conventional funds, they “…may hold up better during a bear market even at the expense of underperformance during a bull market…” (p.182). Nofsinger and Varma (2014) stated that since ethical firms are better managed, they can therefore withstand financial crises better than conventional funds, but as in most studies this study has also been performed on the US market. Very little research is based solely on the European market and the research that in fact has been done based on the European market is mostly performed only on the UK market or as a comparison between the UK market and the European market (Mallin, Saadouni & Briston, 1995; Kreander et al, 2005; Gregory & Whittaker, 2007; von Wallis & Klein, 2014). The studies that have been performed in the European market (Kreander et al, 2005; Bauer et al, 2005) have as today outdated sample periods. In 2014, Leite and Cortez performed a more recent research based on European funds. They focus on European funds returns but not limited to European investment universe and therefore the results do not focus solely on the European market or the volatility and so far we have not seen any research with these criteria’s. As mentioned, von Wallis and Klein (2014) requested more research on the European market, with focus on the risk in ethical funds. As stated, previous researches has primarily concentrated on the risk-adjusted alpha and not on the volatility of the ethical mutual funds, so by estimating and modeling the volatility by three different ARCH-models, which has a proven record of accurately estimate the conditional volatility of the financial markets, we will have a new approach to assess the risk of ethical mutual funds. We will base all calculations on the five factor model, which is the most recently developed multi factor model by Banegas, Gillen, Timmermann and Wermers (2013) and Leite and Cortez (2014).
1.3. PURPOSE
The purpose of this thesis is to examine whether European ethical mutual funds are safer than European conventional mutual funds in times of crisis and non-crisis. An analysis of the ethical funds’ screening-styles, returns and risk factor loadings will be performed to explain their volatility relative to conventional funds. The empirical investigation is based on a matched pair analysis of 33 European ethical mutual funds and 33 European conventional mutual funds with a European investment universe between 01-2005 and 01-2015.
1.4. RESEARCH QUESTIONS
How does a European ethical mutual fund perform in terms of risk in the volatile European market as compared to a conventional mutual fund?
How did the ethical mutual funds react in the volatility before, during and after the financial crisis in 2008 and 2010 as compared to the conventional mutual funds?
4
2. FRAME OF REFERENCE
In this chapter we present the frame of reference that will be used to design the investigations and make sense of the empirical observations. We will base it on ethical theory, classic portfolio theory and statistical theory.
2.1. ETHICAL THEORY
2.1.1. BUSINESS ETHICS AND CORPORATE SOCIAL RESPONSIBILITY
The interpretation and the true aim of business ethics have been unclear and debated for many years. Do business act ethical because they want to be ethical or because they have to be due to laws and regulations? Davis (1960) argued that business ethics is when corporations take decisions and actions for other matters than the direct economic or technical interest. Carr (1968) debated that businessmen are only playing the game that is needed and one of the interviewees in his article claimed that as “…long as a businessman complies with the laws of the land and avoids telling
malicious lies, he’s ethical”(p. x). Furthermore Carr (1968) continued debating that if the firm does
not transgress the law, every firm has the right to shape its strategy without reference to anything but its profits. Freidman (1970) had the same idea since the main goal for the firm and the manager is to create value for the shareholders, no other object can be perused at the cost of this goal. Freeman (1994) formulated the difference between business and ethics as the separation thesis, so one can separate them with sentences such as “x is a business decision” and “x is a moral decision”, hence making the business being perceived as amoral. Collins (1994) described business ethics as an oxymoron1 and presented the principles of a top manager where the goal for
the manager is to maximize the profits but the expectations of others, such as the law, ethical customs and hostile reactions, constrains the ability to do so. In some sense, the society forces the manager to act in conjunction with the implicit norms that exists in order to survive (Woodward, Edwards & Berkin, 1996). These norms are assumed to be fixed but tend to change over time and a manager can affect and manipulate investors beliefs about the firm by disclose information that benefits the manager and firm. This is known as the Legitimacy theory and it is based by social contracts between the society and firm (Deegan & Unerman, 2011). The Legitimacy theory assumes that the key factor is not how reality actually is but rather what the society beliefs and sees. Wicks and Freeman (1998) claimed that ethics raises the issue of whether any business activity can ever be justified and Elkington presented in 1998 the Triple Bottom Line as a way to show that except an economical goal, corporations also have environmental and social goals to achieve, despite the previous statements.
When business is identified with an anything goes kind of action and the main purpose for the manager is to maximize the profit, business and ethics will theoretically always be in conflict (Werhane & Freeman, 1999). This issue is grounded in the shareholder value maximization and the
agency theory, where the manager’s main objective is to increase the shareholders financials return.
1 Oxymoron is defined as two opposites combined. Source: Collins (1994)
2 As presented in in APPENDIX C – MULTICOLLINEARITY/UNIT ROOT MATRIX TEST, our
sample has no issues with unit root or multicollinearity. The Ljung-Box Q test for serial correlation were performed and with satisfying results at a 5% level. All calculations have an acceptable R2 with levels
5
The shareholders can be seen as the principal in the agency theory while the managers are the agents (Lazonick & O’Sullivan, 2000). So by not focusing on achieving max value for the principal, the agent is breaking the principal’s trust and thus causes agency issues and costs for monitoring and control of the agent (Eisenhardt, 1989). Renneboog, Horst and Zhang (2008a) formulated the issue as a question: “…is a firm’s aim to maximize shareholder value or social value?” (p. 1730). They argued that according to classical economic theory, social wealth fare is connected to value maximization, but modern economic theory implies that this relationship is not necessarily true due to externalities. When focusing on shareholder value maximization, other stakeholders, such as employees, customers, governments and environment can be negatively affected (Renneboog et al, 2008a). The dilemma between financial and social return is also applicable to the fund manager’s investment style, where the fund manager is the agent and the investor is the principal. By not maximizing the investment for the principal, the agent is breaking the trust. The pressure for corporate accountability for legal, social, moral and financial aspects is increasing over the last years (Waddock, 2004) and as the transparency of markets are increasing, customer has higher demands for sustainable products (Gauthier, 2005). This has increased corporate social responsibility (CSR) activities in many firms and Arvidsson (2014) explained that the “…increased demand comes from their “prime” stakeholder, i.e. the shareholders regardless of whether their
actual objective with increased CSR focus is to satisfy their stakeholders” (p. 221). Since the research
Arvidsson (2014) conducted shows that neither the investors nor the financial analysts are interested in responsible reporting, the result indicates that the managers are moving from the classic shareholder value maximization to a stakeholder value maximization. The stakeholder value maximization states that in order to be successful, the management of all stakeholders, not only shareholders, must be relied upon in order to have financial and social success (Donaldson & Preston, 1995). The study of Arvidsson (2014) displayed that by engaging in CSR activities, the firm is violating the assumption of shareholder value maximization and the agency theory but Graves and Waddock (1997) argues that by successfully manage all stakeholders, the firm can reach a higher corporate social performance and consequently it is positive for the corporate financial performance. Weather CSR is worthwhile for the corporations or not is still up for debate and is separated by the claims that the manager should only concern himself with the shareholder and that by engaging in successful management for all stakeholder, he can create more value for the shareholder.
2.1.2. SOCIALLY RESPONSIBLE INVESTING
Even though individuals “…always prefer more wealth to less...” (Dobson, 1997, p. 5), all investors have a taste for assets based on personal criteria’s other than the financial return that will shape the investor’s portfolio (Fama & French, 2007). This can include socially responsible investments, denoted SRI, which is the social awareness of the environment, civil rights protection and distrust towards nuclear energy that started in the sixties (Bauer et al, 2005). Also excluding investments that deal with alcohol, pornography, environmental pollution and gambling are part of what is usually denoted SRI (Dam and Heijdra, 2011). In SRI the goal is to combine financial and social returns and the investor can actively choose to only invest in firms that reach a predefined personal ethical criteria (Sparkes, 2001). Ethical investing is growing in importance and many investors are seeking ethical investments for their pension funds, even though the financial return might be lower (Haveman & Webstern, 1999; Shepard, 2011). Some reasons why ethical investing
6
is growing is due to investors’ concerns of the environment in combination with growing interest in ethics and media advertisement exposure of ethical mutual funds (Schwarz, 2003). Benson and Humphrey (2008) found that ethical fund flows are less sensitive from past performance than conventional funds, indicating that “…SRI investors are more likely to reinvest in funds they already
own…” (p. 1858) than conventional investors are, making this a plausible explanation to why
ethical investing is continuing to grow.
The main question is if ethical investors have to pay for the ethical as a consequence of a limited investment universe which reduces the possibilities of creating well-diversified portfolios and therefore the portfolio is suffering in the financial returns (Leite & Cortez, 2014; Nofsinger & Varma, 2014). The diversification process is discussed by Cowton (2004) when he evaluates ethical stocks that do not exist in the same extent as conventional stocks and this can generate a problem when creating an efficient portfolio. There have been many researches in the area of ethical funds’ performance and all with various results. Moskovitz (1972) and Bauer et al. (2007) showed a positive relationship between ethical behavior and good performance while Vance (1975) and Geczy et al. (2003) found a negative correlation. Alexander and Buchholz (1978) and Kreander et al. (2005) found no statistical difference at all. Adler and Kritzman (2008) argued that there must be some costs when deselecting attractive companies and by a Monte-Carlo simulation they found that ethical firms gives up approximately 0.17% to 2.4% per year in financial returns. Also Renneboog, Horst and Zhang (2008b) have found results that indicate that investors pay a price for ethical investments, but the returns are not significantly different from conventional funds. Fabozzi, Ma and Oliphant (2008) found that unethical stocks outperformed the market index but Barnett and Salomon (2006) and Renneboog et al (2008a) argued that the theoretical diversification loss for ethical funds could be compensated by the benefits of investing in firms with strong social performance. Based on a literature review, von Beurden and Gössling (2008) found a positive relationship between corporate social performance and financial performance. Capelle-Blancard and Monjon (2012) argued that “The question of the financial
performance of the SRI funds is relevant, but maybe too much attention has been paid to this issue” (p. 240). A
recent meta-study based on 85 studies and 190 experiments did not generate any significant difference between ethical and conventional funds’ performance (Revelli and Viviani, 2014). It showed that the previous differences in earlier researches is only an effect of the researchers chosen method and execution.
Oh, Park, Pervez and Gahuri (2013) argues that ethical funds are essentially better than conventional funds in the long run, for example in the retail markets where the customer demands for sustainable products eventually will create value for the ethical fund (Haigh & Hazelton, 2004). Also Cummings (2000) argued that ethical investments are better in the long run since they “…pursues a joint financial /social utilitarian perspective, whereby both financial and social goals are
achieved through long term commitment to social behavior, which minimizes externalities to the firm”(p. 80).
Bauer et al. (2005) argued that there might be less risk in ethical funds since they focus more on growth than on current value while Sievänen (2012) found that ethical pension funds are committed to their strategy even in times of crises and highlights the long term investment philosophy. Ferreira, Keswani, Miguel and Ramos (2011) found that larger firms have better CSR conducts and norms on average, which will attract ethical funds to a larger extent than conventional funds. Basso and Funari (2003) and Gregory and Whittaker (2007) found results
7
that showed lower volatility in ethical funds compared to conventional funds. They claim that these results are due to the ethical funds sustainable investments, which in the long term is a credible choice because even though the returns might be lower, it generates another return in terms of social well being. Nofsinger and Varma (2014) followed up and claimed that since ethical corporations are more aware of their business, they are better managed and can therefore handle a crisis better than conventional corporations. Furthermore they argued that under Kahneman and Tversky’s (1979) Prospect Theory, investors are more negatively affected by losses than they are positively affected by a gain. This could generate an opportunity for the asymmetric ethical funds to increase in numbers and values since the investors has a higher utility for not doing bad in a bad market condition rather than doing good in normal market condition. Investors might give up some financial return in a bull market in exchange for a lower risk in a bear market and Nofsinger and Varma (2014) showed that this is the case in US ethical funds. An investor can influence corporation’s actions in several ways, as the shareholders of a company have the power to hold the company accountable on several fields due to shareholder democracy, where the shareholder has a voting right in the corporations (Crane & Matten, 2012). Parkinson (1993) and Sparkes (2001) distinguishes the roles of the shareholders into two categories,
shareholder activism and socially responsible investments, and Kinder (2005; cited in Crane & Matten,
2012) list three types of social investors, Value–based, Value-seeking and Value-enhancing investors. Oh et al (2013) describes the latter as; Value-enhancing investors use shareholder involvement or activism in order to improve the investment value. Shareholder activism is a technique to influence the company by voting to act in a more ethical way. Sometimes there is no financial profit motive but is purely done for the ethical impact (Sparkes, 2001). This phenomenon is called advocacy campaigning and is focused on a single field, for example environmental or animal rights questions. This type of campaign has usually no financial interest but rather trying to inflict financial damage to the company to get their message through. Ways of achieving this can for example be obtained by the use of boycotts, where they encourage customers not to buy the corporations products or services (Sparkes, 2001). Oh et al (2013) describes the first and second investor as; Value-based investor choose investments based on moral or religious standards and Value-seeking investors use social and environmental data to enhance the portfolio performance. When including a shareholders want for financial returns, the shareholder often avoids such publicity as in shareholder activism in order not to create any negative reputation for the company and thus lowering the stock’s value. These shareholders have more concerns than just an ethical field and seek to improve the company to perform ethical rather than hurting it if not done (Sparkes, 2001). Ethical funds have a heavy voice in the corporations as a distinct feature (Oh et al, 2013) and institutional investors have several tools in order influence the corporation where class-action law-suits, media campaign, private negotiations and earlier mentioned voting power at board meetings are such tools (Deutsche Bank Group, 2012).
2.2. CONVENTIONAL AND ETHICAL FUNDS
A fund can contain many different instruments such as risk-free assets, stocks and derivatives; it all depends on the chosen specifics by the manager (Clarke, de Silva & Thorley, 2006). The combinations and weights in the fund are chosen according to the funds’ investment style, criteria’s and risk level. Fund criteria’s that must be fulfilled can for example be geographical,
8
industrial, ethical, environmental or social aspects. A diversification process on the above mentioned features could reduce the total risk of the fund (Elton, Gruber, Brown & Goetzmann, 2014). Hence, the risk-reward ratio can according to the Capital Asset Pricing Model (CAPM) theory be optimized. A fund has basically the same characteristics as a portfolio; the key difference is that the latter involves management and implementation from the customer’s decisions, while the fund is mostly constructed due to the manager’s preferences and decisions. A mutual fund’s portfolio is structured and maintained to match the investment objectives in its stated prospectus. The net total value is the total amount that has been invested in the fund; hence it is mainly own by the investors (Baker & Filbeck, 2013). Funds can be managed either actively or passively; the latter generally means it is following an index, while the actively managed fund aims to outperform an index (Morningstar, 2007). When the fund is actively managed, the managers’ needs to charge the investors a higher premium for the effort they put in to the management process compared to an index fund. Baks, Metricks & Wachter (2001) evaluates the final net yield between these two types of funds after fees are subtracted. The result is significant and indicates the same conclusion as Jensen (1968) found, which is that most of the actively managed funds do not outperform index funds. Moskowitz (2000) argues on the other hand that an actively managed fund might deliver better returns when they are as the most needed, for example in a crisis. According to Morningstar (2007) there exists different fund types with different investment philosophies and the most common types of mutual funds are presented in Table 2. Today most banks and investments companies also divide funds into different categories, such as regional, industry, ethical, global or national and especially in ethical funds are there several more categories. Swedbank (2015) list on their website several categories which all are some sort of ethical funds in Table 1.
Table 1 - Types of ethical funds. Source: Swedbank (2015)
Fund Type Explanation
Ethical Funds The normal ethical funds that uses either negative or positive
screening method
Best-‐in-‐Class funds Funds that use the positive screening method.
Refrain-‐from Funds Funds that use negative screening
Norm based screening funds Negative screening based on companies that are in conflict
global norms such as UN or OECD.
Environmental funds A compilation name for all funds that focus on green and
environmental friendly stocks
Environmental technique funds Investments in stocks that develop new technology in order to
improve the environmental work
Nonprofit funds Funds where part of the fund asset or the management fee is
donated to charity.
Theme funds For example only stocks that develop clean energy will be
invested in
Commitment funds Where the fund manager works actively, by for example voting,
9
Most of the earlier researches within ethical and SRI funds have used equity funds in their studies (Kreander et al, 2005; Geczy et al, 2003; Carhart, 1997). The main reason for this is that equity funds are the most common ones. Hence, there exist many equity funds and the data is available for a long period back in time. There are two general types of ethical funds, Market-led funds and Deliberative funds (Mackenzie, 1998). Market-led funds chose companies to invest in based on the indications of the markets collected by a research agency such as EIRIS (Ethical Investment Research Service). These funds positions themselves as to what the investors wants right now and is not always genuinely consider the most ethical companies in the world (Mackenzie, 1998).
Deliberative funds are based on their own ethical criteria where they research and evaluate the
companies and their practices for themselves. Ethical experts usually carry out the research with focus on either ethics or environment (Mackenzie, 1998). They also consider what the market wants, as the market-led funds to, and this affects the decisions to some extent. The difference is not always cut clear and a very few funds are either market-led or deliberative funds only, but Mackenzie (1998) claims that about one third of all ethical funds are deliberative funds.
2.2.1. SCREENING TECHNIQUES
There are several methods to create and maintain an ethical fund and the most acknowledged method is the positive or negative screening approaches (von Wallis & Klein, 2014). The negative
screening, also called avoidance, means that investments with less desirable features or business
activities will be excluded from the portfolio (Renneboog et al, 2008a; Camey, 1994). Often firms that trade or produce socially undesirable products such as tobacco, alcohol, war material, nuclear energy, pornography and gambling are rejected from the fund. Not all product screens are always used at the same time, applying just a few is also a rather common occurrence, for example only excluding alcohol, tobacco and gambling. According to Renneboog et al (2008a), a study by SIF in 2003 reports that fund managers normally use more than one screen, in US five screens are used by almost 64% while only 18% use only one screen. The positive screening means that only investments that meet a specific criterion will be included in the portfolio (Camey 1994). Often firms that exhibit good environmental records, good corporate governance and good employee
Table 2 - Different types of funds. Source: Morningstar (2007)
Fund Type Explanation
Money Market FundsInvests in short-term fixed income securities, for example government bonds, treasury bills and commercial certificates.
Fixed Income Funds Buys investments that pay fixed rate of return, for example government bonds and corporate bonds
Equity Funds
Invests in stocks and can be categorized into the following categories; growth stocks, value stocks, large-cap stocks, mid-cap stocks, small-cap stocks, or a combination of these
Balanced Funds Mix of equities and fixed income securities. They aim to generate higher returns, but at a lower risk
Index Funds Aims to mimic the performance of a specific index. Generally these funds have lower costs.
Speciality Funds Invests in special firms, i.e. real estate, commodities or firms who are classified as a social responsible company.
10
relations are included in the positive screen (Nofsinger & Varma, 2014). The positive screen often includes the Best-in-class approach which means that only firms that are best in their industry regarding ethics will be chosen for the portfolio (von Wallis & Klein, 2014). This approach allows firms from undesirable industries to make it into the fund due to the fact that they are best in their industry regardless of the ethicalness of the industry. Bauer, Derwall and Otten (2007) suggested that if fund managers chose firms that are the “least controversial”, the line between ethical and conventional funds becomes very vague. This might be one of the reasons Leite and Cortez (2014) and Capelle-Blancard and Monjon (2014) discovered that Best-in-class approach was the best ethical screen, since it avoids potential sector biases and thus actually can invest in unethical firms, as long as they are the best in their industry. Also Nofsinger and Varma (2014) concluded this but in combination to an ESG criteria. There is a less used third screen denoted
Morally Responsible Investing (MRI) or faith-funds and they are based on religious believes, often
Christian or Islamic believes (Ghoul & Karam, 2007). The Catholic Christian MRI funds do not invest in corporations that are involved direct or indirect in abortion, family planning and alternative lifestyles as well as the usual direct involvement in alcohol, tobacco, pornography, and war material. The main characteristic of Islamic MRI funds is the prohibition of Riba, meaning earnings on interest and can therefore not invest in banks, financial institutions, insurance companies, bonds or preferred stocks (Ghoul & Karam, 2007). The fund should also only select companies that are lawfully under the Sharia Islamic law.
Evaluating in which extent a company is being ethical may be impossible since investors have personal views and values of ethics (Havemann & Webster, 1999). For example, some investors are more concerned about the threat of the global warming while others are bothered by the development and sales of nuclear weapons. The Swedish ENF (Ethics Board of Funds Marketing) put down some basic rules in 2009 on how to regard the ethical aspects in funds. There can be no absolute zero tolerance for dealing with companies considered less ethical due to the ambiguous meaning of ethic, but the board established that the investor him/herself must decide what is ethical, hence the fund manager must leave comprehensive, clear and easy accessible information to all investors. Issues with this are that the information to all potential investors, current shareholders and activism groups must be available and correct. This is a matter of social responsible reporting (SRR) in corporations and is regulated by ISO 26000 which is an voluntary international standard for social guidelines, including reporting information regarding commitments, performance and other things related to social responsibility. Rhodes and Soobaryen (2010) declared there is no common metrics in the formal social reporting as it is in for example accounting. There is no mandatory reporting nor is it desirable by corporations, since it is difficult to measure ethics. This causes problems for the fund manager in the selection of investments, hence can create distrust towards the investors.
2.3. PORTFOLIO THEORY AND MULTI FACTOR MODELS
In the theory of Capital Asset Pricing Model (CAPM) it is assumed that investors are risk-averse and the only returns that disturbs are the ones that are below the average (Baker and Filbeck, 2013). An efficient portfolio can be generated by evaluating the dispersion around the mean which is denoted as the standard deviation (Clarke et al, 2006). Generally, standard deviation and variance are denoted as risk, since the terms measures how much an assets price fluctuate,
11
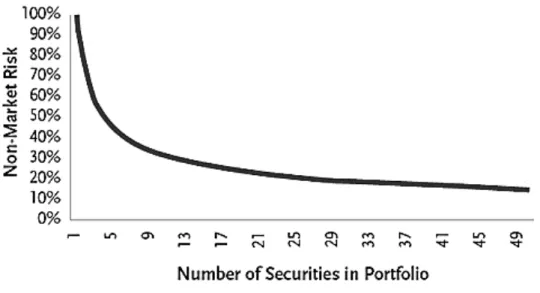
measuring how stable and predictable it is. The main goal is to create an expected ratio between risk and return that suits the risk appetite of the investor and the risk can be decreased by a good diversification of the investments (Jagannathan & Wang, 2012). In this thesis we measure risk in terms of variance, in other words, deviation around the mean. In opposite to this, empirical evidence reveal that investors are not only motivated by self-interest and the risk-reward ratio, but also the portfolio ethical level especially when dealing with long-term investments such as pension investments (Shepherd, 2011). In modern portfolio theory only two risks are considered, the systematic and the unsystematic risk, which refers to the risk in the market and the specific risk in the company respectively (Elton et al, 2014). The unsystematic risk can be diversified away by combining assets with different covariance while the systematic risk cannot be diversified away (Galai & Masulis, 1976). As seen in Figure 1, the unsystematic risk of a portfolio can drastically be reduced by combining ten to fifteen stocks given that the combination is efficient, but by adding more stocks than this will not create more diversification due to the systematic risk, hence the risk will flatten out but will never reach zero (Elton et al, 2014).
Figure 1 - The effect of diversification on non-market risk. Source: Sharpe (1972)
2.3.1. THE CAPM AND SINGLE INDEX MODELS
Different one-factor models based on the CAPM theory have been widely and frequently applied to estimate risk-adjusted returns (see for example Goldreyer, Ahmed & Diltz, 1999; Kreander et al, 2005; Climent & Soriano, 2011). In 1965, Treynor developed the Treynor measurement to estimate risk-adjusted returns as excess return over a risk-free rate, based on systematic risk. The equation is specified as !!!!!
!! where 𝑟!is the portfolio return, 𝑟! is the return of the risk-free rate
and β!is the portfolio’s beta. Sharpe (1966) developed another risk-adjusted measurement based on both systematic and unsystematic risk but it has been criticized by the CAPM theory, because unsystematic risk should almost disappear due to diversification (Kreander et al, 2005). The equation is specified as: !!!!!
!! where the equation is the same as for the Treynor measurement
except for the use of the portfolio standard deviation σ!instead of beta. Jensen (1968) developed another model called Jensen’s measurement, which tests if a portfolio generates any differential return over a market portfolio priced by the CAPM. The equation is specified as:
12
α!= 𝑟!− 𝑟!+ 𝛽!"∙ 𝑟!− 𝑟!
where α!shows the differential returns, 𝑟!is the realized portfolio return, 𝑟! is the risk-free rate, 𝛽!" is the portfolio beta and 𝑟!is the market return. Volatility is a synonym for risk and is a
major concern in the theory of CAPM (Clarke et al, 2006). It is a general equilibrium model, which allows for a relevant measure of risk, in relationship to the expected return when markets are in equilibrium (Baker & Filbeck, 2013). The equation for the CAPM is specified as:
𝑟! = 𝑟!+ 𝛽!𝑀𝑅𝑃
where MRP is 𝑟!− 𝑟! , 𝑟! is the return of an asset, 𝑟! is the risk free rate, 𝛽! is the asset beta
and 𝑟! is the market return. Due to the application of beta, the CAPM measures systematic risk and prices the asset by its market risk and the market return (Lintner, 1965).
2.3.2. FAMA AND FRENCH’S THREE FACTOR MODEL
In order to increase and complement the models explaining power, Fama and French (1993) developed an extension of the CAPM, rearranged it and added the “Small [market capitalization]-Minus-Big” factor, denoted SMB and the “High [book-to-ratio]-Minus-Low factor” denoted HML. Stocks with a lower market capitalization tends to have a higher return on average than stocks with a high market capitalization, so SMB is calculated as the difference between a portfolio of small capitalization stock returns and a portfolio of large capitalization stock returns (Banz, 1981). Fama and French (1992) found evidence that stocks with high ratios, such as the book-to-market ratio, has a better return than growth stocks that exhibited lower ratios. Rozeff and Zaman (1998) found that stocks that were value-stocks had a larger extent of insider trading and were priced below their fundamental value. The coefficient in HML is the value premium of investing in stock with a high book-to-market ratio and is calculated as the difference between a portfolio of high book-to-market stocks and a portfolio of low book-to-market stocks. By combining MRP, SMB and HML, the model compares a portfolio to three distinct risks instead of one. The equation of Fama and French’s (1993) three-factor model is specified as:
𝑟! = 𝛼!+ 𝛽!𝑀𝑅𝑃 + 𝛽!"𝑆𝑀𝐵 + 𝛽!"𝐻𝑀𝐿 + 𝜀!
where 𝑟!is the portfolio return, 𝛼! is the intercept, 𝑟! is the risk-free rate, 𝛽!is the market beta,
𝛽!" and 𝛽!" is the beta for the added factors SMB and HML respectively, while 𝜀! is the error
term.
2.3.3. CARHART’S FOUR FACTOR MODEL
Jegadeesh and Titman (1993) showed that stocks also exhibit a momentum effect where past winners continued to win and based on this assumption Carhart (1997) added a momentum factor, denoted WML and extended the three-factor model of Fama and French (1993) into a four-factor model. The WML factor refers to “Winners-Minus-Losers” and is calculated as the return difference between a portfolio of past winner stocks and a portfolio of past loser stocks for the past twelve months except the first month (Leite & Cortez, 2014). This implies that past winner continues to win, but if the factor is significant and negative, this could be interpreted as past losers becomes future winners (Humphrey & O’Brien, 2010). This allows the model to
13
explain the cross-sectional variation in momentum-sorted portfolio returns, which the three-factor model was not able to (Bauer et al, 2005). The equation for the four three-factor models is specified as:
𝑟! = 𝛼! + 𝛽!𝑀𝑅𝑃 + 𝛽!"𝑆𝑀𝐵 + 𝛽!"𝐻𝑀𝐿 + 𝛽!"𝑊𝑀𝐿 + 𝜖!
where 𝛽!"and WML is the beta of the momentum factor and the momentum factor respectively.
2.3.4. LEITE AND CORTEZ’S FIVE FACTOR MODEL
When choosing investments, there exist evidence that fund managers prefer to invest in local stocks due to information advantages and easier access to data (Engström, 2003; Gregory & Whittaker, 2007). Huberman (2001) argued that the local bias is associated with familiarity feelings and because of its comfort, investors are to some extent willing to make a risk-reward trade off in order to not put them in to a discomfort zone and as a result they will avoid investing in foreign stocks. In order to take into account for the local bias, Banegas et al (2013) and Leite and Cortez (2014) applied a five-factor model where the fifth factor is a local factor. The equations for the model is specified as:
𝑟! = 𝛼!+ 𝛽!𝑀𝑅𝑃 + 𝛽!"𝑆𝑀𝐵 + 𝛽!"𝐻𝑀𝐿 + 𝛽!"𝑊𝑀𝐿 + 𝛽!"𝐿𝑂𝐶 + 𝜀!
where the local factor LOC is defined as 𝑟!" − 𝑟! that refers to the returns of the local market
𝑟!" minus the global market 𝑟!.
Elton et al (2014) argues that single-index models often outperform more complex multi-factor models, because they tend to reduce “noise” in the result. However, single index models all share the same underlying assumption that stock prices only follow and move with or against the market. A multi factor model can be able to catch variables beyond the market that influences the stock price (Bauer et al, 2005). The theory of multi factor models suggests that factors like interest rate, industry index and many more can have an impact on the stock price. Although, according to Elton et al (2014) there is a chance to get inaccurate results when adding too many or wrongly defined factors into a model, which is why less complex single-index models often outperform multi-factor models. Therefore it is critical to use well-defined factors when dealing with multi-factor models.
2.4. THE EFFICIENT MARKET THEORY
During the history, different explanations exist of why assets move up and down in price and a well-known theory that tries to explain the movements is the efficient market theory (Kon & Jen, 1979). It assumes that the asset price reflects all information about the assets economic value but it does not imply that market prices are “correct”, although they will change immediately as new information becomes available (Fama, 1970). The theory can be divided in to three assumptions;
weak form, semi-strong form and strong form. These different categories test how much information
that is contained in the asset price. Kon and Jen (1979) tested the strong form of the efficient market hypothesis on mutual funds’ performance. The results were both supporting and rejecting the theory. When evaluating selectivity, timing and market efficiency, they concluded that
14
“…mutual fund managers individually and on average are unable to consistently forecast the future prices on
individual securities well enough to recover their research expenses, management fees, and commission expenses”(p.
288). In 1988 Hägg stated that the test of the abnormal risk-adjusted return of funds are actually a test of the semi-strong market efficiency, since all information available will have an instant impact on the stock prices (Fama, 1970).
2.5. AUTOREGRESSIVE CONDITIONAL HETEROSKEDASTICITY
……...
FRAMEWORK
In common econometrics models such as the least squares model, the variance is assumed to be unconditional over time and the expected value of all squared error terms to be the same value at any given point (Engle, 2001). This assumption is referred to as a homoscedastic variance, but in real financial data analyses this assumption are often violated due to the fact that the observations behave differently by becoming heteroscedastic, for example by volatility clustering or by a leptokurtosis distribution. Volatility clustering was first defined as “…large changes tend to be followed
by large changes-of either sign-and small changes tend to be followed by small change…” by Mandelbrot in
1963 (p. 418). When the data is plotted in a graph, volatility clustering becomes visible to the naked eye where high volatility is clustered together and small volatility is clustered together, refer for an example to our plotted returns of the funds in Figure 4. The subject of kurtosis is the statistical measurement of the peak in the distribution, see Figure 2. If the peak of the curve is low and the tails are “thin”, then there is platykurtic distribution and if the peak is higher than normal and the tails are “fat”, then there is a leptokurtic distribution. A normal distribution is denoted as a mesokurtic distribution. When the distribution is leptokurtic, small changes are less likely to occur while extreme events are more likely to occur. When analyzing financial data and using models that assume normal distribution they will underestimate the total effect of large price movements in for example crises due to a leptokurtic distribution (Gujarati & Porter, 2009). Mandelbrot (1963) argued that stock prices do not follow a strict random walk but a Lévy flight distribution, where the random walk is disturbed by large movements in the market. Léon (2007) found that the volatility changes over the business cycle and becomes higher during a crisis.
Figure 2 - Distributions. Source: Gujarati & Porter (2009)
15 2.5.1. ARCH
Predicting and estimating the variance of financial assets is of great importance when calculation risk and reward ratio and it has therefore been researched for many years. Engle solved the issue with violated assumptions of homoscedastic and unconditional variance in 1982 by constructing the Autoregressive Conditional Heteroscedasticity (ARCH) model. The model does not assume a constant variance and is therefore able to model the variance for financial data in a more suitable way. The variance of the errors is dependent on the squared errors for the last period, so by lagging the error-term, auto-correlation is minimized. With this model, Engle (1982) managed to model the variance clustering effects shown in financial data. The equation for the ARCH model is specified as the error term of the mean equation:
𝑦! = 𝜇 + 𝜀!
where 𝑦! at time t is given by the mean 𝜇 plus the error term 𝜀! at time t which is specified as:
𝜀!= 𝑣𝑡 ℎ!!
where ℎ!! is the conditional variance and 𝑣𝑡 is independent, zero-mean, unit-variance normally
distributed variables, specified as (Engle, Focarde & Fabozzi, 2007): 𝑣𝑡~𝑁(0,1)
In order to estimate the variance by eliminating the assumption of a random walk, the ARCH variance equation is specified as:
ℎ!! = 𝜔 + 𝛼!𝜀!!!! !
!!!
where ω is the long term mean of the conditional variance, 𝜀!!! ! is the ARCH error term of 𝑖 lagged residuals and α is the lagged residuals from the mean. It is assumed that 𝜔 > 0 and 𝛼! ≥
0. Intuitively, a large value in 𝜀!!!! will generate a large ℎ
!!, implying that large changes will be
followed by large changes and vice versa symmetrically. The ARCH term 𝜀!!!! has finite memory and represents the variation that could not be measured in the mean equation for the last time period. The constant α can be interpreted as to which extent the lagged residuals affect today’s residuals; hence how fast the model reacts to market events. To forecast this model, the constants ω and α needs to be estimated by a maximum likelihood method and they need to be non-negative to assure the assumptions of the ARCH model.
2.5.2. GENERALIZED ARCH
As an extension of the ARCH model Taylor (1968) and Bollerslev (1986) independently introduced the Generalized Autoregressive Conditional Heteroskedasticity (GARCH) parameterization by adding the term 𝛽!ℎ!!!! to the ARCH model, thus making the model a
weighted average of past squared residuals that are declining but never reaches zero (Engle et al, 2001). This is because all past errors contribute to forecast the volatility and the ARCH model
16
needs a long lag in order to not decay too rapidly, hence making the GARCH model a more parsimony model that is easier to estimate while giving more successful predictions (Teräsvirta, 2007). The GARCH model has the same representation as the ARCH model, but allows for longer memory and a more flexible lag structure. The GARCH model is specified as:
ℎ!! = 𝜔 + 𝛼 !𝜀!!!! ! !!! + 𝛽!ℎ!!!! ! !!!
where the added term ℎ!!!! is the conditional variance lagged j time periods and the constant β is the last period’s forecasted variance which has infinite memory and controls the magnitude. It determines the degree of the persistence in the volatility and a large β-value can be interpreted as a slow decay from a shock. The GARCH addition of the lagged conditional variance reduces the number of lags needed in the ARCH term 𝜀!!!! , which decreases the degrees of freedom and simplifies the calculations. To forecast this model, the constants ω, α and β need to be estimated by the maximum likelihood method.
Notice that if α is higher than β then the volatility is extreme. It is assumed that the relationship 𝛼 + 𝛽 < 1 holds which can be used in order to calculate the half-life of the shock. 𝛼 + 𝛽 is the mean reverting rate where the magnitude of the rate controls the speed of the mean reversion with the formula !" (!!!)!" (!.!) and the closer the rate is to one, the longer is the half-life of the shock (Goudarzi & Ramanarayanan, 2010). Hence calculations of the average time it takes for the shock to decrease by one half can be conducted. If 𝛼 + 𝛽 = 1 the model becomes non-stationary (the integrated GARCH, denoted IGARCH) and if 𝛼 + 𝛽 > 1 the model also becomes non-stationary but cannot be relied upon since the volatility will eventually explode into infinity (Lee & Hansen, 1994; Banerjee & Sarkar, 2006, cited in Goudarzi & Ramanarayanan, 2010).
2.5.3. THRESHOLD GARCH
A weakness with the standard GARCH model is that it assumes symmetric effects in the volatility, meaning that the volatility increases as much as it decreases. In reality this assumption is often violated due to the leverage effect. Black (1976) found that decreases in the stock market are greater than increases, which is making the standard GARCH model too inflexible to model the variance correctly. A way to remove this assumption is by using the Threshold GARCH model, developed by Glosten, Jagannathan and Runkleet in 1993 and is denoted TGARCH or GJR-ARCH. The equation for the TGARCH model is the same as the GARCH process but with the added leverage term 𝛾!𝑣!!!𝑒!!!! to the equation, giving the TGARCH model the following
equation (Dhamija & Bhalla, 2010):
ℎ!! = 𝜔 !+ 𝛼!𝑒!!!! ! !!! + 𝛽!ℎ!!!! ! !!! + 𝛾!𝑣!!!𝑒!!!! ! !!!
17
It is assumed that the relationship 𝛼 + 𝛽 +!!< 1 holds. The indicator term 𝑣!!!𝑒!!!! is 1 when
the error term 𝑒!!!! is below the threshold value of zero (negative) and 0 when it is above (positive), shown by the following equation (Engle et al, 2007):
𝑣!!! 1 𝑖𝑓 𝑒0 𝑖𝑓𝑒!!!< 0
!!!> 0
If γ is significantly positive, negative shock has a larger impact on ℎ!! than a positive shock has. 2.5.4. EXPONENTIAL GARCH
Another assumption of the GARCH models are that the constants must be non-negative, an assumption that is often violated in reality. A model that deals with the leverage effect and the non-negative constraints is the Exponential GARCH model, developed by Nelson in 1991. In the model, the variance ln ℎ!! is linear and lagged by 𝑧!´s. This makes the model non-negative while
allowing for negative constants in the model. The equation for the EGARCH model is:
ln ℎ!! = 𝜔
!+ 𝛽!𝑔 𝑧!!! !
!!!
𝛽! ≡ 1
where the deterministic coefficients 𝜔! !!!!,! and {𝛽!}!!!,! are real, nonstochastic and scalar sequences (Nelson, 1991). The 𝑔 𝑧! function in the model is formed to make the model take
into consideration the asymmetric relationship between stock returns and volatility and is a function for both magnitude and sign in a linear combination of 𝑧! and 𝑧! The equation for
𝑔 𝑧! is:
𝑔 𝑧! = 𝜃𝑧!+ 𝛾 𝑧! − 𝐸 𝑧!
where there is two components, one that defines the magnitude effect 𝛾 𝑧! − 𝐸 𝑧 and one
that defines the sign effect 𝜃𝑧! of the volatility shock. By construction 𝑔 𝑧! has a zero-mean with independent and identically distributed random error sequences and the components has also a zero-mean (Nelson, 1991). If 𝑔 𝑧! has the range –∞ < 𝑧!< 0, it is linear with the slope
𝜃 − 𝛾 and if the range is 0 < 𝑧!< ∞, it is linear in 𝑧! with the slope 𝜃 + 𝛾, thus allowing ℎ!! to
respond asymmetrically to falls and rises in the stock price (Nelson, 1991). The equation for the EGARCH model can be rewritten as (Dhamija & Bhalla, 2010):
ln ℎ!! = 𝜔!+ 𝛼! 𝜀!!! ℎ!!!! − 2 𝜋 ! !!! + 𝛽!ln ℎ!!!! ! !!! + 𝛾! 𝜀!!! ℎ!!!! ! !!!
where γ is the leverage effect and a negative γ implies that negative news create more volatility than positive news and if γ is equal to zero the model is symmetric.
18
3. METHOD
In this chapter we present the method chosen and how we have approached the field of interest in order to find information to fulfill the purpose.
3.1. METHODOLOGY
Methodology does not specify the different methods that will be used in the research but rather the meta-study of how the methods will contribute to the overall scientific enterprise (Hoover, 2005). Economical methodology is the concern about the relationship of meta-theoretical questions and if the claims of economists are reliable and true, how one can judge if this is the case and if the conclusions are to be believed in or not (Pålsson, 2001). Which research method that will be used and how the interpretations of the results will be done is to some extent determined by the researches persona and cannot be disassociated from past experience, culture, history and future intentions (Walters, 1994; Koch, 1995, cited in Clark, 1998). The most fundamental level to describe research methods are at the philosophical level where the focus is on the most general features of the world including mind, matter and reason (Blackburn, 1994; Clark, 1998).
3.1.1. PHILOSOPHY OF SCIENCE
According to Saunders, Lewis and Thornhill (2009) when conducting a research one of four major philosophies of science can be chosen as the starting point; Positivism, Interpretivism, Pragmatism or Realism. The common research methods for financial economics are divided into paradigms based on a positivistic philosophy, first developed byJohn Neville Keynes in 1889 and redefined by Milton Freidman in 1953 (Frankfurter & McGoun, 1999). The positivistic philosophy theory is derived from logic, mathematical treatments and is based on observable objects (Saunders et al 2009) while it is judged by the accuracy, scope and conformity of the estimates (Freidman, 1953). The positive economics has no ethical or normative judgments and is used to provide a system of generalizations and theories that can be used to make predictions of changes in the phenomenon’s not yet observed (Freidman, 1953). The truth regarding the observable patterns is not dependent on beliefs but to facts presented in the external reality (Clark, 1998). These observations are grounded in “hard” data and define the world as linear, which decreases the possibilities for interpretation by focusing on description of the empirical result (Saunders et al, 2012). The positivistic philosophy theory assumes that the physical world operates in accordance to general laws and tries to explain the social reality by describing observed patterns, which leaves very little room for interpretation and focus more on the empirical result.
In the theory of interpretivism, law and moral are perceived as one and it assumes that the access to reality is solely given by social constructions and focuses on interpretations rather than descriptions. The interpretivism assumes that the law is not formed by given facts, but rather by the judicators. Hence, this philosophy can be seen as the opposite to positivism (Saunders et al, 2009). In pragmatism, the major focus lies on the research questions and this philosophy is a mixed one. Hence, it is generally suitable when neither the positivist nor interpretivism philosophy can