This is the published version of a paper published in Journal of Geographic Information System.
Citation for the original published paper (version of record):
Abshirini, E., Koch, D., Legeby, A. (2017)
Flood Resilient Cities: A Syntactic and Metric Novel on Measuring the Resilience of Cities
against Flooding, Gothenburg, Sweden.
Journal of Geographic Information System, 9: 505-534
https://doi.org/10.4236/jgis.2017.95032
Access to the published version may require subscription.
N.B. When citing this work, cite the original published paper.
Permanent link to this version:
ISSN Online: 2151-1969 ISSN Print: 2151-1950
DOI: 10.4236/jgis.2017.95032 Sep. 7, 2017 505 Journal of Geographic Information System
Flood Resilient Cities: A Syntactic and Metric
Novel on Measuring the Resilience of Cities
against Flooding, Gothenburg, Sweden
Ehsan Abshirini
1, Daniel Koch
2, Ann Legeby
21Division of Geoinformatics, Department of Urban Planning and Environment, School of Architecture and Built Environment,
KTH Royal Institute of Technology, Stockholm, Sweden
2School of Architecture, KTH Royal Institute of Technology, Stockholm, Sweden
Abstract
Flooding is one of the most destructive natural disasters which have rapidly been growing in frequency and intensity all over the world. In this view, as-sessment of the resilience of the city against such disturbances is of high ne-cessity in order to significantly mitigate the disaster effects of flooding on the city structures and the human lives. The aim of this paper is to develop a me-thod to assess the resilience of a river city (the city of Gothenburg in Sweden), which is prone to flood Hazard, against such disturbances. By simulating flood inundation with different return periods, in the first step, the areas of impact are determined. To assess the resilience, two different methods are followed. One is a syntactic method grounded in the foreground network in space syntax theory and the other is based on measuring accessibility to the essential amenities in the city. In the first method, similarity and sameness
parameters are defined to quantitatively measure the syntactic resilience in the city. In the next step, accessibility to amenities and the minimum distance to amenities before and after each disturbance is measured. The results, in gen-eral, show that such disturbances affect the city structure and the resilience of the city differently. For instance, the city is more resilient after flooding ac-cording to accessibility measures. This clearly means that the answer to the question of resilience is mainly dependent on “resilience of what and for what.”
Keywords
Flooding, Resilience, GIS, Space Syntax, Accessibility
How to cite this paper: Abshirini, E., Koch, D. and Legeby, A. (2017) Flood Resi-lient Cities: A Syntactic and Metric Novel on Measuring the Resilience of Cities against Flooding, Gothenburg, Sweden. Journal of Geographic Information System, 9, 505-534.
https://doi.org/10.4236/jgis.2017.95032 Received: June 5, 2017
Accepted: September 4, 2017 Published: September 7, 2017 Copyright © 2017 by authors and Scientific Research Publishing Inc. This work is licensed under the Creative Commons Attribution International License (CC BY 4.0).
http://creativecommons.org/licenses/by/4.0/
DOI: 10.4236/jgis.2017.95032 506 Journal of Geographic Information System
1. Introduction
Flooding as a natural disaster has great impacts on both individuals and com-munities and causes social, economic and environmental consequences is flood-ing. Flood is defined as a great overflow of water which especially submerges normally dry lands. Given the broad and intensive impacts on human loss, da-maging of transportation, power plants and waste water systems, crops and farming and many other subsequences, people during the history put lots of ef-fort to develop solutions to reduce flood impacts [1]. However, given the aber-rant human interference in ecological system, urban sprawling, climate change, besides natural factors such as topography, geology of basins, land cover, amount of rainfall and etc. [2][3], the frequency and intensity of flooding is in-creasing [4][5][6]. Based on statistics from the Centre for Research on the Epi-demiology of Disasters [7] in the period 1994-2013 floods were the most fre-quent type of disasters, accounted 43 percent of all disasters and affected 55 per-cent of total population of the world during the past two decades. The report al-so emphasizes that floods had the most economical damage (US$ 636 billion) after the storms and earthquakes during this period. Flood forecasting and flood warning, as European Union notices, is a “prerequisite for successful mitigation of flood damage” [8]. One of the frequently occurring flooding is river flooding which occurs when a river excesses the capacity of its canal because of rainfall, flash flooding, snowmelt and etc. and overflows its banks and the surrounding areas called flood plain. When the flood plain includes the urbanized areas, such flooding has great impacts on both population and infrastructures. Therefore, flood risk management in urban areas plays an essential role in preventing or reducing the impacts of flooding [9]. Flood simulation has a long history and from two centuries ago hydrologist and engineers have attempted to develop and improve prediction models of water flow in canals and watersheds [10]. The state-of-the-art in flood modelling is using GIS capability as a platform which enables researchers to combine physical and hydrological measurements with social and urban infrastructure data and estimate urban flood damage and flood vulnerability [11][12][13][14].
Demir and Kisi [12], in a study on the Mert River in Turkey, integrated GIS and hydraulic model to represent a flood risk map. Creating a digital elevation model (DEM) of the study area and taking advantage of HEC-RAS1 software, they simulate flood flows of different return periods in a range of 5 to 10000 years. The result showed that the area in the downstream of the Mert River af-fected by a flood with a return period of 10-years was 30 percent which was comparable with the impacts of an occurred flood in 2012 in the same area. In another study in the central part of Gothenburg, Sweden, Filipova and collogues
[15] using MIKE 21 as hydrologic simulation software developed a 2-dimen- sional simulation model of flooding. Data used in this research was DEM,
tem-1Hydrologic Engineering Centers River Analysis System(HEC-RAS) is one of the most applicable software in flood modelling released by USACE (United States Army Corps of Engineers,
DOI: 10.4236/jgis.2017.95032 507 Journal of Geographic Information System poral precipitation data and land use values. The result showed that different part of the city including streets, canals and residential area can be affected by flood flow in case of intense precipitation and overloading the drainage system. Some researchers go steps further and not only simulate flooding but try to also measure the vulnerability of a city to flooding and make a city more resilient against flood. In this way, Lhomme and collogues [1], developing a Web-GIS for resistance capacity, absorption capacity and recovery capacity of different net-works, tried to propose a framework to improve urban resilience in facing to flooding. In their research, the stress was on the urban networks and how the ef-ficiency of such networks plays an important role in economic activity and other public facilities and infrastructures. Gil and Steinbach [16] used objective prop-erties of the road network such as connectivity, closeness and between ness to show the indirect effect of flood Hazard on transport and socio-economic situa-tions in London. In their paper, areas of impact were assessed based on two pa-rameters, the level of separation from the rest of the city and the degree of acces-sibility to the rest of the city. The term resilience was coined in ecology by Hol-ling [17, P.14] and defined as “a measure of the persistence of systems and of their ability to absorb change and disturbance and still maintain the same rela-tionships between populations or state variables”. Given the enhancing use of the term in many different fields such as economy, sociology, networking and engineering the definition and concept of resilience can vary and sometimes is malleable as it can be in contrast to its definition in other disciplines. The main difficulties occur when efforts are devoted to form the concept in order to take the term out of a purely abstract and general form and advance it toward a spe-cific characteristic in a measurable and functional form [18][4][19]. However, there are common definitions of resilience in urban planning and disaster man-agement. Wilbanks [20] defined urban resilience as “capability to prepare for, respond to, and recover from significant multi-hazard threats with minimum damage to public safety and health, the economy, and security” and Lhomme et al.[21] defined it as “the ability of a city to operate in a degraded mode (absorp-tion capacity) and to recover its func(absorp-tions, despite the fact that some urban components are disrupted”. UNSIDR [22] defined resilience in disaster man-agement as “the ability of a system, community or society exposed to hazards to resist, absorb, accommodate to and recover from the effects of a hazard in a timely and efficient manner, including through the preservation and restoration of its essential basic structures and functions.” In this view, as Carpenter et al.
[23] noticed the main questions are resilience of what or resilience to what ra-ther than the terminology itself. In contrast to flood modeling and flood simula-tion with a long history, urban resilience against flood Hazard is still under de-velopment due to the complexity of the urban systems and urban drainage sys-tems [24]. It has been proven that urban forms and urbanization patterns are in close relationships and interaction with natural phenomena and the balance be-tween them might break or disrupt with changing or damaging the physical structure of the cities [25][26][27][28][29]. Flood Hazard and urban flooding
DOI: 10.4236/jgis.2017.95032 508 Journal of Geographic Information System thus as physical phenomena are influenced by the form of the cities and thus the magnitude of their impacts on urban infrastructures and human lives can be in-tensified by urban infrastructures such as street networks and buildings [24]. The aim of this research is to measure the resilience of a city against flooding according to the impacts of flooding on the street networks using two different methods; a syntactic measurement of the street networks discussed in space syn-tax research [27][30], as its combination with resilience has recently proposed different approaches in assessing resilience, covering a range of possibilities from theory to practice at different scales of built environment from building to urban scale [18][31][32][33]; and a metric measurement of accessibility of the street networks to amenities. In this view, comparing the syntactic properties of the street networks before and after flooding as well as exploring changes in the ac-cessibility of the street networks after flooding are the ways conducted in this research in order to investigate the degree of resilience and vulnerability of the city against flooding.
The rest of this paper is organized as follows: in the next section, the study area and data used in this research are explained. The method to simulate flood-ing is briefly discussed and mostly referred to the work of the other researchers, since they are not central to this paper. Then, syntactic properties of the street networks are introduced and the way to calculate syntactic parameters of resi-lience is explained. Taking advantage of spatial analyses and statistics, the results of different analyses are illustrated and discussed in the result and discussion section. The paper ends up with the conclusions.
2. Study Area and Dataset
2.1. Study Area
Gothenburg with a population of 544285 is the second largest city in Sweden af-ter the capital Stockholm (SCB, 2016, www.scb.se). The city is located on the west coast, in southwestern Sweden and the average elevation of the city is about 12 meters from the sea level. Göta River originates from the Vanern Lake and after over a distance of 93 km and passing through the city of Gothenburg emp-ties into the Kattegat sea area in Baltic Sea. Göta River is Sweden's largest and richest rivers and represents, for example, the water source for drinking water to approximately 700,000 people. The river is used for many different interests. Göta River is also of great importance for agriculture and absolutely necessary to industries and other businesses to function. With an average water discharge of 563 m3/s Göta River as a natural resource not only influences the flora and fauna around itself but it also has a great impact on the community and the city streaming in [34]. Figure 1 shows the city and the flow of Göta River.
The city of Gothenburg is located in the estuary of Göta River along the coast of Kattegat, placing the city at high risk of rising water level of both the sea and the river, causing flooding in the city. Following a global trend, the rate of flooding in Gothenburg is increasing in recent years [15][35]. Thus, measuring and estimating the flood risk, mapping and assessing potential damage and eco-
DOI: 10.4236/jgis.2017.95032 509 Journal of Geographic Information System Figure 1. Position of Göta River in the city of Gothenburg.
nomical loss are not only of interest for researchers but are critical for city plan-ners and other societies of the city dealing with flood Hazard and city infra-structures [34].
This paper aims at estimating flood in the city with different return periods in order to map the area at high risk and from that assess the resilience of the city against different simulated floods. The study area, in this research, is limited to that part of the river streaming in the city (municipality border) and flood simu-lation and its potential impacts on the structure of the city are investigated in such area.
2.2. Dataset
Data required for this paper are obtained from the following sources:
- Digital elevation model (DEM) with a resolution of 2 meters which covers the whole study area. The data source used for DEM production is LAS dataset which is an industry-standard binary format for storing airborne LIDAR data, provided by the Lantmäteriet (Swedish National Land Survey:
http://www.lantmateriet.se/) with an average spacing of 0.6 meter. All the ana-lyses and converting LAS dataset to raster were done in ArcGIS and using LAS dataset toolbar embedded in this software.
It should be noted that in order for accuracy of the flooded area, in this re-search, both digital train model and digital surface model are produced. In this view, the real height of objects such as street networks and bridges can be deter-mined, helping find out if the flooded area inundates such objects.
DOI: 10.4236/jgis.2017.95032 510 Journal of Geographic Information System street map (OSM, downloaded from https://www.geofabrik.de/).
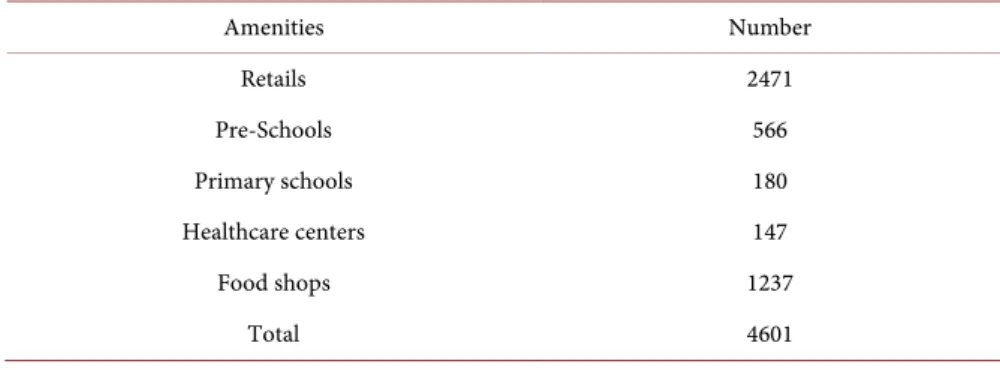
- Urban infra structures including the location of amenities (Figure 2) col-lected from a project called “Dela[d] Stad” [36] funded by Boverket/MISTRA Urban Futures (Table 1).
- Hydrological data and measurements of the river flows for a period of 15 years collected from the Swedish Meteorological and Hydrological Institute (SMHI)
(http://vattenwebb.smhi.se/modelarea/).
The normal editing on street networks and other data are done to make them GIS-ready and usable for the next analyses.
Due to completely different but relative analyses done for this research, the methodology is divided into three parts. In the first part, the methods to simu-late flood flow explained. In the second part, the method used for defining and measuring the resilience in the city based on syntactic properties is discussed
Figure 2. Distribution of different amenities in the cities. Table 1. Different amenities used in this study.
Amenities Number Retails 2471 Pre-Schools 566 Primary schools 180 Healthcare centers 147 Food shops 1237 Total 4601
DOI: 10.4236/jgis.2017.95032 511 Journal of Geographic Information System and in the last part with introducing accessibility and the way measuring this value is illustrated. Having a better view of the methodology applied in this re-search each part is supported by a flowchart showing the implementation process in steps.
3. Methodology
3.1. Flood Simulation
River flooding with frequent occurrence can have great impacts in short time on the city and the life style of human. Gothenburg as a river and coastal city shows a higher potential to be exposed by flooding. Mapping the areas drowned by flooding will prepare useful information which can be used in the analysis of re-silience.
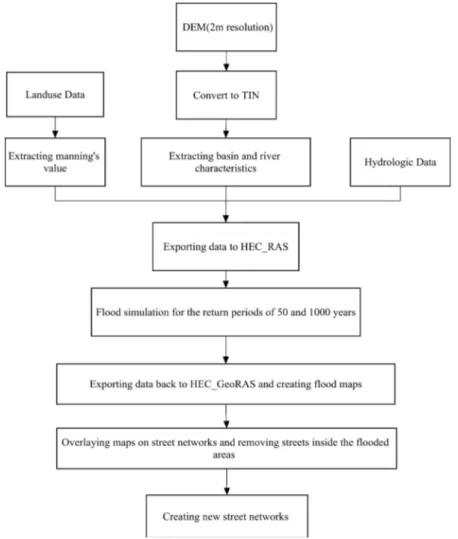
Among different methods and tools used by different researchers, according to the data availability, level of desired accuracy, time and cost consuming. the method represented here is grounded in a GIS platform using tools developed by ESRI and HEC-RAS to model a flood simulation. Flowchart illustrated in Figure 3 shows the implementation process in steps.
DOI: 10.4236/jgis.2017.95032 512 Journal of Geographic Information System It is worth mentioning that due to some simplifications applied on such si-mulation, it should not be used by city planners as a high accurate result in their decision, but generally suggests a reliable method to analyze and measure the impact of flood Hazard on the city in order to assess the resilience and vulnera-bility of the city against such disturbances. Furthermore, the main part of this research is on measuring the city resilience in presence of flood Hazard, finding out how a city interacts with disasters causing changes in the structure of the city.
The first step is the preparation of DEM model of the study area obtained in a resolution of 2 meters from Lantmäteriet (https://www.lantmateriet.se). In the second step the maximum annual instant flows for the study area are obtained from SMHI. Then, using HEC-GeoRAS as a module embedded in ArcGIS soft-ware, the delineation of the watershed and stream network and geometric data including cross sections, flow direction, bank areas and Manning coefficient us-ing the satellite image and based on the type of land use map are prepared and used as inputs to HEC-RAS to simulate potential water flow or flooding accord-ing to different return periods of 50 and 1000 years. In the end, the result is converted to the GIS platform to prepare the flood map (see [3][12][37]).
3.2. How to Measure Resilience
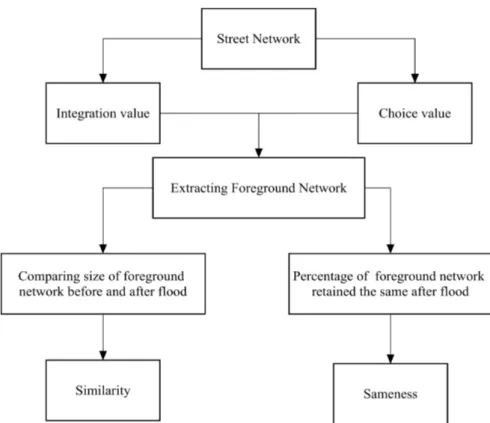
The main part of the methodology is devoted to measuring the resilience of the city against flood Hazard. The basis of resilience discussed in this research is on measuring Space Syntax properties including normalized angular integration value (NAIN) and normalized angular choice value (NACH) (cf. to [38][39]). Integration is defined as the degree to which each segment, forming the street networks, is accessible from all others in a system. In this view, integration is comparable to closeness centrality [40]. Choice value is comparable to between-ness [41] in graph theory and is defined as the number of shortest paths that passes through each segment of all shortest paths between all pairs of segments in a system. A segment is a straight part of the street which lies between two consecutive intersections [39]. In line with this visualization, foreground net-work as a rudimentary concept is defined and applied to the street netnet-works. Foreground network is part of the network which links the city centers together in different scales and normally includes longer and straighter segments of the network. To apply this concept to the street networks, according to the defini-tion of NAIN and NACH, in this research, foreground network is considered as the number of segments with the top 10 percent of NACH and NAIN values [27] [18]. Now, similarity and sameness as the two measures to evaluate the degree of resilience of the city are introduced. Similarity measures the degree to which the size of foreground network has changed after a disturbance. This change can be calculated based on Equation (1),
(
)
x A B A
∆ = − (1) where Δx is the change in the size of the foreground network, and A and B are
DOI: 10.4236/jgis.2017.95032 513 Journal of Geographic Information System the size of the foreground network before and after a disturbance. In this view, the city structure is more similar, if Δx tends toward zero. Sameness measures the degree to which the segments forming foreground network before a distur-bance also remain the same after that disturdistur-bance. In this view, a comparison of geometry of segments forming foreground networks before and after a distur-bance can reveal the percentage of the segments remaining the same after dis-turbance. Sameness differs from zero to one, meaning that a higher percentage of sameness points out to relatively a higher resilience in the structure of the city and vice versa (refer to [18] for details). Figure 4 shows a flowchart illustrating the process of extracting these two measures.
Another subject, proposed in this research to evaluate the resilience of the city is accessibility which can be defined and measured as the ease with which amen-ities can be reached from an origin through street networks in a city. In this view, accessibility can be affected and confined by flooding according to near-ness or farnear-ness of an amenity to the flooded areas. In this research, accessibility is calculated based on the metric distance measured on street networks and illu-strated as the number of amenities located within specific distances from street networks (Figure 5). Comparing accessibility measures before and after each disturbance will show the street networks of which their accessibility has changed after flooding. The impact of such disturbances is illustrated in the number and the intensity of changes in the accessibility of the street networks to different amenities.
Figure 4. Flowchart of measuring the resilience of street networks based on foreground network.
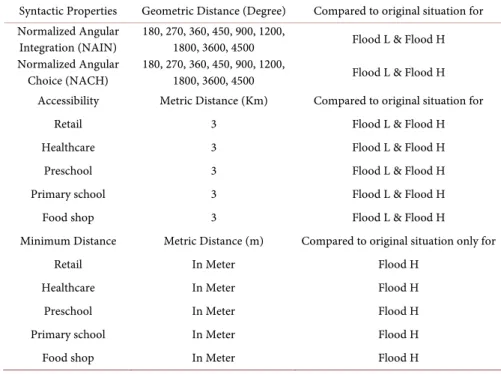
DOI: 10.4236/jgis.2017.95032 514 Journal of Geographic Information System Summarizing this section and better understanding of what analyses are going to be done in this research, Table 2 shows the list of all analyses conducted in
Figure 5. Accessible amenities within 100 meters from an origin (green point). It can be seen that the number of amenities fallen in the red circle (buffer around the origin) is dif-ferent with the number of amenities fallen in the green polygon (accessibility on the street network).
Table 2. List of analyses conducted on street networks.
Syntactic Properties Geometric Distance (Degree) Compared to original situation for Normalized Angular
Integration (NAIN) 180, 270, 360, 450, 900, 1200, 1800, 3600, 4500 Flood L & Flood H Normalized Angular
Choice (NACH) 180, 270, 360, 450, 900, 1200, 1800, 3600, 4500 Flood L & Flood H Accessibility Metric Distance (Km) Compared to original situation for
Retail 3 Flood L & Flood H
Healthcare 3 Flood L & Flood H
Preschool 3 Flood L & Flood H
Primary school 3 Flood L & Flood H
Food shop 3 Flood L & Flood H
Minimum Distance Metric Distance (m) Compared to original situation only for
Retail In Meter Flood H
Healthcare In Meter Flood H
Preschool In Meter Flood H
Primary school In Meter Flood H
DOI: 10.4236/jgis.2017.95032 515 Journal of Geographic Information System this research. As seen, the main analyses are syntactic properties of the street networks based on NAIN and NACH properties, accessibility analysis of the street networks to the different amenities and analysis of the minimum distance of the street networks to amenities. It is worth mentioning that the results of all 3 analyses are illustrated and discussed in a comparison manner to realize the effect of flooding on the street networks.
4. Results and Discussions
The results are illustrated in a comparative manner, meaning that the same ana-lyses are conducted on street networks before (in the steady state of the city without any disturbance) and after the disturbances when the streets inundated by flooding are removed from the network. Comparing these two situations can realize the degree to which the city keeps its resilience against flooding. The sec-tion starts with the comparison between syntactic properties (NACH and NAIN) of the city to show how such values changes before and after flood inundations. It should be noted that flood simulation calculated for the two return periods of 50 and 1000 years, hereafter called Flood L (low flooding) and Flood H (high flooding) respectively. In the main part of this section, the city resilience based on similarity and sameness measures and accessibility of street networks to dif-ferent amenities is examined before and after flooding in order to figure out how the city is resilient to such disturbances. Table 2 shows the list of different ana-lyses done for this research.
4.1. Syntactic Properties
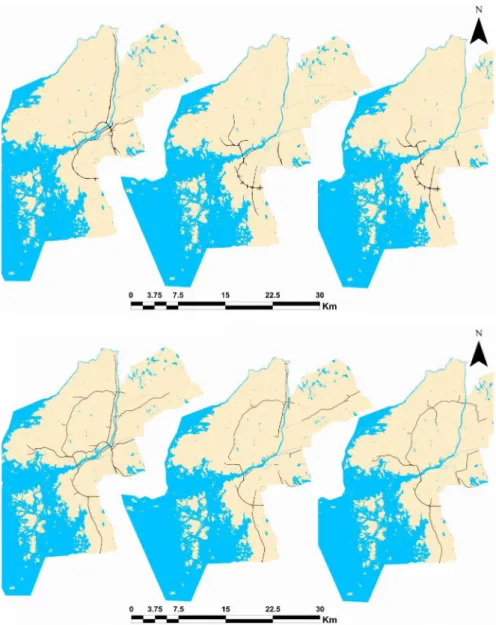
Figure 6 shows the segments and the areas inundated (directly affected) by
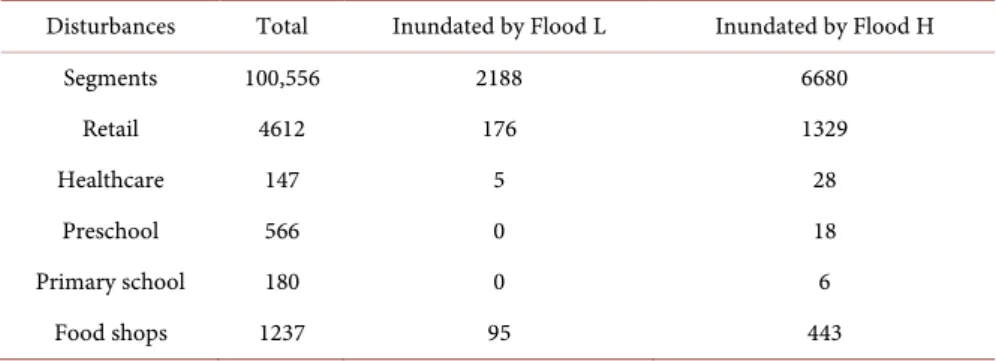
flooding with two different return periods. Table 3 includes number of segments and amenities located in the area inundated by flooding. What should be noticed in this research, is that the terms inundated and affected are used to address to different concepts. In this view, the term inundated points to segments and amenities drowned by water, while the term affected points to all other segments and amenities located outside the flooded areas and indirectly affected by flood-ing. The focus of this research is on affected parts and puts away inundated parts from the analyses. As an expected trend, the number of segments and amenities inundated by Flood H is more than Flood L.
Figure 7 shows NACH and NAIN values at global scale (angular analysis in
4500 degrees is considered as global) in different situations. As an interesting point, it can be seen that after Flood L and Flood H, the maximum NACH values increase, compared to the original situation. Additionally, segments with the high values (colored in black) are slightly moved back from the center and around the river, a spatial trend seen more in Flood H and less in Flood L re-spectively. For NAIN values, the maximum values vividly reduce after all dis-turbances (more in Flood H and less in Flood L respectively) and segments with the high values are intensely disappeared from the city center and around the river compared to the original situation.
DOI: 10.4236/jgis.2017.95032 516 Journal of Geographic Information System Figure 6. Street segments inundated (black) by Flood L (right) and Flood H (left), re-moved from the network for a comparative analysis.
Table 3. Number of segments and amenities directly affected (inundated) by flooding. Disturbances Total Inundated by Flood L Inundated by Flood H
Segments 100,556 2188 6680 Retail 4612 176 1329 Healthcare 147 5 28 Preschool 566 0 18 Primary school 180 0 6 Food shops 1237 95 443
Table 4 shows mean and maximum NACH and NAIN values extracted from
street networks in different angular distances from local scales (180 - 450 grees) to mid scales (900 - 1800 degrees) and global scales (3600 and 4500 de-grees) before and after disturbances. As an expected trend in all situations and for both mean and maximum values, NACH and NAIN values reduce as they move from local to global scales. As an example, NACH property at the local scale (180 degrees) for original situation is 1.207, while it reduces to 0.911 at the global scale of 4500 degrees. Understanding how flooding changes the syntactic properties of the street networks, a comparison on the values before and after disturbances are conducted and the differences to original situation at each scale are illustrated in diagrams (Figure 8 and Figure 9).
To be consistent with the results, in all cases the values of original situation is subtracted from the disturbed situations (flood inundations). As a general trend, the differences in the mean value for all situations and for both NACH and NAIN values are positive or zero, meaning that the mean values decrease or re-
DOI: 10.4236/jgis.2017.95032 517 Journal of Geographic Information System Figure 7. Global NACH (upper) and NAIN (lower) values of the city in different situa-tions.
main unchanged after disturbances. The other trend which is also more or less the same is that the differences increase as the scale of angular analyses increase toward the global level. Having this in detail, Figure 8 shows the differences for mean NACH and NAIN values on diagrams. As seen, for NACH (upper dia-gram), despite the generally increasing pattern, differences at the middle scales (900 and 1200 degrees) slightly reduce and rise again with moving to global scale. Such pattern is not seen for NAIN (lower diagram), as it shows steady in-crease in the differences, while increasing the scale. Based on Figure 8, flood
DOI: 10.4236/jgis.2017.95032 518 Journal of Geographic Information System Table 4. NACH and NAIN properties of the street network calculated in different radii (O: original situation, L: Flood L and H: Flood H).
NACH (degree) O_mean L_mean H_mean O_maximum L_ maximum H_maximum 180 (Local) 1.207 1.203 1.203 2.372 2.372 2.372 270 1.132 1.127 1.127 1.827 1.827 1.827 360 1.086 1.082 1.081 1.603 1.603 1.603 450 1.055 1.051 1.050 1.541 1.541 1.541 900 0.976 0.974 0.972 1.421 1.422 1.445 1200 0.950 0.949 0.947 1.436 1.436 1.447 1800 0.924 0.921 0.919 1.426 1.421 1.419 3600 0.910 0.895 0.889 1.485 1.483 1.473 4500 (Global) 0.911 0.893 0.886 1.490 1.499 1.494 NAIN(degree) O_mean L_mean H_mean O_maximum L_maximum H_maximum
180 (Local) 1.720 1.717 1.715 4.187 4.187 4.199 270 1.259 1.254 1.249 2.505 2.504 2.504 360 1.027 1.020 1.013 1.596 1.596 1.599 450 0.887 0.878 0.871 1.4 1.404 1.402 900 0.613 0.597 0.587 1.018 1.001 0.992 1200 0.548 0.527 0.516 0.902 0.880 0.866 1800 0.486 0.454 0.442 0.772 0.723 0.709 3600 0.421 0.363 0.348 0.669 0.560 0.541 4500 (Global) 0.415 0.347 0.331 0.665 0.541 0.520
inundations show the higher differences and such differences increase as the analyses move toward the global scales. In this view, the maximum difference for NACH value is seen in 4500 degrees for flood (H) which is equal to 0.025 fol-lowed by 0.018 for flood (L) respectively. The maximum difference in NAIN value is also seen in 4500 degrees for flood (H) which is equal to 0.084 and fol-lowed by 0.068 and 0.50 for flood (L) accordingly.
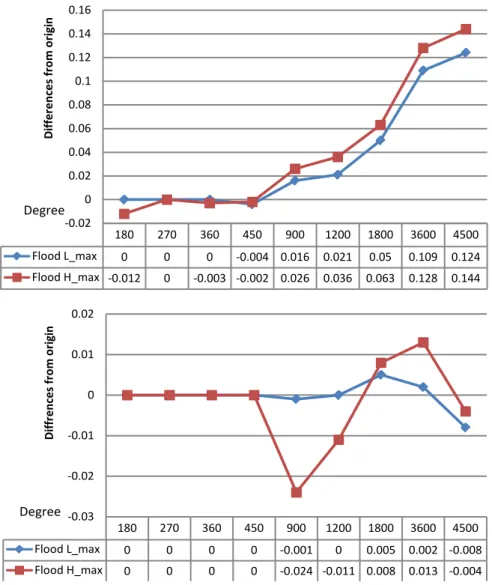
Additionally, the results show that NAIN values compared to NACH values are more affected by disturbances. Figure 9 shows differences for the maximum values on diagrams. As seen, differences in NACH values (upper diagram) fol-low different trend as that in the mean values. In this case, differences are zero at the local scales (180, 270, 360 and 450 degrees) for all situations, while taking negative values at the mid scales (900 and 1200 degrees) for Flood H. However, at the global scales (3600 and 4500 degrees) both Flood H and Flood L show positive values in 3600 degrees and negative values in 4500 degrees. For NAIN values, the maximum difference is seen in 4500 degrees for all situations and it is 0.145 for flood (H), 0.124 for flood (L). As a conclusion for this part, it can be stated that disturbances such as flood inundations influence syntactic properties
DOI: 10.4236/jgis.2017.95032 519 Journal of Geographic Information System Figure 8. Differences in NACH (upper) and NAIN (lower) properties from local to global for different disturbances.
of the city structure by generally decreasing the values for NAIN and NACH properties less at local scales and more at global scales. The only exception is maximum NACH values that follow a nuanced trend at local and global scales for different situations.
4.2. Similarity
As explained in the previous section, the basis for measuring similarity and sameness is foreground network. Figure 10 shows the foreground network based on NAIN and NACH values before and after the disturbances. It should be noted that the foreground network for all situations considers the segments which have the top 10 percent values of NAIN and NACH measures of angular segment analysis at a global scale (4500 degrees). As seen in Figure 10, fore-ground network (NAIN derivation) in the original situation is expanded to the both sides of the river and follows the river direction specifically in the northern part. The number of segments forming the foreground network is equal to1580 based on Table 5. In Figure 10 (mid upper), foreground network after Flood L
180 270 360 450 900 1200 1800 3600 4500 Flood L_mean 0.004 0.006 0.007 0.009 0.016 0.022 0.032 0.058 0.067 Flood H_mean 0.005 0.011 0.014 0.016 0.026 0.032 0.044 0.073 0.084 0 0.01 0.02 0.03 0.04 0.05 0.06 0.07 0.08 0.09 Di ffe re nc es fro m o rig in Degree 180 270 360 450 900 1200 1800 3600 4500 Flood L_mean 0.004 0.004 0.004 0.004 0.002 0.002 0.003 0.016 0.018 Flood H_mean 0.004 0.005 0.005 0.005 0.004 0.003 0.005 0.021 0.025 0 0.005 0.01 0.015 0.02 0.025 0.03 Di ffr en ces fro m or ig in e Degree
DOI: 10.4236/jgis.2017.95032 520 Journal of Geographic Information System Figure 9. Differences in Maximum NACH (upper) and maximum NAIN (lower) proper-ties from local to global for different disturbances
Table 5. Size of foreground network and similarity measured based on NACH and NAIN values in different situations.
Number of segments in Foreground network Similarity to origin Situations Original Flood L Flood H Flood L Flood H
NACH 2035 1073 1165 0.473 0.428
NAIN 1580 1515 1549 0.041 0.02
shows that the upper part of original foreground network is removed and only the lower part remains. To compensate the effect of disturbance, the expansion of foreground network is perpendicular to the river direction. In this case, the number of segments forming foreground network is 1515 and the size of change is 0.041 based on Table 5. The situation after Flood H, based on Figure 10 (up-per right), follows closely the same situation as Flood L, except that the number of segments forming the foreground network is 1549 which is higher than Flood
180 270 360 450 900 1200 1800 3600 4500 Flood L_max 0 0 0 -0.004 0.016 0.021 0.05 0.109 0.124 Flood H_max -0.012 0 -0.003 -0.002 0.026 0.036 0.063 0.128 0.144 -0.02 0 0.02 0.04 0.06 0.08 0.1 0.12 0.14 0.16 Di ffe re nc es fro m o rig in Degree 180 270 360 450 900 1200 1800 3600 4500 Flood L_max 0 0 0 0 -0.001 0 0.005 0.002 -0.008 Flood H_max 0 0 0 0 -0.024 -0.011 0.008 0.013 -0.004 -0.03 -0.02 -0.01 0 0.01 0.02 Di ffre nc es fro m o rig in Degree
DOI: 10.4236/jgis.2017.95032 521 Journal of Geographic Information System Figure 10. Foreground network of the street segments in different situations: NAIN derivation (upper) and NACH derivation (lower). From left to right: original, After Flood L and After Flood H
L, consequently resulted in the smaller size of change (0.020) and indeed higher similarity. The situation is different for NACH values. Figure 10 (lower left) shows that foreground network (NACH), in the original situation is expanded around the river on the both sides and follows the direction of river and its main tributaries. The number of segments forming the foreground network is 2035 based on Table 5. As a similar occurrence in both situations (Flood L and Flood H) and for both properties (NAIN and NACH), the tunnel is removed from the foreground network and the foreground network, no longer follows the river stream.
Figure 10 (mid lower) shows that the foreground network after Flood L is
moved from the center of the city in the both sides of the river and forms only the outer parts. The tunnel is removed and the upper bridge loses some of its
DOI: 10.4236/jgis.2017.95032 522 Journal of Geographic Information System connection in the northern part. Based on Table 5 the number of segments and the size of change in foreground network are 1073 and 0.473 accordingly. Final-ly, in Figure 10 (lower right), foreground network after Flood H is removed completely from the center of the city. The tunnel is removed but the bridge re-tains its connections and new connections are also added to the bridge in the north part. In this view, the number of segments and the size of changes in fore-ground network are 1165 and 0.428 respectively (Table 5). This makes the size of foreground network after Flood H more similar to original foreground net-work.
4.3. Sameness
As discussed in methodology, the number of such segments compared with the total number of segments forming the foreground network defines sameness measure which is a factor to show how resilient the city is against disturbances. In this view, the greater number of unchanged segments conveys the higher resi-lient in the street networks. Figure 11 shows the segments of foreground net-work remained unchanged after disturbances. As a similar trend in both Flood L and Flood H, it can be seen that the impact of flooding on the riparian areas causes that the same segments are located far from the river. Figure 11 also shows that the connection of the two riverbanks, inside the city area, is limited to a bridge (Älvsborg Bridge) in the south and both Göta Älv Bridge and Tingstad Tunnel in the middle and the north of the city are removed from the city transport system.
Table 6 shows the results of sameness in different situations for the city of
Gothenburg. Flood L has the lowest sameness for NACH (0.408) and Flood H has the lowest sameness for NAIN (0.301).
Flood H also shows the higher sameness than Flood L for NACH values which literally points out to relatively a higher resilience. According to Figure 10 and
Figure 11 and Table 5 and Table 6, it can be seen that Flood H shows higher
re-silient in the foreground network compared to Flood L, although the number of segments inundated by Flood H is much more than by Flood L. It seems that in the case of Flood H, by removing more segments from the original network, the city restore itself by making new connections around the original foreground network while in the situation of Flood L, the observed compensation lacks such connections.
4.4. Accessibility
Accessibility analysis as defined in the methodology part is conducted on the city network in different situations before and after disturbances to show how flood inundations influence accessibility to different amenities in the city. In this sec-tion accessibility is measured based on metric distance (3000 meters as a basis) on city network before flooding and then it is compared to the same measure af-ter flooding. As an agreement in this paper, without considering the direction of
DOI: 10.4236/jgis.2017.95032 523 Journal of Geographic Information System Figure 11. Unchanged segments after each disturbance compared to the original situa-tion: NAIN (upper) and NACH (lower) derivations. From left to right: original, After Flood L and After Flood H.
Table 6. Sameness measured based on NACH and NAIN in different situations. Number of same segments to origin Degree of Sameness
Situations Flood L Flood L Flood L Flood H
NACH 831 864 0.408 0.425
NAIN 523 476 0.331 0.301
the river, the left part of the river is determined as the northern part and the right part of the river as the southern part.
4.4.1. Accessibility to Retails
DOI: 10.4236/jgis.2017.95032 524 Journal of Geographic Information System
Figure 12. Differences in accessibility to retails calculated in a radius of 3 kilometers from the street networks: Flood L (left) and Flood H (right). Differences are increased from green to red.
and flood situations is shown in different colors from green color showing the low differences to red color showing the high differences. As seen, the area of differences for Flood L is distributed asymmetrically to the both sides of river, but with a high change in the middle of the river city. As an interesting point, the riparian areas in the southern side are less affected by Flood L compared to the northern side. The most affected areas in the southern side occur along the sub stream river. Figure 12 (right) shows a different situation for Flood H and the areas of impact are expanded. In this view, the riparian areas in the both sides are highly affected and the total number of segments affected by Flood H (23603) is increased compared to Flood L (20780) based on Table 7. However, the asymmetrical distribution of accessibility differentiation is yet seen and same as Flood L, the area along the sub stream river is highly affected and further ex-tended to the both sides of the sub stream.
4.4.2. Accessibility to Healthcare Centers
In Figure 13, the difference in accessibility to healthcare centers for Flood L and
Flood H is illustrated. In Flood L situation, same as accessibility to retails, the in-fluenced areas are not distributed equally to the both sides, as it is more ex-
DOI: 10.4236/jgis.2017.95032 525 Journal of Geographic Information System
Figure 13. Differences in accessibility to healthcare centers calculated in a radius of 3 kilometers from the street networks: Flood L (left) and Flood H (right). Differences are increased from green to red.
Table 7. Number of segments of which accessibility and minimum distance are affected by Flood L and Flood H for different amenities separately.
Flood-L Flood-H
Amenities Accessibility Minimum distance Accessibility Minimum distance
Retails 20,780 737 23,603 547
Healthcare 12,060 2748 14,994 3788
Preschool 9391 1776 14,453 818
Primary school 7465 1442 10,336 1205
Foods shops 22,030 734 21265 1773
tended in the southern part of the river alongside the sub stream. Additionally, as seen in Figure 13, the eastern part of the sub stream is also more affected compared to the western part, while the western part is more expanded. The sit-uation in the northern part of the river shows that riparian areas spatially in the middle part are more influenced by Flood L. Looking at Figure 13 for Flood H (right), three different distributions are recognized. A more affected but less dis-tributed area is located in the eastern part of the sub stream, a low to mid
af-DOI: 10.4236/jgis.2017.95032 526 Journal of Geographic Information System fected but more distributed in the western part of the sub stream and a low af-fected and less distributed area located in the northern part of the main river. Riparian areas in the southern side of the river are generally more affected than areas in the northern side of the river. Table 7 shows the number of segments which their accessibility reduces after flood events. Based on Table 7, the num-ber of affected segments for healthcare centers is less than for retails, stating a higher impact of flooding on retails.
4.4.3. Accessibility to Preschools and Primary Schools
In Figure 14(a) and Figure 14(b), the differences in accessibility to preschools
and primary schools after disturbances are investigated. Despite following a sim-ilar trend to the other amenities, there are yet differences in their distributions. For Flood L, the southern part and the area along the sub stream is intensively affected for both preschools and primary schools. In the northern part, the mar-ginal area along the river shows higher impact. However, as seen in Figure 14(a)
preschools are more affected by Flood L rather than primary schools. This can be found by both broader distributions of affected areas and the number of seg-ments with the higher impact (orange and red colors) in preschools compared to
DOI: 10.4236/jgis.2017.95032 527 Journal of Geographic Information System
(b)
Figure 14. (a) Differences in accessibility to preschools calculated in a radius of 3 kilometers from the street networks. Flood L (left) and Flood H (right). Differences are increased from green to red; (b) differences in accessibility to primary school calculated in a radius of 3 kilometers from the street networks. Flood L (left) and Flood H (right). Differences are increased from green to red.
primary schools. For Flood H, the affected areas for preschools are more distri-buted compared to primary schools. This can be seen on both sides of the river. Additionally, Flood H, same as Flood L, has a higher impact on the accessibility to preschools than to primary schools, represented by more areas highlighted in red for preschools. Table 7 also shows that the number of segments with a re-duced accessibility for preschools (14,453) is higher than for primary schools (10,336). However, the number of segments affected by flooding for schools is by far less than for healthcare centers and retails.
4.4.4. Accessibility to Food Shops
By comparing the influenced areas for Flood L and Flood H in Figure 15, it can be seen that the general trend of both flooding is similar and the differences is in the degree of impact which is obviously higher for Flood H. Same as the other amenities, the affected areas are more distributed in the southern part of the riv-er spatially around the sub stream. For Flood L, this distribution to some extent follows the river stream, a trend also seen in retails but not seen in schools and healthcare centers. The reason might be in the higher distribution of such amen-
DOI: 10.4236/jgis.2017.95032 528 Journal of Geographic Information System
Figure 15. Differences in accessibility to food shops calculated in a radius of 3 kilometers from the street networks. From left to right: Flood L and Flood H. Differences are increased from green to red.
ities around the river stream (Figure 2). For Flood H, although the degree of impact is higher than Flood L, as an interesting point, the number of affected segments is less than Flood L. this can be found by Table 7 in which the number of affected segments for Flood L is 22030 while it is 21265 for Flood H. This is because, as previously mentioned, in this research the focus is on the segments affected by flooding not inundated by that. In this view, by considering the number of segment directly affected (inundated) by flooding obtained in Table 2, it can be seen that 6680 segments are inundated by Flood H which is much bigger than 2188 segments inundated by Flood L.
4.4.5. Minimum Distance to Different Amenities
One of the important parameters representing the impact of flood events on the city structure is changes in the minimum distance to amenities. In this view, areas with a higher impact usually show an increase in the distance to the closest amenity. In the last part of this paper the analysis of the minimum distance to the different amenities is done. Thanks to slight changes in the minimum dis-tance to the amenities specifically after Flood L, in this section the result is illu-strated only for Flood H, but Table 7 contains the results for both situations. As a general trend in all maps in Figures 16(a)-(e), the effect of Flood H on the minimum distance to amenities is low and mostly limited to few segments in the
DOI: 10.4236/jgis.2017.95032 529 Journal of Geographic Information System
(a) (b)
DOI: 10.4236/jgis.2017.95032 530 Journal of Geographic Information System
(e)
Figure 16. Segments of which the minimum distance to different amenities are increased after Flood H. (a) retails; (b) primary school; (c) preschool; (d) food shops and (e) healthcare centers. Green (low changes) and red (high changes).
riparian areas of the main river, while their distributions are not symmetric and do not follow the direction of main river. It can be seen that the most affected amenity by minimum distance is healthcare centers (3788 segments). As such, retails are the least affected amenities (547) among all. This is because of the dif-ferences in the distributions (Figure 2) and in the number of different amenities
(Table 1), causing one amenity (healthcare here) more and another (retails here)
less vulnerable to flooding. Additionally, as a difference between the preschools and primary schools’ tendencies, it can be seen that the minimum distance for primary schools is more affected by Flood H spatially on the northern side of the river. As an interesting point, it can be seen that Älvsborg Bridge in retails and healthcare centers is also affected and its minimum distance to these amenities is increased. In this view, the degree of impact for healthcare centers is bigger since the bridge is highlighted in red while for retails it is seen in orange. It should be noted again that the results illustrated here focus on the segments and amenities outside of the inundated areas and tries to illustrate the effect of flooding on the rest of the city. This, therefore, means that the segments and amenities affected directly (inundated) by such disturbances are locked up from the entire analyses in this research. Table 3 gives a summary of the segments and amenities
re-DOI: 10.4236/jgis.2017.95032 531 Journal of Geographic Information System moved from the analyses.
5. Conclusions
Flooding as natural disasters with rapid increase of their occurrences has great impact on the structure of cities and the city networks. Thus, investigating the impact of such disasters, and determining sensitive and high-risk areas of the city are essential in order to manage and reduce the risk of such disasters. In this paper, the resilience of the city of Gothenburg against river flooding is investi-gated. Two different methods are conducted on the street networks; syntactic re-silience and accessibility assessment. In the syntactic rere-silience, two factor simi-larity and sameness are applied on the foreground network of the city.
Similarity for NAIN and NACH properties shows that the city after Flood H is more similar to the original situation according to the size of foreground net-work. The result of sameness for NAIN shows that the city after Flood L has a higher degree of sameness, while sameness of the city after Flood H for NACH property is higher. In this view, the overall results of syntactic resilience state that the city after Flood H is more resilient than after Flood L. Again, it should be noticed that the analyses are focused on the remaining areas after flooding and the inundated areas are excluded from the analyses. The comparison of syn-tactic properties of the street networks in different angular radii before and after flooding shows that NAIN and NACH properties are affected by flooding, as in most cases the degree of changes (decrease or increase) at medium and global scales is higher. Additionally, in most cases, except for maximum NACH, syn-tactic values after flooding reduce in which the maximum reduction in most cases goes for the city after Flood H.
In accessibility analysis, two parameters are measured; accessibility of street networks to different amenities in the city and the minimum metric distance to amenities. As a general trend, Flood H influences the accessibility to amenities more than flood L and in this respect, it can be stated that the city is more resi-lient after Flood L. However, the results of accessibility are different according to different amenities. In this view, retails and food shops are more affected by flooding, while schools show the minimum impact of flooding. Additionally, the results show that the disturbances do not influence the minimum distance to amenities significantly and the number of affected segments are low, particularly compared with the affected segments in accessibility analysis. In this view, healthcare centers show the highest effect of minimum distance after Flooding, while food shops and retails are amenities with the lowest impact of flooding.
In conclusion, according to the results of different analyses, it can be stated that the city, in general, is more resilient specifically against Flood L and such disturbances do not affect the remaining part of the city significantly. However, it should be noticed that the resilience measured in this research is based on the indirect effect of flooding and, thus, it does not consider directly inundated areas. In this view, more analyses such as the assessment of human and financial
DOI: 10.4236/jgis.2017.95032 532 Journal of Geographic Information System losses in the flooded areas are also needed in order to have a better estimation of the resilience of the city against such disturbances, stating that the resilience of a city should be investigated from different point of view and based on a bundle of different parameters and, thus, it should not be confined to one or two parame-ters.
References
[1] Lhomme, S., Serre, D., Diab, Y. and Laganier, R. (2013) Analyzing Resilience of Ur-ban Networks: A Preliminary Step towards More Flood Resilient Cities. Natural Hazards and Earth System Sciences, 13, 221-230.
https://doi.org/10.5194/nhess-13-221-2013
[2] Konrad, C.P. (2003) Effects of Urban Development on Floods. US Geological Sur-vey Hydrology Report. https://pubs.usgs.gov/fs/fs07603/
[3] Khattak, M.S., Anwar, F., Saeed, T.U., Sharif, M., Sheraz, K. and Ahmed, A. (2016) Floodplain Mapping Using HEC-RAS and ArcGIS: A Case Study of Kabul River.
Arabian Journal for Science and Engineering, 41, 1375-1390. https://doi.org/10.1007/s13369-015-1915-3
[4] Lhomme, S., Serre, D., Diab, Y. and Laganier, R. (2010) GIS Development for Urban Flood Resilience. WIT Transactions on Ecology and the Environment, 129, 661-671. https://doi.org/10.2495/SC100561
[5] Council Directive (2007/60/EC) of the European Parliament and of the Council of 23 October 2007 on the Assessment and Management of Flood Risks.
[6] Popovska, C. and Ivanoski, D. (2009) Flood Risk Assessment of Urban Areas. In:
Risk Management of Water Supply and Sanitation Systems, Springer, Netherlands, 101-113. https://doi.org/10.1007/978-90-481-2365-0_10
[7] CRED (2015) Report on Human Cost of Natural Disasters. A Global Perspective. http://www.cred.be/publications
[8] EU Water Directors (2003) Best Practice on Flood Prevention, Protection, and Mi-tigation. Water Directors of the European Union, Brussels.
[9] Tucci, C.E. (2007) Urban Flood Management. World Meteorological Organization, Geneva.
[10] Singh, V.P. and Woolhiser, D.A. (2002) Mathematical Modelling of Watershed Hy-drology. Journal of Hydrological Engineering, ASCE, 7, 270-292.
https://doi.org/10.1061/(ASCE)1084-0699(2002)7:4(270)
[11] Zheng, N., Tachikawa, Y. and Takara, K. (2008) A Distributed Flood Inundation Model Integrating with Rainfall-Runoff Processes Using GIS and Remote Sensing Data. The International Archives of the Photogrammetry, Remote Sensing and Spa-tial Information Sciences, 37.
[12] Demir, V. and Kisi, O. (2016) Flood Hazard Mapping by Using Geographic Infor-mation System and Hydraulic Model: Mert River, Samsun, Turkey. Advances in Meteorology, 2016. Ecosystems. Springer.
[13] Wiles, J.J. and Levine, N.S. (2002) A Combined GIS and HEC Model for the Analy-sis of the Effect of Urbanization on Flooding; the Swan Creek Watershed, Ohio. En-vironmental & Engineering Geoscience, 8, 47-61.
https://doi.org/10.2113/gseegeosci.8.1.47
[14] Sole, A., Giosa, L. and Copertino, V. (2007) Risk Flood Areas, a Study Case: Basili-cata Region. WIT Transactions on Ecology and the Environment, 104, 213-228.
DOI: 10.4236/jgis.2017.95032 533 Journal of Geographic Information System https://doi.org/10.2495/RM070211
[15] Filipova, V., Rana, A. and Singh, P. (2012) Urban Flooding in Gothenburg, a MIKE 21 Study. Journal of Water Management and Research, 68.
[16] Gil, J. and Steinbach, P. (2008) From Flood Risk to Indirect Flood Impact: Evalua-tion of Street Network Performance for Effective Management, Response and Re-pair. WIT Transactions on Ecology and the Environment, 118, 335-344.
https://doi.org/10.2495/FRIAR080321
[17] Holling, C.S. (1973) Resilience and Stability of Ecological Systems. Annual Review of Ecology and Systematics, 4, 1-23.
https://doi.org/10.1146/annurev.es.04.110173.000245
[18] Abshirini, E. and Koch, D. (2017) Resilience, Space Syntax and Spatial Interfaces: The Case of River Cities. A|Z ITU Journal of the Faculty of Architecture, 14, 25-41. https://doi.org/10.5505/itujfa.2017.65265
[19] Folke, C. (2006) Resilience: The Emergence of a Perspective for Social-Ecological Systems Analyses. Global Environmental Change, 16, 253-267.
https://doi.org/10.1016/j.gloenvcha.2006.04.002
[20] Wilbanks, T. (2007) The Research Component of the Community and Regiona Re-silience Initiative (CARRI). Presentation at the Natural Hazards Center, University of Colorado-Boulder.
[21] Lhomme, S., Toubin, M., Serre, D., Laganier, R. and Diab, Y. (2011) From Technical Resilience toward Urban Services Resilience. Proceedings of the Fourth Resilience Engineering Symposium, 172-178. https://doi.org/10.4000/books.pressesmines.1043 [22] United Nations International Strategy for Disaster Reduction (UNISDR) (2009)
Geneva, Switzerland.
[23] Carpenter, S., Walker, B., Anderies, M. and Abel, N. (2001) From Metaphor to Measurement: Resilience of What to What? Ecosystems, 4, 765-781.
https://doi.org/10.1007/s10021-001-0045-9
[24] Bacchin, T.K., Veerbeek, W., Pathirana, A., Denekew, H. and Zevenbergen, C. (2011) Spatial Metrics Modeling to Analyse Correlations between Urban Form and Surface Water Drainage Performance. 12th International Conference on Urban Drainage, Porto Alegre, 11-15 September 2011. IWA-International Water Associa-tion.
[25] Herold, M., Goldstein, N.C. and Clarke, K.C. (2003) The Spatiotemporal Form of Urban Growth: Measurement, Analysis and Modeling. Remote Sensing of Envi-ronment, 86, 286-302. https://doi.org/10.1016/S0034-4257(03)00075-0
[26] Alberti, M. (2008) Advances in Urban Ecology: Integrating Humans and Ecological Processes in Urban Ecosystems. Springer, New York, 93-131.
https://doi.org/10.1007/978-0-387-75510-6_4
[27] Hillier, B. and Hanson, J. (1984) The Social Logic of Space. Cambridge University Press, Cambridge. https://doi.org/10.1017/CBO9780511597237
[28] Hillier, B, Turner, A., Tang, T. and Tae-Park, H. (2007) Metric and Topo-Geometric Properties of Urban Street Networks: Some Convergences, Divergences and New Results. Proceedings, 6th International Space Syntax Symposium, Cenkler, Istanbul, 001, 01-22.
[29] Marcus, L. and Colding, J. (2014) Toward an Integrated Theory of Spatial Mor-phology and Resilient Urban Systems. Ecology and Society, 19, 55.
https://doi.org/10.5751/ES-06939-190455
DOI: 10.4236/jgis.2017.95032 534 Journal of Geographic Information System Cambridge University Press, Cambridge.
[31] Koch, D. and Miranda Carranza, P. (2013) Syntactic Resilience. Proceedings of Ninth International Space Syntax Symposium. Sejong University Press, Seoul. [32] Carpenter, A. (2013) Disaster Resilience and the Social Fabric of Space. Proceedings
of the Ninth International Space Syntax. Sejong University, Seoul, 105.
[33] Cutini, V. (2013) The city when it trembles. Earthquake Destructions, Post-Earthquake Reconstruction and Grid Configuration. In: Kim, Y.O., Park, H.T. and Seo, K.W., Eds., Proceedings of the Ninth International Space Syntax, Sejong University, Seoul. [34] Fakta om Göta älv. (2015) En beskrivning av Göta älv och dess avrinningsområde
nedströms Vänern 2015. Göta älvs vattenvårdsförbund. http://www.gotaalvvvf.org/
[35] Herbring, C. and Näslund-Landenmark, B. (2011) Identifiering av områden med betydande översvämningsrisk. Myndigheten för samhällsskydd och beredskap (MSB). Available online:
https://www.msb.se/Upload/Nyheter_press/Pressmeddelanden/Slutrapport_PFRA_ MSB.pdf
[36] Legeby, A., Berghauser Pont, M. and Marcus, L. (2015) Dela[d] stad - Stadsbyggande och segregation. Metoder: Sociala stadsbyggnadsanalyser. TRITA-ARK Forsknings publikationer 2015, 1-5.
[37] Goodell, C. and Warren, C. (2006) Flood Inundation Mapping Using HEC-RAS.
Obras y Proyectos, 18-23.
[38] Hillier, B., W. R. G., Yang, T. and Turner, A. (2012) Normalising Least Angle Choice in Depthmap and How It Opens up New Perspectives on the Global and Local Analysis of City Space. Journal of Space Syntax, 3, 155-193.
[39] Hillier, B. and Iida, S. (2005) Network and Psychological Effects in Urban Move-ment. In: Spatial Information Theory, Springer Berlin Heidelberg, 475-490. https://doi.org/10.1007/11556114_30
[40] Bavelas, A. (1950) Communication Patterns in Task-Oriented Groups. The Journal of Acoustical Society of America, 22, 725-730. https://doi.org/10.1121/1.1906679 [41] Freeman, L.C. (1977) A Set of Measures of Centrality Based on Betweenness.
Soci-ometry, 40, 35-41. https://doi.org/10.2307/3033543
Submit or recommend next manuscript to SCIRP and we will provide best service for you:
Accepting pre-submission inquiries through Email, Facebook, LinkedIn, Twitter, etc. A wide selection of journals (inclusive of 9 subjects, more than 200 journals)
Providing 24-hour high-quality service User-friendly online submission system Fair and swift peer-review system
Efficient typesetting and proofreading procedure
Display of the result of downloads and visits, as well as the number of cited articles Maximum dissemination of your research work
Submit your manuscript at: http://papersubmission.scirp.org/